Dark Matter in Low Surface Brightness Galaxies
Abstract
Low Surface Brightness (LSB) galaxies form a large population of disc galaxies that extend the Hubble sequence towards extreme late-types. They are only slowly evolving, and still in an early evolutionary state. The Tully-Fisher relation and rotation curves of LSB galaxies both show that LSB galaxies are very dark-matter dominated with respect to “normal” high surface brightness (HSB) galaxies. Mass models derived from the rotation curves of LSB and HSB galaxies show that LSB galaxies inhabit less dense and more extended halos. Mass density, which changes with surface brightness, is as important in determining the evolution of a galaxy as total mass is.
Kapteyn Astronomical Institute, P.O. Box 800, NL-9700 AV, Groningen, The Netherlands
Department of Terrestrial Magnetism, Carnegie Institute of Washington, 5241 Broad Branch Road NW, Washington DC 20015, USA
1. Introduction
Increasingly sensitive surveys of our local universe have in recent years revealed the existence of a population of dim field galaxies (e.g. Schombert et al. 1992). These galaxies are primarily late-type disc galaxies with central surface brightnesses mag arcsec-2 and scale lengths of a few kpc. The existence of such a population is not consistent with the surface brightness distribution for disc galaxies as derived by Freeman (1970), which gives a narrow range of -mag arcsec-2. A better understanding of selection effects (Disney 1976, McGaugh 1996) and deeper surveys have shown that for every magnitude one goes fainter in surface brightness approximately equal numbers of galaxies are found (McGaugh 1996).
Our knowledge and views of the local galaxy population have therefore been biased towards the bright HSB galaxies. As LSB galaxies are numerically important and can contain an appreciable fraction of the total mass in galaxies (McGaugh 1996), studying them is of great importance for improving our understanding of the local galaxy population.
In the above I have implicitly distinguished between HSB and LSB galaxies as if they were two separate kinds of galaxies. But LSB galaxies are in many ways a continuation of the classical Hubble sequence towards extreme late-types, and any distinction on the basis of surface brightness is artificial. Recent investigations using well-defined samples (de Jong 1995) show that disc (spiral) galaxies exhibit a continuous range in central surface brightness, from the Freeman value, which really seems to be an upper limit to the surface brightness a galaxy can attain, to the faintest values currently detectable (and we do not seem to have reached the faint limit yet).
For the sake of convenience I will retain the HSB/LSB distinction, with where I will call “HSB” those galaxies with mag arcsec-2, and “LSB” those galaxies with fainter than this value. When comparing HSB and LSB galaxies it will be implicitly assumed that galaxies of similar luminosity/rotation velocity are compared.
2. General properties
One (by now superseded) way to explain the low surface brightnesses of LSB galaxies was the so-called “faded-disc scenario”. In this picture LSB galaxies are simply ordinary HSB galaxies that for some reason (e.g. gas depletion) stopped forming stars a few Gyr ago, and are now simply fading away. LSB galaxies would thus have to be much redder than “normal” galaxies, and presumably more gas-poor.
Measurements of the colours of LSB galaxies immediately showed that this scenario could not be the correct explanation. McGaugh (1992), van der Hulst et al. (1993), McGaugh & Bothun (1994), de Blok et al. (1995) all showed that colours of LSB galaxies are among the bluest known for non-interacting disc galaxies.
Two possible causes for these blue colours are low metallicity and recent star formation. Both are found in LSB galaxies. H imaging (McGaugh 1992) shows that a few regions of star formation are usually present in LSB galaxies. The low surface brightness of the underlying disc ensures that only a small amount of star formation is needed to significantly influence the colours (de Blok et al. 1995). Measurements of the oxygen abundances in Hii regions in LSB galaxies (McGaugh 1994) show that the metallicity is on average 0.2-0.5 solar.
LSB galaxies in addition contain significant amounts of Hi () (van der Hulst et al. 1987; Schombert et al. 1992; McGaugh 1992). The low metallicity, normal Hi masses and the small amounts of star formation all suggest slow evolution. This is supported by measurements of the Hi surface densities. Van der Hulst et al. (1993) showed that the Hi surface densities are significantly lower than in late type HSB galaxies. This was interpreted using the critical star formation treshold (Kennicutt 1989) as a possible cause for the low star formation rate in LSB galaxies. Follow-up observations of a larger sample of more extreme LSB galaxies (de Blok et al. 1996) confirmed the low Hi surface densities, but also showed that the extended Hi discs still contain enough gas to make LSB galaxies rank among the most Hi-rich disc galaxies.
The unevolved nature of LSB galaxies is also supported by modelling of their spectro-photometric evolution (van den Hoek et al. 1996). The current star formation rates are found to be only , which is an order of magnitude lower than in HSB Sc galaxies, where values of are usually found (Kennicutt 1983). The gas depletion time scales in LSB galaxies are thus much longer. A typical HSB galaxy will exhaust its gas reservoir in a few Gyr, while in a LSB galaxy timescales of tens of Gyr are inferred.
As the evolution time scales are thus much longer, and if the evolution processes are similar, this essentially implies that LSB galaxies are just HSB galaxies in the making, but at a very slow rate. Or, in other words, LSB galaxies give us the chance to study the conditions as they probably were in late-type HSB galaxies of comparable mass many Gyr ago.
3. LSB galaxies: Nature or Nurture?
But what makes LSB galaxies LSB? It cannot be a lack of “evolutionary fuel”: they still posses large amounts of hydrogen.
Can it be environment? Bothun et al. (1993) and Mo et al. (1995) found that, although LSB galaxies do follow the general large scale structure delineated by HSB galaxies, they tend to be more isolated at scales 2 Mpc. LSB galaxies thus avoid other galaxies and furthermore show no evidence of having companions (Bothun et al. 1993). A lack of interactions might thus have produced this quiescent evolution. The relatively high star formation rates, grand design spirals and other features that make HSB galaxies so conspicuous would thus have to be enhanced partly by interactions and tidal effects. This would also explain why LSB disc galaxies are preferably found in the field or in the outskirts of clusters: if they fall deeper into the cluster potential, interactions with the cluster galaxies or intra-cluster medium will will either enhance their star formation rates, raising their surface brightnesses or strip them of their large, low density gas discs, thus eventually reddening their colours. In both cases we would no longer identify them as proto-typical LSB galaxies.
Or could it be that the dark halos regulate the evolution of their inhabitants? Persic & Salluci (1991) pointed out that the importance of dark matter (DM) with respect to the luminous matter increases towards late Hubble types. As LSB galaxies do extend the Hubble sequence towards later types, one would expect the DM to be very important. Could the dominant DM thus stabilize the baryonic disc against the instabilities that would normally lead to star formation?
If both scenarios are tthe darkest galaxies are always the most isolated from their neighbours? It would imply that the eventual LSB or HSB fate is already determined at the time of galaxy formation.
A first clue about the importance of DM can be derived from the Tully-Fisher (TF) relation. Zwaan et al. (1995) and Sprayberry et al. (1995) have shown that LSB galaxies do follow the exactly the same TF relation as HSB galaxies. This is not something one would expect a priori. The TF relation can be written as , where is measured within a fixed number of scale lengths, and is the central surface brightness expressed in linear units.


If all galaxies had similar total ratios, one would expect parallel TF relations for each surface brightness, as is shown in Fig 1. As this is evidently not the case, there must exist a tight coupling between the surface brightness of a galaxy and its ratio, which implies that LSB galaxies must have higher values than HSB galaxies. This also means that they are more DM dominated (see below).
The relation between and is actually observed (Fig. 2). Also shown is the relation between and . Apart from the fact that it clearly shows that there is indeed a systematic trend with surface brightness, the identical slopes of both trends also suggest a link between evolution rate and DM dominance.
4. Mass models of LSB galaxies
To investigate the systematics between the DM fraction and surface brightness de Blok et al. (1996) obtained rotation curves of a sample of 19 LSB galaxies, and compared these to a large sample of curves of HSB galaxies (de Blok & McGaugh 1996a, 1996b, Broeils 1992). In Fig. 2 an example of the LSB galaxy data is shown.
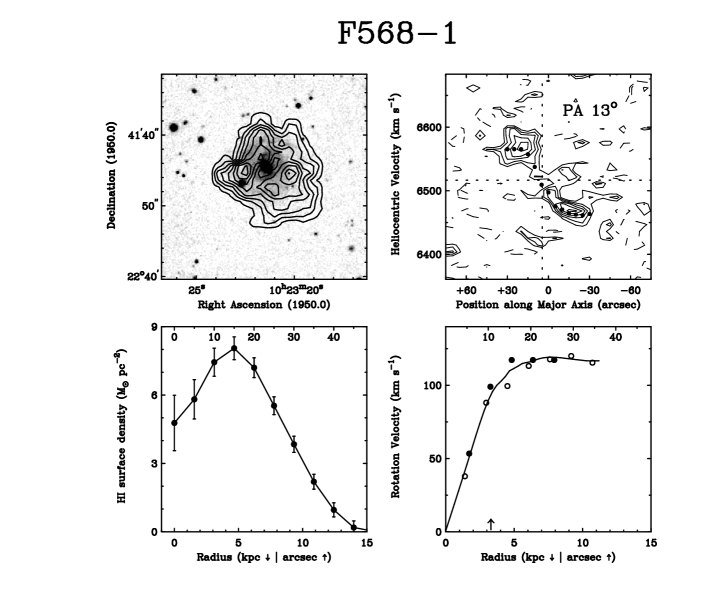
The rotation curves of LSB galaxies are only slowly rising, and usually continue to do so until the outermost measured points. A few curves do show signs of flattening off at the outermost radii. Maximum velocities are typically between 50 and 120 km s-1. The LSB galaxies differ from the HSB galaxies in that at fixed they have larger scale lengths and their rotation curves always rise more slowly. At fixed (fixed ) the shape of the rotation curves thus changes with surface brightness, or, alternatively, at fixed maximum rotation velocity decreases with surface brightness.
| Name | UGC 128 | NGC 2403 |
|---|---|---|
| (mag) | –18.9 | –19.2 |
| (km s-1) | 131 | 136 |
| (mag arcsec-2) | 24.2 | 21.4 |
| (kpc) | 6.8 | 2.1 |
| ( M⊙) | ||
| ( M⊙) | ||
| ( M⊙) | ||
| 30.6 | 7.4 | |
| 2.3 | 25 |
A good way to quantify the differences between LSB and HSB galaxies is to compare the properties of two galaxies at identical positions on the TF, in order to cancel out their global differences. Two such galaxies are NGC 2403 and UGC 128. Both have and km s-1 (see Table 1). De Blok & McGaugh (1996a) have made mass models of the stellar, gas and dark components of both galaxies, assuming for the stellar disc a maximum disc model and an isothermal halo. In Table 1 the relevant masses and mass-to-light ratios within 6.2 are listed. It is clear that the ratios in the LSB galaxy are much larger, and that DM is much more dominant. This conclusion remains true even if we measure the properties at a fixed number of kpc. Note that non-maximum disc models will only enhance the differences. UGC 128 is also more gas-rich than NGC 2403. Furthermore, the average density of matter within 6.2 is a factor of 10 less in UGC 128 than in NGC 2403. LSB galaxies thus seem to be low density objects.

This dramatic increase in the importance of DM towards lower surface brightnesses is also found other LSB galaxies (de Blok & McGaugh 1996b).
We have seen that LSB galaxies usually have larger optical scale lengths and more extended gas discs. Does this also mean that their halos are extended and low density? An extensive discussion is given in de Blok & McGaugh (1996b), of which we will summarize the main points here. The answer depends crucially on the assumed of the stellar disc. In making mass models of galaxies the maximum disc hypothesis (van Albada & Sancisi 1986) is usually assumed: the rotation curve of the stellar disc is scaled in order to attribute as much rotation velocity to it as possible within the constraints of the observed rotation curve.
Applying this hypothesis to rotation curves of LSB galaxies yields contradictory conclusions. At a fixed LSB galaxies are then always found to have the highest values of . This implies that LSB galaxies have very evolved discs, which is a possibility we can exclude in the face of all other evidence (colours, metallicities etc.; see Section 2). Secondly, as the rotation curve of UGC 128 in Fig. 3 shows, applying the maximum disc recipe has a different result in LSB galaxies than in HSB galaxies: in LSB galaxies it is not possible to explain all of the rotation velocity in the inner part by just scaling the stellar disc, in contrast to HSB galaxies. Thirdly, it can be shown that the large values derived for LSB galaxies are a mathematical effect of the extendedness of their discs. They do not need to have consequences for conclusions on their evolutionary state. Maximum disc is therefore not the preferred way of making mass models of LSB galaxies. Instead ratios derived from stellar velocity dispersions and colours [the “Bottema” disc, see Bottema (1995, 1996) and de Blok & McGaugh (1996b)] are used. This appears nearly equivalent to a constant assumption. For HSB galaxies a typical value of is found, while for LSB galaxies . Mass models of a sample of HSB and LSB galaxies derived assuming the Bottema disc show that LSB galaxies tend to have lower values of the central halo density and higher values of the core radius than HSB galaxies (Fig. 4). This conclusion does of course depend on the validity of the Bottema disk. However, Bottema (1995) has convincingly shown that the Bottema disk is a good working hypothesis in HSB galaxies, while in LSB galaxies the DM dominance makes the halo parameters relatively insensitive to assumptions.

5. Conclusions
LSB galaxies are extended, low density galaxies, that are still in an early stage of galaxy evolution. They inhabit less dense and more extended halos than HSB galaxies. Colours are blue, metallicities are low, they have high values of and only small amounts of star formation. Evolutionary time scales are in general much longer than in HSB galaxies. The fact that LSB galaxies do have luminosities and masses comparable to those of HSB galaxies, evolve much slower, and are found in low density regions of the general galaxy distribution, does show that galaxy evolution does not just depend on mass (observed as luminosity), but just as much on density (observed as surface brightness) and the environment where a galaxy is formed.
References
Bothun, G.D., Schombert, J.M., Impey, C.D., Sprayberry, D., McGaugh, S.S. 1993, AJ, 106, 530
Bottema, R. 1995, PhD thesis, University of Groningen
Bottema, R. 1996, in preparation
Broeils, A.H. 1992, PhD thesis, University of Groningen
de Blok, W.J.G., van der Hulst, J.M., Bothun, G.D. 1995, MNRAS, 274, 235
de Blok, W.J.G., McGaugh, S.S. 1996a, ApJL, 469, L89
de Blok, W.J.G., McGaugh, S.S. 1996b, MNRAS, submitted
de Jong, R.S. 1995, PhD thesis, University of Groningen
Disney, M.J. 1976, Nature, 263, 573
Freeman, K.C. 1970, ApJ, 160, 811
Kennicutt, R.C., Jr. 1983, ApJ, 272, 54
Kennicutt, R.C., Jr. 1989, ApJ, 344, 685
McGaugh, S.S. 1992, PhD thesis, University of Michigan
McGaugh, S.S. 1994, ApJ, 426, 135
McGaugh, S.S., Bothun, G.D. 1994, AJ, 107, 530
McGaugh, S.S. 1996, MNRAS, 280, 337
Mo, H.J., McGaugh, S.S., Bothun, G.D. 1994, MNRAS, 267, 129
Persic, M., Salucci, P. 1991, ApJ, 368, 60
Schombert, J.M., Bothun, G.D., Schneider, S.E., McGaugh, S.S 1992, AJ, 103, 1107
Sprayberry, D., Bernstein, G.M., Impey, C.D., Bothun, G.D. 1995, ApJ, 438, 72
Tully R.B., Fouqué, P. 1985, ApJS, 58, 67
van Albada, T.S, Sancisi, R. 1986, Phil. Trans. R. Soc. Lond. A, 320, 447
van den Hoek, L.B., de Blok, W.J.G., van der Hulst, J.M., de Jong, T. 1996, submitted
van der Hulst, J.M., Skillman, E.D., Kennicutt, R.C., Bothun, G.D. 1987, A&A, 177, 63
van der Hulst, J.M., Skillman, E.D., Smith, T.R., Bothun, G.D., McGaugh, S.S., de Blok, W.J.G. 1993, AJ, 106, 548
Zwaan, M.A., van der Hulst, J.M., de Blok, W.J.G., McGaugh S.S. 1995, MNRAS, 273, L35