11.03.1, 11.03.4,12.04.1, 13.25.2
V. Pislar, pislar@iap.fr 11institutetext: Institut d’Astrophysique de Paris, CNRS, Université Pierre et Marie Curie, 98bis Bd Arago, F-75014 Paris, France 22institutetext: DAEC, Observatoire de Paris, Université Paris VII, CNRS (UA 173), F-92195 Meudon Cedex, France 33institutetext: Observatoire de Lyon, Place Charles André, F-69561 St Genis Laval Cedex, France 44institutetext: Universität Potsdam, c/o Astrophysikalisches Institut Potsdam, An der Sternwarte, 16, D-14882 Potsdam, Germany 55institutetext: Observatoire de la Côte d’Azur, B.P. 229, F-06304 Nice Cedex 4, France
The rich cluster of galaxies ABCG 85. I. X-ray analysis. ††thanks: Based on ROSAT Archive data.
Abstract
We present an X-ray analysis of the rich cluster ABCG 85 based on ROSAT PSPC data. By applying an improved wavelet analysis, we show that our view of this cluster is notably changed from what was previously believed (a main region and a south blob). The main emission comes from the central part of the main body of the cluster on which is superimposed that of a foreground group of galaxies. The foreground group and the main cluster are separated (if redshifts are cosmological) by 46 h Mpc. The southern blob is clearly not a group: it is resolved into X-ray emitting galaxies (in particular the second more luminous galaxy of the main cluster). Several X-ray features are identified with bright galaxies. We performed a spectral analysis and derived the temperature (T), metallicity (Z) and hydrogen column density (NH). The global quantities are: T=4 keV (in agreement with the velocity dispersion of 760 km/s) and Z=0.2Z⊙. We cannot derive accurate gradients for these quantities with our data, but there is strong evidence that the temperature is lower ( keV) and the metallicity much higher (Z Z⊙) in the very centre (within about 50 h kpc). We present a pixel by pixel method to model the physical properties of the X-ray gas and derive its density distribution. We apply classical methods to estimate the dynamical, gas and stellar masses, as well as the cooling time and cooling flow characteristics. At the limiting radius of the image (1.4 h Mpc), we find M h M⊙, Mgas/M. The stellar mass is M⊙, giving a mass to light ratio of M/L. The cooling time is estimated for different models, leading to a cooling radius of 30-80 kpc depending on the adopted cluster age; the mass deposit rate is 20-70 M⊙/yr, lower than previous determinations. These results are discussed (cooling flow paradigm in relation with high Z, ‘baryonic crisis’ etc.) in connection with current ideas on dynamical and evolutionary properties of clusters.
keywords:
Galaxies: clusters: general; Clusters: individual: ABCG 85; Dark matter; X-rays: galaxies1 Introduction
The study of clusters and groups of galaxies, which contain a noticeable fraction of the galaxies in the Universe, is particularly important since they are astrophysical objects with the following properties:
-
•
Characteristical times of processes at work are in general long, with the result that clusters are witnesses of the current formation of structures in the Universe; their analysis may therefore provide constraints on cosmological models.
-
•
They contain the main components of the Universe: baryonic matter (under stellar form and X-ray emitting plasma) and unseen matter, reaching a very high density.
This explains why processes in which these components interact, observed under the generic term of environment phenomena, are numerous: morphological segregation of galaxies, hydrogen deficiencies, steep slope of the luminosity function, etc.
Ideally, a thorough study of a cluster should be done by using simultaneously all types of data. We have therefore undertaken a complete analysis of several clusters, both in X-rays and through optical imaging and spectroscopy. The X-ray emitting gas is a good tracer of the structure and morphology of clusters, in particular of their gravitational potential, and as such has been extensively studied, using data from satellites with increasing sensitivities, as well as better spatial and energy resolutions. However, processing methods are so different in the X-rays and optical that we will present our analysis of the cluster ABCG 85 in two papers, the present one based on X-ray data, and the second one on optical data.
ABCG 85 is a rich cluster of richness class 1 (Abell 1958), classified as Bautz-Morgan type I (Leir & van den Bergh 1977) and of RS cD type (Struble & Rood 1987). Its optical redshift is 0.0555, dominated by a cD (Colless, private communication). A spectrum of this galaxy kindly provided by Colless prior to publication does not show characteristics of an active galactic nucleus, in disagreement with Edge et al. (1992). Previous studies have claimed the existence in the cluster of a double structure in X-rays, including a main structure and a south blob (Forman & Jones 1982, Gerbal et al. 1992, hereafter GDLL), and of a central cooling flow (Stewart et al. 1984, Prestwich et al. 1995). From Einstein data, GDLL have derived the main physical parameters of the X-ray emitting gas, and have found in particular a very small value for the core radius of the X-ray gas ( kpc); they have shown the temperature to be roughly constant throughout the cluster, and the dark matter to be more concentrated towards the center of the cluster than the X-ray gas.
The high spatial resolution observation of ABCG 85 with the ROSAT HRI by Prestwich et al. (1995) has shown the possible existence of small bright emitting features (of sizes 5-10”, or kpc) which cannot be identified with single galaxies and are not likely to be foreground or background sources. They argue that these blobs could be either cooler and denser than the surrounding X-ray gas, or hotter and denser gas compressed by magnetic fields.
The energy range of ROSAT (E2.5 keV) is not best suited for the observation of rich clusters, since in these objects the X-ray gas has a temperature larger than 2.5 keV, and therefore spectra corresponding to different gas temperatures look very similar in the ROSAT energy range. However, this satellite has allowed to map clusters with unprecedented spatial resolution, and even to derive information on possible spatial variations of the temperature (Briel & Henry 1994, Henry & Briel 1995), therefore showing that it can give useful information on clusters in spite of its energy range. ¿From ROSAT PSPC data, Kneer et al. (1996) have recently suggested that ABCG 85 is not a fully relaxed system; they also claimed that the temperature of the X-ray gas is smaller in the center and in the south subclump than in the overall cluster. They identified this south blob with a loose group of galaxies that could be falling towards the center of the cluster. We will discuss this possibility in section 3.
We present here the results of our X-ray analysis of ABCG 85 based on ROSAT PSPC data. Spatial information is derived using a multiscale (wavelet) analysis, in order to extract substructure at different spatial scales; this analysis has been improved since that presented in Slezak et al. (1994). We present a pixel by pixel modelling of the X-ray gas and derive its physical properties (temperature, density, mass), adapted from a previous method used to analyze Einstein data. Using the hydrostatic equilibrium hypothesis, we derive the cluster binding mass, the cooling time and cooling flow parameters, as well as the predicted temperature decrease of the microwave background by the Sunyaev-Zel’dovich effect. The optical imaging and spectroscopic catalogues, as well as their physical interpretation will be presented in forthcoming papers by Durret et al. and Slezak et al.
We will show that the wavelet analysis of the X-ray image, combined with a detailed physical analysis can strongly change our general vision of ABCG 85. In section 2, we present the data and describe the bases and behaviours of the three main techniques of analysis used here: wavelet analysis, spectral analysis and modelling of the X-ray gas. Each of these methods have led to various results described in the three following sections. A critical review and discussion of these results is presented in section 6, leading us to draw a synthetic picture of ABCG 85, and to derive consequences on the formation and evolution of this cluster.
2 The data and methods of analysis
2.1 The data
The ABCG 85 field was observed by the ROSAT PSPC at three separate times, Dec. 20, 1991, Jun. 11, 1992 (Sequence number wg800174P, PI R. Schwarz, hereafter the German image) and Jul. 1-2, 1992 (us800250P, PI C. Jones, hereafter the US image). The center of the pointed observations is 00h 41mn 50.4s, 17’24” for the first two images and 0h 41mn 50.4s, 17’00” for the third (equinox J2000.0). The exposure times are 15949, 5709 and 10240 seconds respectively. In all of these observations, the PSPC-B was used and the gain was at low state. Pixels were rebinned to a size of 15”, corresponding to kpc at the cluster distance (taking H0=50 km s-1 Mpc-1). We have defined the image limiting radius RL (15’) as the radius where the number of photons reaches the image background (i.e. about 1 photon/pixel). The surface brightness analysis was performed in the energy range 0.5-2.0 keV. All the analyses were performed on the sum of the two images to minimize the uncertainties on the parameters, except for the wavelet analysis.
2.2 Wavelet analysis
The raw X-ray images of the ABCG 85 cluster of galaxies have been processed using a multiscale vision model in order to remove the high frequency noise while keeping the small scale details linked to genuine objects. The technique relies on an iterative object-by-object restoration procedure based on the hierarchical connection trees which define the objects in a thresholded wavelet space. The basics of the algorithms involved are described in Slezak et al. (1994) and Biviano et al. (1996), while a full description can be found in Rué & Bijaoui (1996). Among the key points are the use of the wavelet transform to locate structures at various scales from a field labelling and the selection of objects by looking at the maximum wavelet coefficient values inside connected regions belonging to the same interscale connectivity graph. Superimposed objects are then detected (at a 3 level) according to their typical scale, and accurately restored from the information at both this scale and the next smaller one, providing that their wavelet amplitudes are locally high enough to generate distinct peaks in a maximum wavelet value vs. scale plot. The analysis results in a set of individual objects with different typical sizes, which are placed at their respective positions as they are restored, thereby generating the processed image. Taking benefit of this additive process, a given set of objects is easily removed from the solution, either by not taking them into account initially, or by subtracting them after the generation of the processed image. Note that only resolved objects which are properly restored can be subtracted without inducing artifacts such as the “hole” described in section 3, or even negative values.
The linearity of the wavelet transform may however lead to misdetections for some peculiar object configurations. A bright enough feature can indeed generate at all scales wavelet coefficients much higher than those computed for an underlying larger and fainter structure. Although this large component has to be considered as a distinct object, it will remain undetected when the scheme summarized above is applied. The X-ray image of A85 exhibits such a case since a very bright and unresolved peak is superimposed onto a diffuse component linked to the overall cluster. In order to detect and restore such extended background features, we decided to overcome this limitation by applying our model twice. At the end of the first step the restored objects are subtracted from the raw image and the resulting frame is searched for the objects which were missed because of the intensity of the now removed bright ones. If an object is detected, it is restored and added to the previous set of objects, thereby building the final image. Note that the spectral information has been lost in this final image.
2.3 Spectral analysis
The EXSAS package (Zimmerman et al. 1994) allows us to determine spectral properties of the X-ray emitting gas, for the cluster as a whole or for various parts of the cluster, with the requirement of having enough counts to perform an analysis. The use of the package is well described in the EXSAS manual, thus we will only discuss some behaviours of interest for our purpose. The model we use to fit the X-ray spectra is a Raymond-Smith plasma model (Raymond & Smith 1977) which assumes bremsstrahlung emission and neutral hydrogen absorption, and is characterized by five parameters: the temperature, metal abundance, column density of neutral hydrogen along the line of sight , redshift, and a normalization factor. We have fixed the redshift to that determined optically (z=0.0555), leaving four free parameters. The background was taken in a circle of radius 6’ and with its center at 31’ from the center of the cluster, where there is no visible point source. The fit was done by a standard minimization. We have corrected the images for vignetting and dead time, and rebinned the spectrum to obtain a signal to noise ratio of 5.
We have searched for correlations between parameters in the fitting process, using the whole cluster image (excluding the substructure south of the main body, see section 3). We find:

- i)
-
A negative correlation between T and . We have fixed the metallicity to Z=0.2 (in solar units, as assumed hereafter) and let T and vary as free parameters. In Fig. 1 we show a contour plot of confidence levels 1, 2, and 3 of the distribution around the central value Ncm-2, T=4.5 keV.
- ii)
-
No correlation between T and metallicity, when we fix N cm-2, corresponding to the Galactic value (hereafter the “canonical value”) deduced from HI data (Dickey & Lockman 1990), and let T and Z vary as free parameters.
2.4 Modelling of the X-ray gas
We have used the routines developed by Snowden et al. (1994) to determine the real exposure time, to subtract the various spurious background components, to correct for exposure, vignetting and variations of detector quantum efficiency and to merge the images. A detailed discussion of the different PSPC background components can be found in Snowden et al. (1994). We obtain background subtracted images in four semi-independent energy bands for the image analysis between 0.5 and 2.0 keV, chosen to have simultaneously a sufficient energy resolution and signal to noise ratio in each energy band, and to avoid strong variations of the PSF with energy. The background we found is roughly cts/sec/pix. We develop and improve a previous model which was used to fit X-ray images taken with the Einstein satellite (GDLL).
We construct a “synthetic” image by assuming the X-ray emission due to thermal Bremsstrahlung, using for the Gaunt factor the analytical approximation of Mewe et al. (1986). We assume that the cluster has elliptical symmetry, and we take an axial ratio and the position angle of the major axis as free parameters; the “radius” we define is:
| (1) |
assuming that the x and y axes are perpendicular to the line of sight, where is linked to the ellipticity by ).
For the electron density, we take a modified Hubble law (-model),
| (2) |
including a so-called “analytical” King profile obtained for , and a modified Mellier-Mathez (Mellier & Mathez, 1987, hereafter MM) law
| (3) |
The free parameters are and for the geometry, , , and a for these two laws respectively. The projection of the MM law leads to the Sersic law for the projected surface density :
| (4) |
when and are related by: (Gerbal et al., submitted).
We multiply the volume-emissivity by the Galactic absorption factor (Morrison & McCammon 1983), and then convolve the model with a Gaussian with FWHM equal to the energy uncertainty derived from the formula giving the spectral resolution: (see e.g. Zimmerman et al. 1994).
We then express the number of photons of energy E arriving on each pixel by integrating the number of counts along the line of sight, and sum over photon energies to obtain the 4 energy bands mentioned above. In order to take into account the spatial resolution of the PSPC, we convolve our model with a two-dimensional Gaussian of FWHM = 25”. This approximation is valid only near the center of the detector, where the effect of the PSF on the true luminosity profile is more important. We could have taken the spatially dependent 1 keV on-axis PSPC point spread function (David et al., 1993), but because of the “wobbling” of ROSAT this method isn’t more accurate.
To compare with images created with Snowden’s routines, we create images of 512 512 pixels (pixel size 14”.947 14”.947) and 256 256 pixels (pixel size 29”.894 29”.894) to increase the signal to noise ratio and to check that our fit is pixel size independent.
The best set of parameters is obtained by comparing the synthetic image to the observed one, pixel by pixel, using a maximum likelihood function to estimate this difference. We assume that the number of counts in any pixel has a poissonian distribution. The maximization of this function was performed with the MINUIT software from the CERN library.


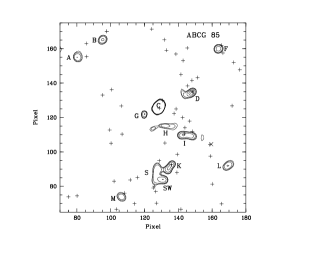
3 Wavelet analysis results
We now present the results of the wavelet analysis of both the German and US images, performed following the principles described in section 2.2. The reconstructed images where noise is suppressed are displayed in Fig. 2. Emission features with different spatial scales can now be disentangled by means of a classical wavelet analysis unfolding the data along a scale axis. The German wavelet image at a scale of 2 pixels (plane 2), i.e. 30”, is shown in Fig. 3, emphasizing details of the image at the scale of the PSF. The US wavelet image is very similar and will therefore not be presented here.
Understanding the physical processes and dynamical situation in ABCG 85 requires a thorough analysis of these images.
The two reconstructed images present the same general aspect, a main structure and a substructure south of the main body (noted S), but some features differ from one image to another:
-
•
A feature (noted J) on the US image is not present on the German image; another feature (noted B) is seen on the German image but not on the American one. It seems therefore likely that these two substructures are artefacts in the raw data.
-
•
Substructure S is clearly of complex aspect and details somewhat differ between the US and German images. A structure (noted K) located in the north-west part of blob S appears elongated on the German image, while it has a globular aspect on the US image.
The central peak (noted C), visible in planes 1 and 2, and in the reconstructed images is in fact unresolved, as noted in section 2.2. The central pixel contains of the total number of counts within RL, while its surface is of the total surface within RL.
In a previous paper devoted to the Coma cluster of galaxies (Biviano et al. 1996), we have shown that wavelet images on the scales of 1 or 2 pixels allowed to find X-ray emitting galaxies after superposition of optical galaxy positions. We have therefore superimposed on these images the positions of galaxies belonging to ABCG 85 (i.e. with heliocentric velocities in the interval 13300-20000 km/s). We observe that the positions of several galaxies coincide exactly with significant features found at small scales in X-rays. Other galaxies are close to X-ray substructures, but cannot be identified with certainty. We give the list of the identified galaxies and their characteristics in Table 1; the columns are the following: Col. 1: name, Col. 2: ROSAT coordinates, Col. 3 and 4: and coordinates (equinox 2000.0), Col.5 : velocity (cz) in km/s, Col. 6: R magnitude, Col. 7: quality of the galaxy identification, coded as: s=superposition of the galaxy position and X-ray substructure (within one ROSAT PSPC pixel, or 15”), c=close positions only (distance smaller than 3 ROSAT PSPC pixels).
In a companion paper devoted to the analysis of photometric and spectroscopic data for this cluster, we have applied the Serna-Gerbal method (Serna & Gerbal 1996) which allows to separate dynamically structures and substructures in a field. We have been able to show that in the field of ABCG 85 and in the velocity interval 13300-20000 km/s, two structures can be found, among which a “Foreground” structure poor in galaxies superimposed on the plane of the sky on a structure rich in galaxies: the ‘Main Structure’; we also detect a background structure which will not be discussed here.
| Name | ROSAT | v | R | Quality | ||
| coordinates | (J2000.0) | (J2000.0) | ||||
| (pixels) | ||||||
| C (cD) | 128.8 125.4 | 0 41 50.07 | -9 18 10.41 | 16734 | 12.9 | s |
| D (A85-F) | 148.2 134.9 | 0 41 30.39 | -9 15 48.15 | 13429 | 13.9 | s |
| K | 135.8 92.6 | 0 41 43.05 | -9 26 22.32 | 16886 | 14.1 | s |
| H | 133.8 116.9 | 0 41 45.07 | -9 20 18.34 | 13831 | 17.0 | c |
| I | 143.8 111.5 | 0 41 35.07 | -9 21 52.21 | 14234 | 15.4 | c |
| SW | 129.5 84.9 | 0 41 49.42 | -9 28 18.20 | 21647 | 17.8 | c |
The ‘Main Structure’ has an average velocity of 16400 km/s and a dispersion of 760 km/s (Durret et al. 1996). In its geometrical and dynamical center it has a subset – the ‘Central Substructure’– of 8 bright galaxies (with R) that is dominated by the most luminous galaxy of the cluster (R= 12.9) and by the second most luminous galaxy of this subgroup (noted BCM2) which has a magnitude R=14.1. These two galaxies form a pair, while the other galaxies of this subset can be considered as their satellites. ¿From a visual inspection of its profile, the central galaxy appears to be a cD, since it appears to have a point of inflexion in its surface brightness at , which looks like the onset of the cD halo (Colless, private communication).
We notice that the X-ray image is far smaller than the galaxy map: in fact the ‘Central Substructure’ covers all the X-ray map. The cD is situated just on the peak of X-ray emission, while the galaxy BCM2 is located within 1 pixel of one of the structures (K) in the north-west part of the S extension. Moreover a visual inspection indicates that the extension and orientation of BCM2 correpond to the orientation of the feature K as observed on Fig. 3
The ‘Foreground Structure’ has a mean velocity of 14100 km/s and a velocity dispersion of 400 km/s. It is located near the central part of the X-ray image. Assuming that the redshift of the Main and Foreground structures are due to the Hubble flow only, the distance between these two clusters would be 46 h Mpc. It then appears difficult to consider the couple ‘Main Structure’–‘Foreground Structure’ as the elements of a double cluster.
The ‘Foreground Structure’ contains X-ray emitters accounting for two remarkable features: the most luminous galaxy of this group coincides with feature D and is a Seyfert galaxy (A85-F in the CfA catalogue); the second luminous galaxy coincides with feature I. Both features are seen on all wavelet planes and on the reconstructed image, and are responsible for the two west extensions that break the south-north symmetry of the main body of the X-ray image.

We display in Fig. 4 the reconstructed US image from which point-like scale 1 and 2 objects have been suppressed. This was done following the procedure described at the end of section 2.2; this image, which only contains large scale features, will hereafter be refered to as the “Large scale image”. This ‘Large scale image’, showing the extended X-ray component (Fig. 4), is much smoother and more regular than the reconstructed image. Its examination leads to the following conclusions:
-
•
The central peak, which now appears as a hole (see section 2.2) is not at the center of the extended image, but is displaced to the north-west and coincides with the position of the cD. This is not surprising, since cD galaxies are not necessarily in the very centre of clusters. It is possible but not proved that the central galaxy has an X-ray emitting nucleus which is responsible for this peaked feature.
-
•
The south extension S has disappeared, indicating that it is constituted by the superposition of small emission regions (such as K), and not by a diffuse extended source such as hot X-ray emitting gas in a group of galaxies.
-
•
The D feature has vanished, showing the lack of an extended feature, as expected from the Seyfert nature of this galaxy.
-
•
Contrary to the previous case the I feature has not disappeared, suggesting the presence of a diffuse component instead of a single X-ray emitting galaxy.
-
•
An extension is clearly visible towards the north-west.
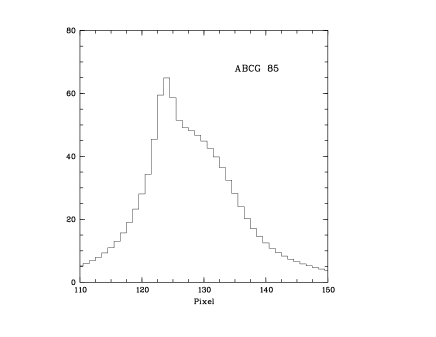
A cut through the center of the ‘Large scale image’ in the east-west direction (across pixel y=128) is shown in Fig. 5. It shows a strong asymmetry, with a large excess of emission towards the west. This led us to construct a “difference image”, using the following procedure: we cut the ‘Large scale image’ in the north-south direction; we kept the east half and added to it an image which was symmetrical to the east image, therefore obtaining an image with two perfectly symmetrical halves; we subtracted this symmetrical image to the ‘Large scale image’, thus obtaining the “difference image” displayed in Fig. 6. The location of this difference image corresponds approximatively to that of the ‘Foreground Structure’.
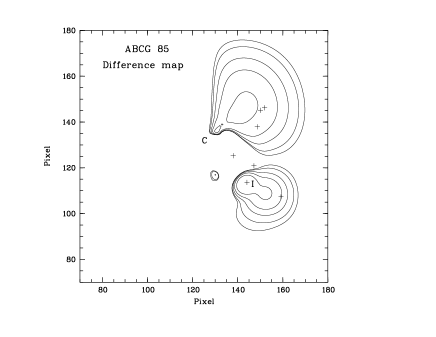
In conclusion, the total image clearly corresponds to the superposition of the X–ray emission by a group (‘Foreground Structure’) superimposed on that of the central regions of a cluster (‘Main Structure’) along the same line of sight, but separated by 46 h Mpc.
4 Spectral analysis results
Following the method described in section 2.3, we have studied the temperature and its profile by taking into account the column density of hydrogen and the metallicity.
4.1 Global values
By using the Raymond & Smith model applied globally to all the cluster, leaving free the column density as well as the temperature and metallicity, we find a temperature of T= 4.5 keV, a column density N cm-2 and a metallicity Z=0.22Z⊙. The temperature becomes T= 4.60.7 keV, with a column density N cm-2, when the metallicity is fixed to Z=0.3Z⊙ (see Fig. 7). If we fix the hydrogen column density to the Galactic value of N cm-2, we find a temperature of keV. However, we can notice that in the first two cases the column density of hydrogen is weaker than the canonical value; although this is the best mathematical solution, it appears physically doubtful, though not totally excluded by the 1∘ mesh of the neutral hydrogen mapping. In any case, all these results are consistent with a temperature T keV.
A strong correlation between the temperature of the X-ray gas and the dispersion of galaxy velocities, expected since these two components lie in the same gravitational potential, has been noted for a long time (Mitchell et al. 1977). However, the actual value of the linear regression is still controversial (see for example the discussion by Edge & Stewart 1991, based on EXOSAT data). A small value of the velocity dispersion is expected from the temperature that we obtain. The analysis we have performed on our catalogue of velocities indeed leads to a main cluster with a velocity dispersion of 760 km/s. Note that the temperature that we find is notably lower than that given by David et al. (1993) in their catalogue (6.2 keV), but derived using the MPC detector of Einstein, and also lower than that obtained by GDLL in their analysis of Einstein archive data ( keV). To our knowledge, no temperature has been derived for this cluster from ASCA data.
To a temperature of 4 keV and a Galactic column density corresponds an X-ray luminosity within RL in the [0.1-2.4 keV] band of erg s-1 for the main cluster (blob S being excluded). We would have liked to estimate the X-ray luminosity of the “difference” image, but this is not possible because we do not have enough photons to determine the temperature. We only measured the total number of counts, which is 71000 for the total image, 64600 for the double of the east image and 6400 for the difference image (background excluded). Notice that the contribution of the difference image to the total X-ray counts is only , while the luminosity of the difference image in the R band is of that of the cluster (see section 5.2). This is consistent with a lower temperature for the foreground group and with the velocity dispersion of km s-1 found for this foreground group.
4.2 Profiles
We now analyse the temperature, column density and metallicity profiles. To construct these profiles, we have defined annuli of variable widths; these widths were chosen to have a sufficient number of photons in each annulus for a significant analysis (5000 photons in the central zone and outermost region and 10000 photons in the other annuli, after background subtraction).


In the profile shown in Fig. 8 both the temperature and hydrogen column density were free parameters, while the metallicity remained fixed to Z=0.3Z⊙. We observe in this case a temperature which is smaller in the central regions, while annuli located further out show a higher temperature. This temperature profile is consistent with that of Kneer et al. (1996). Fig. 9 shows that the column density has an inverse behaviour: a much higher value in the very center, and smaller values in the outer regions, even unacceptably smaller than the lower limit N cm-2. Such a behaviour could be due to the negative correlation between the X-ray gas temperature and NH (see Fig. 1). We have therefore fixed hereafter the column density to this canonical value. The temperature profile, displayed in Fig. 10, is then compatible with an isothermal profile. The data and fitting methods that we use forbid an objective choice between both temperature profiles. Note that excess absorption in the very centre has been reported by Prestwich & Daines (1994) from ASCA data; it could be interpreted as due to neutral hydrogen in the cD galaxy and/or to one of the cold phases of the intracluster gas.

We have searched for a variation of metallicity with radius, by letting the metallicity and temperature vary in concentric regions, leaving NH fixed to its canonical value. In the very central part (radius of 30 arcsec), where the cD is located, we find a high metallicity ZZ⊙ and a temperature T= keV. In all the other concentric annuli (or their sum), we only obtain an upper limit of 0.1Z⊙ for the metallicity. The metallicity is therefore significantly larger in the center than the usual value of ZZ⊙. Moreover, other fits with various values of NH (even if NH is left free to vary) always lead to higher values of Z in the center. Further out we only have upper limits for the metallicity; this is consistent with the global value ZZ⊙ derived above (section 4.1). The large difference in metallicity that we find between the center and other regions is comparable to the steep metallicity gradients respectively found for the Virgo and Centaurus clusters by Koyama et al. (1991) using GINGA and Fukazawa et al. (1994) using ASCA.
5 Modelling results
The description of the morphology of the cluster presented in section 3 shows the difficulty of applying the fitting method described above (section 2.4). In particular, the fact that the south blob is the sum of independent objects forbids us to fit this region assuming a diffuse distribution of X-ray gas. We therefore excluded from our analysis the angular sector between and (anticlockwise from north) inside which this secondary component lies. Taking into account the fact that the contribution of what we have called the ‘Foreground Structure’ represents of the total number of counts in the image, we have neglected it in our analysis. The central peak is displaced relatively to the center of the large scale configuration; however the distance between this peak and the center is small (two or three pixels); we have therefore modelled the image by situating the center of our synthetic image on this peak. Our analysis was applied to images of 512 512 and 256 256 pixels. For the sake of simplicity, the temperature was assumed to be isothermal with a value of 4 keV. An attempt to fit the contribution of the central peak has not given convincing results.
5.1 Density profiles

| Model | Gas mass | Gas mass | Gas mass | Dyn. mass | Dyn. mass | Dyn. mass | |||
|---|---|---|---|---|---|---|---|---|---|
| () | (kpc) | (1 Mpc) | RL | (3 Mpc) | (1 Mpc) | RL | (3 Mpc) | ||
| () | () | () | () | () | () | ||||
| 1 | 6.5 | 0.497 | 60.0 | 1.7 | 3.1 | 9.4 | 1.5 | 2.2 | 4.6 |
| 3 errors | 0.4 | 0.006 | 3.7 | 0.4 | 0.7 | 2.0 | 0.5 | 0.7 | 1.5 |
| 2 | 10.8 | 0.438 | 32.1 | 2.1 | 3.9 | 13.4 | 1.5 | 2.1 | 4.4 |
| 3 errors | 1.0 | 0.005 | 3.1 | 0.6 | 1.1 | 3.9 | 0.5 | 0.7 | 1.4 |
| 3 | 1.000 | 470 |
1 : pixel size = 0.5 arcmin
2 : pixel size = 0.25 arcmin
3 : King profile
| Model | Gas mass | Gas mass | Gas mass | Dyn. mass | Dyn. mass | Dyn. mass | |||
|---|---|---|---|---|---|---|---|---|---|
| () | (kpc) | (1 Mpc) | RL | (3 Mpc) | (1 Mpc) | RL | (3 Mpc) | ||
| () | () | () | () | () | () | ||||
| 4 | 1.5 | 0.62 | 430 | 2.8 | 4.8 | 11.5 | 1.7 | 2.9 | 8.3 |
| 3 errors | 0.06 | 0.02 | 14 | 0.5 | 0.8 | 2.0 | 0.5 | 0.9 | 2.7 |
| 5 | 3.5 | 0.327 | 190 | 2.8 | 5.1 | 16.2 | 1.5 | 2.3 | 5.3 |
| 3 errors | 0.8 | 0.025 | 37 | 2.0 | 3.6 | 11.3 | 0.5 | 0.7 | 1.7 |
4 : pixel size = 0.5 arcmin; MM profile
5 : pixel size = 0.25 arcmin; MM profile
The fits are performed up to the limiting radius RL (15’), or 1.4 h Mpc, corresponding to the radius where the zero-level is reached. However, we find no significant change if the fit is extended up to a radius of 18’. The best fit gives an ellipticity , with the major axis located along PA=152∘. The parameters of the fits as well as other physical quantities derived from our fitting procedures are summarized in Tables 2 and 3. The isophotes of the PSPC image and of a typical synthetic image are displayed in Fig. 11. -model and MM profiles are shown in Fig. 12: they are identical, except in the central pixel.
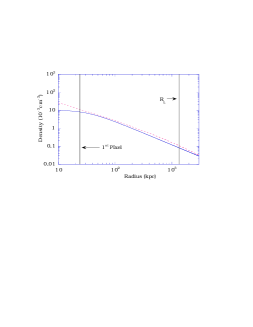
Our analyses provide simultaneously small core radii and weak slopes. A similar result is obtained when we construct a gas profile from concentric elliptical annuli, leading to and kpc. Note that these two parameters are correlated; this explains why the core radius obtained with a King profile (=1) is large (however in this case the quality of the fit is poor). These results are consistent with those obtained from Einstein data using a comparable procedure (GDLL, Durret et al. 1994). They also agree with those found by Matilsky et al. (1985), Schindler et al. (1996) and Schindler & Wambsganss (1996) for other clusters, but not with the larger values derived by Jones & Forman (1984). A bad background subtraction could lead to low values of ; however, our background subtraction was performed using the software developed by Snowden et al. (1994) and we have checked that it was correctly done. Besides, analyses in the central region of clusters acting as gravitational lenses, have shown that the dark matter distribution would present extremely small core radii. This set of results – although ABCG 85 is not known as a lense cluster – strenghtens our confidence in our results.
5.2 Mass distribution
We integrate the density profiles determined above to obtain the mass of the X-ray gas. The dynamical mass was derived under the assumption of hydrostatical equilibrium, using the following formula:
| (5) |
where is in kpc, in keV and in solar masses.
The masses were computed at the distances Mpc, RL and also at Mpc (even if 3 Mpc is out of the image) to compare with previous studies (GDLL, Jones & Forman 1984). Results are given in Tables 2 and 3 for a Hubble constant H∘=50 km s-1 Mpc-1. The dependences of these masses with H∘ are: M and M. The gas and dynamical masses found here are smaller than previously found (GDLL) by factors of 2 and 3 respectively; this can be accounted for by the fact that the dynamical mass depends on the X-ray gas temperature, which is now taken to be lower. Henriksen & White (1996) give larger gas masses but inside a radius of 4.4 Mpc, a distance to which an extrapolation is hazardous. Integrated mass profiles are shown in Fig. 13.
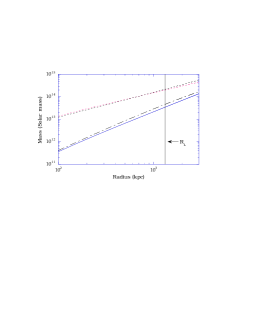
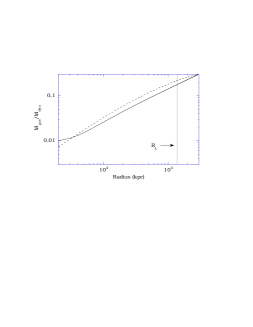
The ratio of the X-ray to dynamical masses is shown in Fig. 14. The very steep slope of this curve indicates that the binding matter is much more centrally condensed than the gas, as found in previous studies based on Einstein data (see e.g. Durret et al. 1994 and references therein). The behaviour is the same for both density profiles. We find that the X-ray emitting matter (up to ) is of the dynamical mass. The fact that is found to be smaller than 1 leads to a divergent gas mass for large radii, and to a ratio MX/M for a sufficiently large radius. The existence of a strong decrease of the density at large radius is therefore expected to be observed by future X-ray satellites with higher sensitivities.
Using our optical data, we have calculated the luminosity in the V band in the same region as the X-ray image for galaxies with redshifts in the cluster. We find a total luminosity of , leading to a mass-to–light ratio in solar units. Notice that we have taken into account in our calculation the light coming from the ‘Foreground Structure’; the luminosity originating in this group can be estimated as roughly of the total luminosity (estimated in the V band). Assuming a stellar mass-to-light ratio (in solar units), the corresponding stellar mass is , which is not totally negligible compared to the gas mass, since is about 20 of MX. Therefore, roughly 83% of the matter in this cluster is unseen matter.
6 Discussion and Conclusions
6.1 Sunyaev-Zel’dovich effect
The density distribution of the X-ray gas derived from our model can be used in the computation of the Sunyaev-Zel’dovich effect in the direction of this cluster. We derive the relative temperature decrease of the microwave background temperature in the direction of ABCG 85 by applying the usual formula (see e.g. Liang 1995):
| (6) |
where is the X-ray gas temperature, the Thomson scattering cross-section, the electron mass and the gas density projected on the plane of the sky.
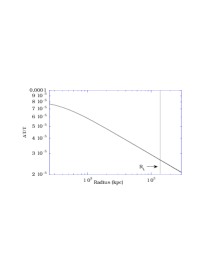
The corresponding curve showing the relative decrease of the microwave background radiation temperature in the direction of ABCG 85 is displayed in Fig. 15. The central value is small () and it does not seem possible to observe it with present techniques, but ABCG 85 is a cluster typical of those that the next generation of submillimeter waveband satellite observatories such as Cobras/Samba will observe (Bersanelli et al. 1996).
6.2 Accretion flow and metallicity
ABCG 85 is a cluster reputed to have a strong central cooling flow (Prestwich et al. 1995, and references therein). The main argument in favour of a cooling flow in ABCG 85 is the fact that the cooling time, is smaller than the cluster age. We may suppose that the gas has lost a significant amount of energy in this region and that mass deposit is taking place.
Descriptions of the distribution and temperature of the X-ray gas based on the formalism of hydrodynamics (or the wind formalism) have been undertaken long ago, at the time of the first X-ray observations. The structure of equations is formally given by:
| (7) |
describing a transport operator applied to [A], which can represent the density, momentum or energy. represents the “sinks”, which in the energy equation will account for radiation losses, and in the density equation will account for losses by matter deposit. represents the injection of matter, momentum and heat originating for example from galaxy winds (generated for instance by super-nova explosions). These equations very often present two types of steady-state solutions: Yahil & Ostriker (1973) gave “outflow” solutions, and Cowie & Binney (1977) proposed an accretion flow model, where the flow is regulated by radiation, in order to account for the fact that the cooling time is of the order of the age of the cluster, and for a possible central over-density. They predicted the formation of clouds and of stars, i.e. a large accretion of gas onto the central galaxy.
The resolution of these equations requires the knowledge of the gravitational potential. It is possible to calculate it to a good approximation from the resolution of the hydrostatic equation, then in a second step to use this potential to obtain accretion models; the deposit is supposed to take place only in the region where the cooling time is smaller than the cluster age (Fabian et al. 1984); it is this last type of analysis which is at the basis of the cooling flow paradigm. Using the standard steady sub-sonic flow model approximation (Fabian & Nulsen 1977) we estimated the rate of mass deposit in the central region of ABCG 85. For all our models, we estimated the rate of mass deposit for the two extreme cluster ages years and years. The results are displayed in Table 4. The mass deposit rates range from to M⊙/yr. These values are lower than those derived by Stewart et al. (1984), who found for this cluster 100 M⊙/yr from Einstein IPC data, or Edge et al. (1992) who give 236 M⊙/yr from Einstein MPC data; however, our values agree with the average value given by Godon et al. (1994). Differences mainly come from a much larger core radius obtained by the first two sets of authors (the effects of differing values of and of the temperature are less important).
| Model | t yr) | r | /yr) |
|---|---|---|---|
| 1 | 1 | ||
| 2 | |||
| 2 | 1 | ||
| 2 | |||
| 3 | 1 | ||
| 2 | |||
| 4 | 1 | ||
| 2 |
This calculation neglects the injection of gas, momentum and energy in the intra–cluster medium. i.e. assumes that the term in equation 7 vanishes.
Since the non steady-state models presented by Hirayama et al. (1978), numerous studies have been done to describe the formation of clusters from an initial perturbation. One of the great difficulties is the crucial role played by the cooling function of the gas (Blanchard et al. 1992). As a consequence, the existence of a multiphase medium appears unescapable. Transport of gas from hot phases to colder phases occur, and the consequence of such a cascade is the formation of stars. It is a precise description of this process (in fact the same as in the insterstellar medium) which accounts for the term in Equation 7 (Chièze et al., in preparation). The next step is, re-injection of metal-rich gas and energy into the gaseous medium after stellar evolution. This process is evoked by Reisenegger et al. (1996) to account for the metallicity of the Centaurus cluster. Their explanations perfectly account for the high metallicity in the center of ABCG 85 (in the cD). In their paper the deposit results from the transport from the multiphase medium to a cooler phase, and the ejected gas heats the surrounding medium. This may account for the central temperature (2.8 keV), which is actually smaller than the mean temperature but is not very cold (see section 4.1) . The existence of several phases presently seems to be confirmed observationally at least in the Virgo (Lieu et al. 1996a) and Coma (Lieu et al. 1996b) clusters.
Besides, detectors such as the IPC and MPC of the Einstein Observatory, or the PSPC of ROSAT have different energy windows. If we consider the spectral analysis, results undertaken with these detectors on the X-ray gas of ABCG 85 give temperatures of 9 keV with the IPC, 6 keV for the MPC, and 4 keV for the PSPC (as indicated in section 4.1). We can wonder if there are not gaseous phases with different temperatures (or a range of temperatures) that are detected by one or another of these instruments in a privileged way. However, the correspondence noticed above in section 4.1 between a temperature of 4 keV and the velocity dispersion (760 km/s) estimated for this cluster suggests that this temperature is correct, or at least is the temperature of the dominant phase.
6.3 Comments on
The baryonic density of the Universe is obtained from the observation of the primordial number ratio of deuterium to hydrogen. Recent controversies (Rugers & Hogan 1996, Schramm & Turner 1996, Tytler et al. 1996) lead to two incompatible values of :
Suppose for a while that clusters – in particular ABCG 85 – are a fair representation of the Universe. The density ratio of the baryonic component to the dynamical one in the cluster would then be equal to . Comparing these values to the 17 of baryonic mass in the cluster leads to :
| (8) |
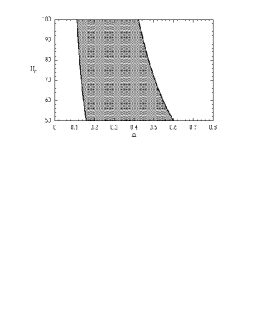
These values are quite similar to those given by David et al. (1995) The high value we found compared to their high limiting value is due to the ‘new’ value for quoted above. We indicate in Fig. 16 the region of the and parameters defined by equation 8. Although the amount of baryons is high in ABCG 85, it is nevertheless compatible with a dense Universe. Furthermore, clusters, and in particular ABCG 85, are certainly not fair representations of the mean Universe; for instance we have found in ABCG 85 a galaxy luminosity function much steeper than in the field (Durret et al. 1996). But unless we favor an Universe, the ‘baryonic crisis’ (White et al. 1993) does not seem dramatic.
6.4 Conclusions
We have shown in this paper that, by combining the use of an X-ray telescope with good spatial resolution, such as the PSPC on ROSAT, with a sophisticated imaging analysis technique such as wavelets, we have gone one step further in our understanding of ABCG 85. The rather simple image we had of this X-ray cluster, considered until recently as a main structure with a smaller one south of it, is now obsolete.
The main part of the X-ray emission is due to the contribution of two clusters very distant from each other, almost on the same line of sight. The emission of the cluster ABCG 85 itself appears as coming from a relaxed cluster, with a weak ellipticity. Our representation therefore strongly contradicts that presented by Kneer et al. (1996), who assume the fusion of a group (the south blob) with the main cluster, since we have shown that the south blob is resolved into very small features; the principal of these features is due to an over–luminosity originating in the X-ray emitting galaxy noted BCM2, which forms a pair with the cD.
The detailed optical study of ABCG 85 undertaken by acquiring both photometry and a large number of redshifts will enable us to discuss in more detail the existence of substructure in ABCG 85 and the kinematical and dynamical properties of this cluster (Durret et al. in preparation).
It is apparent from our results that a good understanding of clusters requires both good X-ray data and extensive redshift catalogues. Obviously, new satellites such as XMM or AXAF will be of great help to model in detail the physical properties of clusters in a near future. However, this analysis of ABCG 85 shows that by combining a good morphological analysis of ROSAT PSPC images performed with wavelets and a modelling of the X-ray gas such as that presented here, it is already possible to change dramatically our view of this cluster. We therefore intend to apply these techniques to a sample of clusters observed with the ROSAT PSPC in a near future.
Acknowledgements.
We acknowledge helpful e-mail exchanges with S. Snowden concerning the use of his software. We thank J.-M. Alimi, J.-P. Chièze, B. Guiderdoni, N. Prantzos, R. Tessier and A. Vikhlinin for enlightening discussions. We are very grateful to the referee, M. Pierre, for many interesting suggestions which helped to improve the paper. Finally, we thank G. Steigman for pointing out a mistake.G.B.L.N. thanks Alexander v. Humboldt Stiftung. We acknowledge financial help from GDR Cosmologie, CNRS.
References
- [1] Abell G.O. 1958, ApJS 3, 211
- [2] Bersanelli M., Bouchet F.R., Efstathiou G. et al. 1996, ESA Report D/SCI(96)3
- [3] Biviano A., Durret F., Gerbal D. et al. 1996, A&A 311, 95
- [4] Blanchard A., Mamon G.A., Valls–Gabaud D., 1992, A&A 264, 365
- [5] Briel U.G., Henry J.P. 1994, Nature 372, 439
- [6] Cowie L.L., Binney J. 1977, ApJ 215, 723
- [7] David L.P., Jones C., Forman W. 1995, ApJ 445, 578
- [8] David L.P., Slyz A., Jones C., Forman W., Vrtilek S.D. 1993, ApJ 412, 479
- [9] Dickey J.M., Lockman F.J. 1990, ARA&A 28, 215
- [10] Durret F., Gerbal D., Lachièze-Rey M., Lima-Neto G., Sadat R. 1994, A&A 287, 733
- [11] Durret F., Felenbok P., Gerbal D. et al., 1996, Proc. ESO Conference “The Early Universe with the VLT”
- [12] Edge A.C., Stewart G.C. 1991, MNRAS 252, 428
- [13] Edge A.C., Stewart G.C., Fabian A.C. 1992, MNRAS 258, 177
- [14] Fabian A.C., Nulsen P.E.J. 1977, MNRAS 180, 479
- [15] Fabian A.C., Nulsen P.E.J., Canizares C.R. 1984, ARA&A 310, 733
- [16] Fukazawa Y., Ohashi T., Fabian A.C. 1994, PASJ 46, L55
- [17] Forman W., Jones C. 1982, ARA&A 20, 547
- [18] Gerbal D., Durret F., Lima-Neto G., and Lachièze-Rey M. 1992, A&A 253, 77
- [19] Godon P., Soker N., White III R.E., Regev O. 1994, AJ 108, 2009
- [20] Henriksen M.J., White, R.E. III 1996, ApJ 465, 515
- [21] Henry J.P., Briel U.G. 1995, ApJ 443, L9
- [22] Hirayama Y., Tanaka Y., Kogure T. 1978, Prog. Theor. Phys. 59, 751
- [23] Jones C., Forman W. 1984, ApJ 276, 38
- [24] Kneer R., Böhringer H., Neumann D., Krautter J. 1996, MPE Report 263, 593
- [25] Koyama K., Takano S., Tawara Y. 1991, Nature 350, 135
- [26] Leir A.A., van den Bergh S. 1977, ApJS 34, 381
- [27] Liang H. 1995, PhD Thesis, Australian National University
- [28] Lieu R., Mittaz J.P.D., Bowyer S., et al. 1996a, ApJ 458, L5
- [29] Lieu R., Mittaz J.P.D., Bowyer S., et al. 1996b, Preprint
- [30] Matilsky T., Forman W., Jones C. 1985, ApJ 291, 621
- [31] Mellier Y., Mathez G. 1987, A&A 175, 1
- [32] Mewe R., Lemen J.R., van den Oord G.H.J. 1986, A&AS 65, 511
- [33] Mitchell R.J., Ives J.C., Culhane J.L. 1977, MNRAS 181, 25P
- [34] Morrison R., McCammon D. 1983, ApJ, 270, 119
- [35] Prestwich A.H., Daines S. 1994, BAAS 185, 74.02
- [36] Prestwich A.H., Guimond S.J., Luginbuhl C.B., Joy M. 1995, ApJ 438, L71
- [37] Raymond J.C., Smith B.W. 1977, ApJS, 35, 419
- [38] Reisenegger A., Miralda-Escudé J., Waxman E. 1996, ApJ 457, L11
- [39] Rué F., Bijaoui A. 1996, Experimental Astronomy submitted
- [40] Rugers M., Hogan C.J. 1996, ApJ 459, L1
- [41] Schindler S., Hattori M., Neumann D.M., Böhringer H. 1996, A&A in press
- [42] Schindler S., Wambsganss J. 1996, A&A, 313, 113
- [43] Schramm D.N., Turner M.S. 1996, Nature 381, 193
- [44] Serna A., Gerbal D. 1996, A&A 309, 65
- [45] Slezak E., Durret F., Gerbal D. 1994, AJ 108, 1996
- [46] Snowden S.L., McCammon D., Burrows D.N., Mendenhall J.A. 1994, ApJ, 424, 714
- [47] Stewart G.C., Fabian A.C., Jones C., Forman W. 1984, ApJ 285, 1
- [48] Struble M.F., Rood A.J. 1987, ApJ 271, 422
- [49] Tytler D., Fan X.-M., Burles S. 1996, Nature 381, 207
- [50] White S.D.M., Navarro J.F., Evrard A.E., Frenk C.S. 1993, Nature 366, 429
- [51] Yahil A., Ostriker J.P. 1973, ApJ 185, 787
- [52] Zimmerman H.U., Becker W., Belloni T. et al. 1994, EXSAS Users’ Guide, MPE Report 244