1 Introduction
We would like to start this discussion by attempting to make a useful, working distinction between catalogs and databases of astronomical objects. It seems to us that such a distinction could be made based upon the mode of access to the information: A catalog may be considered as a list of objects, almost invariably ordered by coordinates; a database, on the other hand, may be distinguished by its ability to extract a set of objects based on user-given criteria, such as all objects within a certain sky region with magnitudes brighter than in the blue. Catalogs form the basis of the database, which adds the means of multi-criteria access to the information. In concrete terms, one usually thinks of SIMBAD, NED and LEDA as databases, while an ftp site containing electronic lists of objects may be thought of as a catalog storage warehouse.
The next comment we would like to make is related to the above definition and concerns the sizes of astronomical catalogs. In Table 1, we list the numbers of objects expected or currently existing in various catalogs. The list is by no means exhaustive, but only meant to give an idea of the number of cataloged objects as a function of spectral domain. It is clear that there is a large dichotomy between the Optical/Near-infrared (NIR) and the rest of the spectrum: for the former, one expects on the order of sources, while in no other part of the spectrum is there more than a few sources. In terms of numbers and storage volume, the Optical/NIR dominates, and this has important consequences for both the access to and the science performed with astronomical catalogs.
Optical/NIR Other GSC-II: FIRST: USNO A1: IRAS: SuperCOSMOS/APM: ROSAT: DENIS/2MASS: -
What is the origin of this dominance? As an answer to this question, we will take the opportunity to defend a little the oft-attacked photographic plate. The advantages of CCDs should not obscure the fact that the photographic plate has proven itself as a magnificent detector, combining a large field-of-view with high spatial resolution; and it is its own storage medium. Remember that a Schmidt plate with 1 arcsec resolution represents pixels taken in a single exposure! No other detector to date can cover the focal plane with more efficiency. Although modern detectors are beginning to achieve the same sky coverage and resolution as photographic plates by scanning CCD arrays across the sky (such as DENIS, 2MASS and the Sloan Digital Sky Survey), it seems to us arguable that part of the reason for the dominance of the Optical/NIR rests with the one-hundred year legacy of photographic plates.
Apart from the serious, it must be said, drawbacks of nonlinearity and calibration difficulties, photographic plates present a problem of access: the information is not readily manipulated, as is a computerized image. This has changed with the advent of plate scanning machines, which produce the desired electronic quantification. However, this digitization program suffers from the need of adequate storage media for the terabytes of data that a full sky Optical/NIR survey produces; this problem highlights the performance of a photographic plate as a storage medium, the equal of which, in terms of the ratio (viability)/(volume) over long periods of time, is as yet unmatched.
In fact, the key challenge facing astronomical archiving at present is this question of storage and access to such large quantities of data. As an example, the “classical”, if such a term is now permitted, databases such as SIMBAD, NED or LEDA contain at most a few objects; multi-criteria access to a much larger number of objects seems to demand novel techniques, and forms a large part of the development effort of the Sloan Survey (Szalay, Brunner - these proceedings). An interesting question in this context is the relation between efficient storage and science. Designing an archive structure for quick access requires some knowledge of the correlations and clustering of the data in the space defined by the measured parameters. This amounts to a statistical analysis of the survey objects’ properties.
Let us finish this section by returning to the implications of the Optical/NIR dominance. One important consequence of this dominance is that it would seem to guarantee that most cross-identification efforts of newly detected objects in other wavebands will rely Optical/NIR catalogs. The questions we would pose are: “Is it useful to have a centralized database of the ensemble of Optical/NIR objects?”; and, if so, “Who has the resources to construct it?” These questions concern the construction of a true multi-criteria database, the fundamental elements of which, as we have seen, require something beyond that presently used by NED/SIMBAD/LEDA.
2 Cross Identifications - Nature of the Problem
In this section, we would like to discuss some statistical aspects of the general problem of identifying objects from two different catalogs, a procedure known as the cross–identification of sources. The two catalogs will be called Letters and Numbers.
2.1 As a Test of Hypotheses
Consider the situation depicted in Figure 1, where we wish to cross-identify a source, , from catalog Letters with objects from the catalog Numbers, two of which are shown within the error ellipse of source A (sources 1 and 2). Key to the problem are accurate positions in the two catalogs, because spatial proximity serves as a primary criterion. After selecting objects for consideration based on coordinates, one may think to apply supplementary criteria; for example, suppose that were an IRAS source with galaxy colors, and that source 1 is an optical galaxy, while source 2 is a star. This additional information would favor an identification with the optical galaxy.

A quantitative approach must rely on a measure of the acceptability of a given cross-identification. If we ignore, for simplicity, any supplemental information, we may define the likelihood that source 1 is the same as source A as the probability that the two cataloged positions would be separated by distance if they represented the same physical object. Assume that the position of source 1 (and 2) is much more precise than that of source A; and, further, that the error in position A is described by a two-dimensional Gaussian. Then,
| (1) |
where is the covariance matrix and is its determinant. The Poisson term expresses the probability of finding one source from Numbers by chance alignment within at magnitudes brighter than , when the expected number is . We denote this likelihood by the subscript , which will hereafter refer to the hypothesis that sources 1 and A are the same. Notice that this procedure requires a clear quantitative statement of the positional errors (i.e., a Gaussian distribution). The alternate hypothesis, that sources 1 and A are separated by distance by chance alignment, may be assigned the likelihood
| (2) |
Here, denotes the density of objects in the reference catalog (Numbers) at the magnitude of source 1, . The subscript will denote the hypothesis that the sources, 1 and , are not the same physical object.
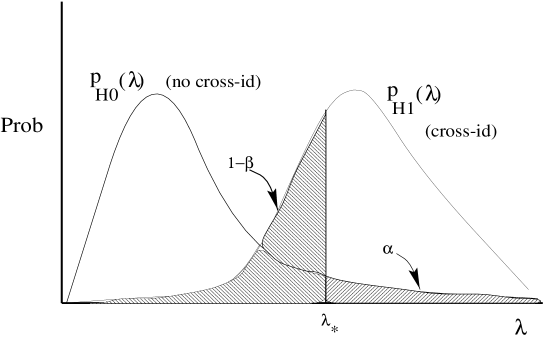
The decision to cross-identify sources 1 and A now amounts to the statistical rejection of the null hypothesis, . For this purpose, we may employ the likelihood ratio test (Meyer 1975), which focuses on the quantity . We must now construct the probability distributions of under the assumptions () and (). This step requires a set, sometimes called the training set, of previously known, sure-fire cross-identifications. We emphasize the importance of this training set and the fact that the need for such a priori information is unavoidable in any quantified approach. Suppose, then, that we have found the two distributions and that they resemble the curves shown in Figure 2.
We identify source A with source 1 with confidence if the observed value , where is defined by (note that capital refers to the cumulative distributions). The confidence represents the probability of a type I statistical error, or the chance that the cross–identification is wrong. The power, , of our cross-identification is defined by ; the quantity represents the probability of a type II statistical error and embodies the concept of the reliability of a conclusion that the sources are not the same. A wonderful example of this kind of approach is given by Lonsdale et al. (1996), and we are grateful to C. Lonsdale for helpful discussion on this topic.
2.2 As a Maximization of Likelihood
In the case just described, the cross-identification was made without regard to the outcome of attempts to cross-identify other sources. This approach might be readily applied when catalog Letters contains many fewer objects than catalog Numbers (a situation we may describe by saying that “catalog Numbers is dense within catalog Letters”). Consider another case in which the two catalogs each have about the same source density, as schematically represented in Figure 3. In pursuing the cross-identification of source A with source 1, it now seems particularly urgent to incorporate the possibility that source 1 could also be identified with source B. One way of proceeding is to calculate the probability, , , of each of the seven possible outcomes of the cross-identification of the two catalogs: , , , , , , , where a means that the source in Letters has no counterpart in catalog Numbers. The case which has the largest probability represents the most likely cross-identification of the two catalogs, and therefore the proper choice. This approach is global in that it seeks the most satisfactory solution for all the sources considered at once. Note that this method is well adapted to treat systematic problems, such as a coordinate offset between the two catalogs; in fact, it incorporates what we mentally do to align two sky charts. The drawback of this approach, as formulated, is the large computing power required to consider all possible cross–identifications.

3 Two Software Systems
In this section, we present the characteristics of two software systems designed to aid the astronomer in making cross-identifications. These packages are interactive, and therefore not suitable for performing automatic cross-identifications of large catalogs. Their philosophy is, rather, to replace by interactive software the tasks of going to the library to obtain and combine copies of images (e.g., sky survey films), tables and catalogs for a specific region of the sky. The second package, Aladin , is particularly well adapted for the training/optimization of automated routines (recall the importance of the training set in Section 2), the cross-identifications of small, user catalogs and the resolution trouble cases, which is useful for astronomical database quality control and for “mopping-up” difficult objects flagged by an automatic routine.
3.1 SkyView - http://skyview.gsfc.nasa.gov/skyview.html
This package is provided by the NASA Goddard Space Flight Center (McGlynn et al. 1996). SkyView exists in true interactive form or as a Web tool. On the Web, the user fills out a form requesting images and catalogs of interest; SkyView then returns a composite image overlaying the requested images and the positions of the cataloged objects in the region. Available images cover the entire electromagnetic spectrum, from Gamma rays (EGRET) to the radio, and may be superimposed by adjusting a color table or by plotting the contours of one image on another. A large range of catalogs are on-line. In addition to plotting the positions of the selected catalog objects, SkyView returns a table containing the stored information on each object. Access to SIMBAD as a name resolver permits the user to select a region of sky by giving the name of a well known object instead of sky coordinates.
3.2 Aladin - http://cdsweb.u-strasbg.fr/CDS.html
Aladin is an interactive sky atlas under development at the Centre de Données astronomiques de Strasbourg (CDS) (Bonnarel et al. 1996). Aladin provides unified access to the CDS archives by overlaying the positions of cataloged objects on digitized images of Schmidt plates. To obtain the information, the Aladin client queries the CDS SIMBAD, catalog ( catalogs) and image archive servers. Additionally, the client accepts both user defined catalogs, permitting the astronomer to visualize his sources in conjunction with documented information, and user given image files, provided they conform to the World Coordinate System FITS extension. The image archive at CDS consists of the Space Telescope Science Institute’s Digital Sky Survey, first and second epochs (as this becomes available), and higher resolution scans (0.7 arcsecs/pixel) of the Southern Galactic Plane, Ecliptic Poles and the Magellanic Clouds; these latter images are provided by the MAMA facility at the Paris Observatory and by SuperCOSMOS of the Royal Observatory, Edinburgh. All of the images include astrometric and photometric calibrations.
Beyond its capability of visualization, Aladin furnishes an active approach to cross-identification: The system includes image analysis tools for the detection, extraction and classification of objects found on the image. For example, the user may plot the positions of his sources and then request that all objects on the image found within a specified aperture, centered on his positions, be extracted and associated with the corresponding sources in a table, which may then be written to disk. In this way, he directly creates a new catalog of his sources cross-identified with objects from a pre-selected catalog.
4 Acknowledgments
We are very grateful for the helpful discussions that we enjoyed with F. Bonnarel, C. Lonsdale and S. Mei.
References
- [1] Bonnarel et al. 1996, poster presented at this meeting.
- [2] Lonsdale et al. 1996, poster presented at this meeting.
- [3] McGlynn et al. 1996, poster presented at this meeting.
- [4] Meyer, S.L. 1975, “Data Analysis for Scientists and Engineers”, John Wiley & Sons (New York); or any standard text on statistics.