Synthesis Imaging of Dense Gas in Nearby Galaxies
Abstract
We present images of the HCN J = 1-0 emission from five nearby spiral galaxies made with the Berkeley-Illinois-Maryland Association interferometer. The HCN observations comprise the first high-resolution ( 5″– 10″) survey of dense molecular gas from a sample of normal galaxies, rather than galaxies with prolific starburst or nuclear activities. The images show compact structure, demonstrating that the dense gas emission is largely confined to the central kiloparsec of the sources. To within the uncertainties, 70 - 100% of the single-dish flux is recovered for each source; this implies that there is not a significant contribution to the HCN flux from low-level emission in the disks of the galaxies. In one of the galaxies, NGC 6946, the ratio of HCN to CO integrated intensities ranges from 0.05–0.2 within the extent of the HCN emission ( pc), with an average value of 0.11 0.01 over the whole region; the range and average values of the ratios in NGC 6946 are very similar to what is observed in the central pc of the Milky Way. A comparison with single-dish observations allows us to place an upper limit of 0.01 on the ratio of integrated intensities in the region pc in NGC 6946. In NGC 6946, NGC 1068 and the Milky Way, the ratio IHCN/ICO is 5 to 10 times higher in the bulge regions than in their disks; this suggests that the physical conditions in their bulges and disks are very different. Furthermore, the presence of dense gas on size scales of 500 pc in the centers of these nearby galaxies and the Milky Way suggests that the internal pressure is at least 107 cm-3 K in their centers; this is some three orders of magnitude greater than the pressure in the local interstellar medium in the Milky Way, and it is two orders of magnitude greater than the pressure from the self-gravity of a solar neighborhood giant molecular cloud. In NGC 4826 and M51, as in the Milky Way and NGC 1068, there is a linear offset of 100 pc between the dense gas distribution and the peak of the radio continuum emission. We did not detect HCN towards three additional spiral galaxies.
1 Introduction
Single dish millimeter observations of HCN and CS emission from nearby galaxies show that most spiral galaxies, not just starburst galaxies, have an appreciable amount of dense ( 105 cm-3) gas in their bulges (Helfer & Blitz 1993 and references therein). These observations are in good agreement with what is seen in the inner parsecs of the Milky Way, where strong, diffuse emission from CS (Bally et al. 1987) and HCN (Jackson et al. 1996) is observed despite the moderate star formation rates there. (HCN and CS trace gas densities of 105 cm-3 in galaxies; this is two orders of magnitude higher than the density required to excite CO.) The ubiquity of large-scale emission from HCN and CS over hundreds of parsecs in the centers of galaxies is surprising when compared with the known properties of giant molecular clouds (GMCs) in the solar neighborhood, which contain few and relatively small ( pc-scale) clumps of dense gas — and these only where stars are actively forming or where stars have formed very recently (i.e. where there is a local source of pressure, not common to the GMC as a whole).
In galaxies, single-dish millimeter wavelength beams typically cover tens to hundreds of GMC-sized diameters. As part of our program to measure the degree to which different galactic environments affect the properties of molecular clouds, we began a program with the Berkeley-Illinois-Maryland Association (BIMA) interferometer to survey eight nearby galaxies in HCN emission in order to measure the distribution and amount of dense gas on size scales of individual GMCs or small associations of GMCs. We consider these galaxies to be “normal” since they do not have prolific circumnuclear starbursts or active galactic nuclei; however, like most spiral galaxies, these galaxies have low-level nuclear line emission (Ho, Filippenko & Sargent 1993). In this paper, we present the results of the BIMA survey. We also present a comparison of the HCN emission from one of the sources, NGC 6946, with its CO J = 1-0 emission (Regan & Vogel 1995). A comparison with the CO emission from the other sources will be the topic of a future paper.
2 Observations
2.1 BIMA Observations
The sources and their coordinates are listed in Table 1. The sources were selected from the single-dish survey of Helfer & Blitz (1993) as galaxies with strong CO emission that were also detected in HCN with a single pointing using the NRAO 12 m telescope. The data were collected with the BIMA interferometer (Welch et al. 1996), which then comprised 6 antennas, between 1994 February 15 and 1995 May 02; the observations included data from up to three array configurations. For each source, the receivers were tuned to the redshifted frequency of the HCN J = 1-0 transition (o = 88.61 GHz). The data were processed using the MIRIAD package (Sault, Teuben, & Wright 1995). The time variations of the amplitude and phase gains were calibrated using short observations of nearby quasars every 30 minutes; a planet or strong quasar was observed to set the absolute flux scale as well as to calibrate the spectral dependence of the gains across the IF passband. The digital correlator was configured to achieve a maximum spectral resolution of 1.56 MHz (5.3 km s-1). For some of the observations, there was an intermittent phase lock on one of the antenna receivers that was not discovered until after the observations; in these cases all baselines involving that antenna were eliminated from further data reduction.
For each source, the calibrated data were smoothed to 21.1 km s-1 resolution, then gridded and Fourier transformed using natural weighting. The visibilities were also weighted by the inverse of the noise variance, which was determined from the system temperatures and from the gains of the individual antennas. We cleaned the maps using the standard Högbom algorithm. Maps of integrated intensity were made by summing those channels with emission after clipping the channel maps at a 1 level. The beam sizes and noise levels of the final maps are listed in Table 2. The noise levels are somewhat underestimated relative to the formal uncertainties, since they were determined from the clipped moment maps. The absolute flux calibration in all maps is probably accurate to 30%.
2.2 Single-dish Observations of CO in NGC 6946
We have also used BIMA to image CO in the centers of three of the galaxies (NGC 3628, NGC 4826, and M83) with detected HCN emission. A fourth galaxy, NGC 6946, has been imaged in CO using BIMA by Regan & Vogel (1995). The CO emission, unlike the HCN emission (see below), is significantly “resolved out” in the interferometric images of these galaxies; it is therefore necessary to fill in the zero-spacing flux with a single-dish telescope. We are currently still making these measurements for the first three sources; we therefore defer further discussion of the CO results for these galaxies to a future paper.
In the case of NGC 6946, we measured the CO short-spacing flux with the NRAO 12 m telescope111The National Radio Astronomy Observatory is operated by Associated Universities, Inc., under cooperative agreement with the National Science Foundation. and combined these data with Regan & Vogel’s BIMA map. We observed on 95 June 20–21 in the newly implemented “on-the-fly” (OTF) scheme at the NRAO 12 m (Emerson et al., in preparation) and covered a region roughly 5′ on a side. We observed orthogonal polarizations using two 256 channel filterbanks, each with a spectral resolution of 2 MHz per channel. The data were gridded and a linear baseline removed from the resulting data cubes in AIPS; the data were then transferred to the MIRIAD package for further processing. Details of the single dish and interferometric data combination were very similar to those described in Helfer & Blitz (1995) for the case of NGC 1068.
3 Results
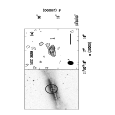
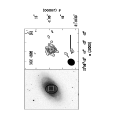
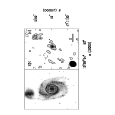
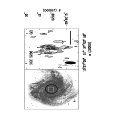
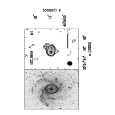
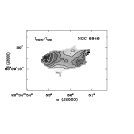
We detected HCN in five of the eight galaxies: NGC 3628, NGC 4826, NGC 5194 (M51), NGC 5236 (M83), and NGC 6946; their images are presented in Figure 1 along with optical images from the Digitized Sky Survey.222Based on photographic data of the National Geographic Society – Palomar Observatory Sky Survey (NGS-POSS) obtained using the Oschin Telescope on Palomar Mountain. The NGS-POSS was funded by a grant from the National Geographic Society to the California Institute of Technology. The plates were processed into the present compressed digital form with their permission. The Digitized Sky Survey was produced at the Space Telescope Science Institute under US Government grant NAG W-2166. The spectra from the positions of peak HCN emission in each of the detected sources are shown in Figure 4.
In each case, the HCN images show compact structure, with the detected emission confined to the central 500 pc diameter; the 5″–10″ FWHM synthesized beam sizes correspond to linear resolutions of 125–200 pc at the distances of the galaxies. While the HCN emission is compact, it appears resolved by the interferometer in each map. In order to investigate the effect of the lack of sampling at small spatial visibilities, we compared the integrated intensities measured with the interferometer to the single-dish fluxes of Helfer & Blitz (1993). Table 3 lists the integrated intensities measured at BIMA along with those measured at the NRAO 12 m and the fraction of the single-dish flux recovered by the interferometer. With the possible exception of M51 (see 3.1), the interferometer appears to recover all the single-dish flux measured by Helfer & Blitz. This means that the maps shown in Figure 1 are a reliable representation of the distribution of the HCN emission, constrained of course by the usual limitation of the signal to noise ratios. Allowing for low-level, more diffuse emission detected at , we conclude that the HCN emission is confined to the central kiloparsec of the galaxies (it is perhaps slightly more extended in M51). The spatial extent of the HCN emission is in good agreement with what is seen in the Milky Way (Jackson et al. 1996) and in NGC 1068 (Helfer & Blitz 1995).
3.1 Individual Sources
The galaxies in this survey were originally selected from a list of the brightest extragalactic CO emitters (see Helfer & Blitz 1993). The following are brief descriptions of the individual sources.
NGC 3628 – This galaxy is a member of the Leo triplet (along with NGC 3623 and NGC 3627). It is a nearly edge-on Sbc galaxy with a prominent and irregular dust lane. Its nuclear region contains a modest starburst (e.g. Condon et al. 1982, Braine & Combes 1992). The CO from NGC 3628 (Young, Tacconi, & Scoville 1983; Boissé, Casoli, & Combes 1987; and Israel, Baas, & Maloney 1990) is strongly peaked in the inner kiloparsec and has a similar extent and mass as that in the center of the Milky Way (Boissé et al. 1987). The HCN in NGC 3628 is resolved and appears elongated in the east-west direction. There is emission at the 2 level to the northwest of the central source that may be associated with gas further along the major axis. The HCN, CO and radio continuum centers of NGC 3628 all peak some 21″ to the southeast of the optical nucleus; however, the optical nucleus is heavily obscured and its position is highly uncertain (Boissé et al. 1987).
NGC 4826 – This Sab galaxy has been called variously the “Black Eye,” the “Evil Eye,” or somewhat more optimistically (Rubin 1994) the “Sleeping Beauty” galaxy for its conspicuous dust lane (see Sandage 1961; see also the cover of The Astronomical Journal, 1994, 107, 1). NGC 4826 has gained notoriety recently for the discovery that the inner kiloparsec-scale disk is counterrotating with respect to the larger scale rotation of the galaxy (Braun, Walterbos, & Kennicutt 1992; Rubin 1994; Braun et al. 1994). The CO emission (Casoli & Gerin 1993) is confined to the inner . The HCN emission appears symmetric and centrally peaked in NGC 4826.
NGC 5194 (M51) – M51 is the prototypical grand design spiral and is one of the best studied galaxies in CO emission. Interferometric CO images of the nuclear region of M51 (e.g. Lo et al. 1987; Rand & Kulkarni 1990; and Adler et al. 1992; the last includes zero-spacing flux) show a notable lack of a single central concentration of CO, despite the strong molecular emission associated with the spiral arms in the nuclear region. M51 is the only galaxy of the five detected in HCN at BIMA that does not have a strong central concentration of CO. In contrast to the CO emission, the HCN emission does appear to be centrally concentrated, though there is a significant contribution to the total flux from low-level () emission. We note that Kohno et al. (1996) mapped the central concentration as well as more extended structure in their HCN map of M51 observed with the Nobeyama Millimeter Array. The linear extent of the low-level () HCN emission in the BIMA map is somewhat larger than those of the other four galaxies studied here, and the interferometer may have “resolved out” a nonnegligible contribution to the total flux in this source (Table 3). For M51, the flux of structures larger than 18″ is attenuated by 50%.
NGC 5236 (M83) – This well-studied source is a grand design, Sc/SBb spiral galaxy with strong circumnuclear star formation within the central few hundred pc (e.g. Gallais et al. 1991). The HCN emission is strongest at the position of the peak of the radio continuum emission (Condon et al. 1982; Turner & Ho 1994); the condensations to the east and to the south of the strongest HCN emission are also apparent in the radio continuum. The synthesized beam of the interferometer is quite elongated because of the foreshortening of the north-south baselines toward this low declination source. The north-south elongation of the HCN emission is therefore almost certainly an artifact of the observations.
NGC 6946 – This late-type, grand design spiral galaxy contains a moderate starburst (Turner & Ho 1983). Within the inner 1.5 kpc diameter, the CO in this galaxy has a non-axisymmetric, north-south distribution that has been interpreted as a bar (Regan & Vogel 1995 and references therein). However, Regan & Vogel (1995) combined new CO and K-band observations and showed that the CO traces gas on the trailing side of spiral arms; their observations are consistent with what is expected for the gas and stellar response to a spiral density wave rather than a bar. The CO peaks up strongly in the inner 300 pc diameter of NGC 6946. The HCN emission is detected in this region and is resolved and slightly extended in an east-west direction, with an additional elongation towards the northwest (there is a similar northwest extension in the CO map of Regan & Vogel 1995). We discuss this source more fully in the following section.
3.2 in NGC 6946
The ratio of the 3 mm integrated intensities, , may be used as a qualitative measure of the molecular gas density (e.g. Helfer & Blitz 1996). In order to determine any line ratio from interferometric measurements, one must first take into account the possibility that the flux measured with the interferometer is missing a significant contribution from large-scale structures in the maps. In NGC 6946, the interferometer recovers all the single-dish HCN flux to within the errors of the measurement (Table 3). For the CO, the Regan & Vogel (1995) BIMA map recovered about half the single-dish flux; we therefore modeled the short spatial frequency visibilities from the NRAO 12 m data ( 2.2) and combined these with the BIMA CO map. The CO distribution and flux in the resulting map did not change appreciably interior to r = 15″; at larger radii, the most dramatic flux increases were distributed over radii from 20″–50″, though the shape of the structures remained about the same. With the fully-sampled CO map, we can now make a legitimate comparison of the HCN and CO intensities for this source.
To determine the ratio in NGC 6946, we convolved the CO map to match the resolution of the HCN image, and we converted both intensities to a main beam brightness scale ( ); the ratio was computed only for regions with detected HCN emission (I, or r 15″). The resulting ratio map of IHCN/ICO is presented in Figure 5. Although the emissions from CO and HCN both peak at the center of NGC 6946, the distribution of the HCN/CO ratio is saddle-shaped, with the highest values to the east and west of the nucleus by about 7″ (175 pc) and the lowest values to the northwest and southeast of the nucleus by about 5″ (125 pc). At first, it seems surprising that the ratio does not rise monotonically to the central position. However, at the small size scales resolved by the interferometer ( pc), the characteristics of individual molecular clouds start to dominate the distribution, rather than the integrated effects of dozens of GMCs. It may be that the small-scale ratio is dominated by local effects from individual clouds; this effect is seen within the central few hundred pc of the Milky Way, where the ICS/ICO ratio (Helfer & Blitz 1993) and the IHCN/ICO ratio (Jackson et al. 1996) look very clumpy and irregularly distributed. In the Milky Way, features like the Sgr A and B GMCs are characterized by relatively high values in the ratio maps.
The average ratio over the extent of the HCN emission (, or 300 pc diameter) in NGC 6946 is , with a peak value of 0.19 and a minimum of 0.049. The range of IHCN/ICO in NGC 6946 is very similar to what is seen in the Milky Way by Jackson et al. (1996); on small scales within the inner few degrees of the Milky Way, IHCN/ICO ranges from 0.04 to 0.12, and the average over the extent of the HCN emission, or r 300 pc, is 0.08 (see below).
We can compare the ratio we measure in the central 300 pc of NGC 6946 with those measured with larger apertures: the single dish ratios of IHCN/ICO in NGC 6946 are 0.063 0.007 at a resolution of 24″ (600 pc) (Nguyen-Q-Rieu et al. 1989; Weliachew, Casoli, & Combes 1988) and 0.025 0.003 at a resolution of (1500 pc) (Helfer & Blitz 1993). Figure 6 shows this radial distribution of the average integrated IHCN/ICO ratio. It is important to note that the points shown in Figure 6 represent the average ratios over the area enclosed at the radius , i.e. that the plot represents the integrated ratios IHCN/ICO as a function of . The monotonic falloff in the ratio with radius is simply a result of the confinement of the HCN emission to the inner = 150 pc, while the CO is distributed over a much larger radius (there is detectable emission at least to = 3.5 kpc, Tacconi & Young 1989). What is perhaps a more interesting quantity physically is the annular ratio measured as a function of radius; that is, if IHCN/ICO is measured as an average from pc, what is the value of IHCN/ICO from pc (where 800 pc is the radius of the NRAO beam in Helfer & Blitz 1993)? We can set an upper limit to IHCN/ICO in this annulus by comparing the BIMA data with the NRAO 12 m HCN flux. Since the BIMA measurement recovered of the single-dish HCN flux measured at the NRAO 12 m (Table 3), let us assume that 20% of the single-dish HCN flux is distributed at radii larger than the interferometer was able to measure, yet within the half power beam area of the the NRAO 12 m — that is, radii within the annulus pc. (This is a conservative estimate, since any “missing” large-scale flux could also contribute to the flux at the central position.) If we then measure the flux in the Regan & Vogel CO map from pc, we find that the ratio IHCN/ICO in this annulus is at most 0.01. This ratio is an order of magnitude lower than that measured over the central pc, as shown in Figure 6.
3.3 Nondetections
We did not detect HCN emission from NGC 4321 (M100), NGC 4527, or NGC 4569. While it is possible that the dense structure in these galaxies is so extended that the interferometer resolves out the single-dish HCN emission (for these sources, the flux of structures larger than 20″ is attenuated by 50%), it is also likely that the observations simply were not sensitive enough to detect the HCN from these sources. For those observations which suffered from an intermittent phase lock (see 2.1), the antenna that was flagged was one of the two that made up the shortest baseline pair; thus the calibration solution may not have been reliable and also the zero spacing problem may have been exacerbated for these observations.
4 Discussion
4.1 The Radial Dependence of Dense Gas Ratios
Spectroscopic studies of CS and HCN emission in normal external galaxies suggest that most spiral galaxies contain an appreciable amount of gas at densities of in their centers (Mauersberger et al. 1989; Sage, Solomon, & Shore 1990; Nguyen-Q-Rieu et al. 1992; Israel 1992; Helfer & Blitz 1993). The maps in Figure 1 show the distribution of that dense gas, namely, that it is confined to the central kiloparsec of the sources imaged. This situation appears to be very similar to that seen in the Milky Way, where widespread emission from the dense gas tracers CS (Bally et al. 1987) and HCN (Jackson et al. 1996) is found only within the central 500 pc diameter.
What does the distribution of dense gas tell us about the physical conditions in the molecular gas as a function of its location in a galaxy? To investigate the physical conditions rather than the total gas content, we normalize the HCN to that of the CO and consider the ratio . If the kinetic temperature of the gas responsible for the cospatial HCN and CO emissions is about the same, then may be considered as a qualitative indicator of the density or thermal pressure in the gas. (Indeed, since the J = 1 state lies only 5.5 K above the ground state for CO and 4.3 K above ground for HCN, even rather cold gas has the energy to populate the J = 1 state for both molecules. It is the molecular density that is more important in determining the excitation. See Helfer & Blitz 1996.) In NGC 6946 ( 3.2), is 0.11 0.01 averaged over the central pc, whereas we deduce an upper limit of averaged in the annulus pc, a region that includes the inner part of the disk. A similar radial dependence of is seen in the unusual Seyfert/starburst hybrid galaxy NGC 1068, where the ratio approaches 0.6 in the central = 175 pc (Helfer & Blitz 1995), and the ratio falls off monotonically to about 0.1 at the large reservoir of molecular gas at about 1 kiloparsec from the nucleus. In the Milky Way, the ratio is about 0.081333See note to Table 4. 0.004 averaged over the central pc (Jackson et al. 1996); between kpc in the plane of the Milky Way, the average ratio is 0.026 0.008, and in solar neighborhood GMCs, we measure ratios of 0.014 0.020 when averaged over 50 pc GMCs (Helfer 1995 – and these are upper limits to the ratio averaged over several hundred parsecs). These numbers are summarized in Table 4.
What seems apparent from these comparisons is that is a strong function of galactocentric radius – or more precisely, that there is at least a bimodal distribution in the ratio in normal galaxies: the ratio at the center is substantially higher than elsewhere in the galaxy. Even though local effects can dominate on scales of individual GMCs ( 3.2), the average ratio of dense gas emission is highest at a galaxy’s center and drops at larger distances from the center. Furthermore, the general agreement between the ratios in the central 500 pc of NGC 6946 and the Milky Way suggest that the physical conditions in the centers of the two galaxies are similar.
4.2 GMCs in the High Pressure Environments of Galactic Bulges
The measurement that the ratio is 5 to 10 times higher in the bulge regions of the Milky Way and NGC 6946 than in their disks suggests that the physical conditions of the molecular gas in the bulge and disk regions are very different. Furthermore, the presence of dense gas on size scales of 500 pc suggests that the internal pressure is very high in the molecular gas. Let us assume that the intrinsic line widths of the clouds are dominated by nonthermal, bulk motions as in local clouds, and that their intrinsic linewidths are 1 km s-1. Although we cannot model the density accurately with the observation of a single transition of HCN or CO, a simple LVG analysis of the line ratios suggests that a line ratio of = 0.11 implies densities of 104.2-5.2 cm-3 for gas at a kinetic temperature in the range TK = 15 – 70 K. These densities are consistent with what is measured in the Milky Way bulge molecular clouds, where n(H2) (Güsten 1989). If we take the gas densities in NGC 6946 to be , then the typical kinetic pressure throughout the molecular gas is cm-3 K.
Spergel & Blitz (1992) considered the effects of the extended, hot coronal gas in the bulge of the Milky Way on the thin molecular layer that is embedded within it, and they argued that the pressure in the center of the Galaxy is two to three orders of magnitude greater than that in the solar neighborhood. How does such an extraordinary difference in the environmental pressure affect the properties of molecular clouds? In disk GMCs, the external pressure of the ambient ISM ( K) is small compared with the pressure from the self-gravity of a cloud ( K), and a source of “local” pressure (i.e., ongoing or recent star formation) is required to support any localized high-density clumps within the cloud. In the high-pressure ( K, estimated for the Milky Way from the X-ray measurements of Yamauchi et al. 1990) environments of bulge molecular gas, on the other hand, the GMCs need not be self-gravitating – in fact, only the most massive clouds could have the Jeans masses required to be self-gravitating. In bulge clouds, then, it is the external pressure of the environment that dominates, and these high pressures can support the dense gas throughout the molecular component (regardless of whether there is any active star formation in the GMCs).
These arguments are easily extended to observations of external galaxies, which typically also have X-ray emission associated with their bulges (Fabbiano, Kim, & Trinchieri 1992). From our observations of HCN in the bulges of external galaxies, it appears that the physical conditions in molecular gas in the centers of galaxies are much more similar to each other than they are to local GMCs in the Milky Way.
4.3 Positional Offsets Between the Dense Gas and Radio Continuum Distributions
In the Milky Way, there is a pronounced offset of 80 pc in the position of the peak radio continuum emission (Sgr A*, ) and the centroid of the dense gas (traced by CS and HCN) distribution (). There is also evidence for an offset of 100 pc in NGC 1068 between the peaks of the HCN emission and the radio continuum emission (Helfer & Blitz 1995), and a kinematic analysis of the molecular gas suggests the existence of an mode (i.e. a dipole asymmetry in the mass distribution) in NGC 1068. Whether it is the radio continuum emission or the molecular gas that traces the center of the mass distribution, the dynamical timescale of the offsets is brief ( 106 years). If the offsets are indeed ephemeral, and not a steady-state condition of the galaxies, then it is appropriate to look for a source of the instability that causes them.
How common are such offsets between the peaks of the dense molecular gas distribution and the radio continuum emission in galaxies? We compared the positions of peak HCN emission with those of the peak radio continuum in our sample (Figure 1, Table 5). While three of the galaxies show a reasonable coincidence between the two positions, two of the five sources, NGC 4826 and M51, show significant offsets: in NGC 4826, the offset is or 74 pc; in M51, it is or 130 pc. (In M83, there is a or 40 pc offset, but because of the elongated beams and extended distribution in both HCN and the radio continuum, the peak positions are less certain.)
It appears that these offsets are a common feature in spiral galaxies. In this sample, two out of five detected galaxies have offsets; we have already mentioned the offsets in the Milky Way and in NGC 1068. In a recent study of the K-band morphology in 18 face-on spiral galaxies, Rix & Zaritsky (1995) found that about one third of the disks have significant modes at 2.5 disk exponential scale lengths.
It may be significant that the two galaxies in our sample that show offsets, NGC 4826 and M51, also share the characteristic that they have low-level nonstellar nuclear activity (both are LINERs; these are low-level active galactic nuclei, or AGN); the other three galaxies detected here (NGC 3628, M83, and NGC 6946) have low-level starburst activity instead (L. Ho, private communication). A recent study by Ho et al. (1993) suggests that up to 80% of the 500 brightest galaxies in the northern sky harbor some kind of activity in their nuclei; of these, about half are classified as LINERs, and half are starbursts. It is surprising both that most spiral galaxies appear to show some kind of nuclear activity and also that the activity seems to be roughly evenly divided between stellar and nonstellar mechanisms. The offsets of the dense gas from the peak of the radio continuum in NGC 4826 and M51, as well as that in NGC 1068 (a galaxy with a more energetic AGN, but similar conceptually to the LINERs) may help to distinguish empirically the kind of activity that dominates in a given galaxy’s nucleus.
5 Conclusions
We have presented the results of a survey of HCN emission from eight nearby spiral galaxies made with the BIMA interferometer. These observations comprise the first high-resolution survey of dense ( cm-3) gas from a sample of relatively normal galaxies, rather than galaxies with prolific starburst or nuclear activities.
We imaged five of the eight galaxies in HCN: NGC 3628, NGC 4826, NGC 5194 (M51), NGC 5236 (M83), and NGC 6946. To within the uncertainties, the interferometer recovers all of the single-dish flux measured for each source in a single pointing at the NRAO 12 m telescope (Helfer & Blitz 1993); this implies that there is not a significant contribution to the HCN fluxes from extended emission in the disks of the galaxies. In all the galaxies observed, the HCN emission is confined to the central kiloparsec of the sources.
We added zero-spacing data from the NRAO 12 m telescope to the BIMA CO map of NGC 6946 by Regan & Vogel (1995) in order to compare the ratio of HCN to CO intensities in this galaxy. The ratio ranges from 0.05–0.2 within the central pc; the average ratio over this region is . A comparison with single-dish observations allows us to place an upper limit of in the annulus pc in NGC 6946.
The extent of HCN emission in NGC 6946, pc, and the ratio in this region are similar to what is observed in the Milky Way ( pc, , Jackson et al. 1996); this suggests that the physical conditions in the centers of these two galaxies are similar. Furthermore, in NGC 6946, NGC 1068, and the Milky Way, the ratios at the centers are 5 to 10 times higher than those in the disks of these galaxies. This result is consistent with an enhancement of two to three orders of magnitude in the pressure of the bulges compared with the disks (Spergel & Blitz 1992). It appears that the physical regions in the centers of galaxies are much more like each other than the conditions in the center of a galaxy relative to its disk.
In NGC 4826 and M51, as in the Milky Way and in NGC 1068, there is a linear offset of 100 pc between the dense gas distribution and the peak of the radio continuum emission. These offsets appear to be a common feature in galaxies and may indicate that their disks are non-axisymmetric. It may be significant that of the five galaxies imaged in HCN, NGC 4826 and M51 are LINERs, whereas the other three are starbursts.
We did not detect HCN in three galaxies with positive single-dish HCN emission: NGC 4321 (M100), NGC 4527, and NGC 4569. It could be that the emission is extended enough in these sources that the interferometer resolved out any detectable emission; however, we cannot rule out the possibility that there was some intrinsic problem with the observations of these sources.
References
- (1) Adler, D.S., Lo, K.Y., Wright, M.C.H., Rydbeck, G., Plante, R.L., & Allen, R.J. 1992, ApJ, 392, 497
- (2) Bally, J., Stark, A.A., Wilson, R.W., & Henkel, C. 1987, ApJS, 65, 13
- (3) ———–. 1988, ApJ, 324, 223
- (4) Boissé, P., Casoli, F., & Combes, F. 1987, A&A, 173, 229
- (5) Braine, J. & Combes, F. 1992, A&A, 264, 433
- (6) Braun, R., Walterbos, R.A.M., & Kennicutt, R.C. 1992, Nature, 360, 442
- (7) Braun, R., Walterbos, R.A.M., Kennicutt, R.C., & Tacconi, L.J. 1994, ApJ, 420, 558
- (8) Casoli, F. & Gerin, M. 1993, A&A, 279, L41
- (9) Condon, J.J., Condon, M.A., Gisler, G., & Puschell, J.J. 1982, ApJ, 252, 102
- (10) Fabbiano, G., Kim, D.-W., & Trinchieri, G. 1992, ApJS, 80, 531
- (11) Gallais, P., Rouan, D., Lacombe, F., Tiphene, D., & Vauglin, I. 1991, A&A, 243, 309
- (12) Helfer, T.T. 1995, Ph.D. Thesis, U. Maryland
- (13) Helfer, T.T. & Blitz, L. 1993, ApJ, 419, 86
- (14) —————. 1995, ApJ, 450, 90
- (15) Ho, L.C., Filippenko, A.V., & Sargent, W.L.W. 1993, in IAU Symp. 159, Multi-Wavelength Continuum Emission of AGN, eds. A. Blecha & T.J.-L. Courvoisier (Dordrecht:Reidel), 275
- (16) Israel, F. P. 1992, A&A, 265, 487
- (17) Israel, F.P., Baas, F., Maloney, P.R. 1990, A&A, 237, 17
- (18) Jackson, J.M., Heyer, M.H., Paglione, T.A.D., & Bolatto, A.D. 1996, ApJ, 456, 91
- (19) Kohno, K., Kawabe, R., Tosaki, T., & Okumura, S.K. 1996, ApJ, in press
- (20) Lo, K.Y., Ball, R., Masson, C.R., Phillips, T.G., Scott, S., and Woody, D.P. 1987, ApJ, 317, L63
- (21) Mauersberger, R., Henkel, C., Wilson, T. L., & Harju, J. 1989, A&A, 226, L5
- (22) Nguyen-Q-Rieu, Jackson, J. M., Henkel, C., Truong-Bach, & Mauersberger, R. 1992, ApJ, 399, 521
- (23) Rand, R.J. & Kulkarni, S.R. 1990, ApJ, 349, L43
- (24) Regan, M., & Vogel, S.N. 1995, ApJ, 452, 21
- (25) Rix, H.-W. & Zaritsky, D. 1995, ApJ, 447, 82
- (26) Rubin, V.C. 1994, AJ, 107, 173
- (27) Sage, L. J., Shore, S. N., & Solomon, P. M. 1990, ApJ, 351, 422
- (28) Sandage, A. 1961, The Hubble Atlas of Galaxies (Washington: Carnegie Institute of Washington)
- (29) Sault, R.J., Teuben, P.J., & Wright, M.C.H. 1995, in Astronomical Data Analysis Software and Systems IV, eds. R.A. Shaw, H.E. Payne, & J.J.E. Hayes, A.S.P. Conference Series 77, 433
- (30) Spergel, D.N. & Blitz, L. 1992, Nature, 357, 665
- (31) Tacconi, L.J. & Young, J.S., 1989, ApJS, 71, 455
- (32) Turner, J.L. & Ho, P.T.P. 1983, ApJ, 268, L79
- (33) Turner, J.L. & Ho, P.T.P. 1994, ApJ, 421, 122
- (34) Welch, W.J., et al. 1996, PASP, 108, 93
- (35) Weliachew, L., Casoli, F., & Combes, F. 1988, A&A, 199, 29
- (36) Yamauchi, S., Kawada, M., Koyama, K., Kunieda, H., & Corbet, R.H.D. 1990, ApJ, 365, 532
- (37) Young, J.S., Tacconi, L.J., & Scoville, N.Z. 1983, ApJ, 269, 136
| Source | (J2000) | (J2000) | LSRaa LSR is defined by the radio convention, /c = /o, where o is the wavelength in the rest frame of the source. | |
|---|---|---|---|---|
| (Mpc) | (km s-1) | |||
| NGC 3628bb Pointing center is the optical center of NGC 3628. The radio continuum center is some 21″ to the SE of the optical center and is coincident with the HCN emission (see 3.1). | 11h20m16.s27 | 13°35′39.″0 | 9 | 847 |
| NGC 4321 (M100) | 12 22 54.80 | 15 49 23.0 | 17 | 1550 |
| NGC 4527 | 12 34 08.80 | 02 39 10.3 | 20 | 1734 |
| NGC 4569 | 12 36 50.02 | 13 09 53.1 | 17 | -235 |
| NGC 4826 | 12 56 44.25 | 21 40 52.3 | 5 | 408 |
| NGC 5194 (M51) | 13 29 53.30 | 47 11 50.0 | 10 | 463 |
| NGC 5236 (M83) | 13 37 00.23 | -29 52 04.5 | 5 | 516 |
| NGC 6946 | 20 34 51.91 | 60 09 11.9 | 5 | 52 |
| Source | Beam | K Jy-1 | momaamom is lower than the statistical noise in the integrated intensity (“moment”) maps because emission below the level of the statistical noise in the channel maps was masked out in order to calculate the moment maps (see text). |
|---|---|---|---|
| ( ) | (Jy bm-1 km s-1) | ||
| NGC 3628 | 4.7 4.1 | 8.13 | 2.0 |
| NGC 4321 (M100) | 8.2 6.5 | 2.91 | 2.1 |
| NGC 4527 | 13.5 10.7 | 1.07 | 3.6 |
| NGC 4569 | 5.5 4.2 | 6.85 | 1.0 |
| NGC 4826 | 10.5 8.0 | 1.87 | 3.2 |
| NGC 5194 (M51) | 7.9 6.5 | 3.03 | 1.5 |
| NGC 5236 (M83) | 12.5 4.1 | 3.03 | 3.6 |
| NGC 6946 | 5.9 5.0 | 5.31 | 1.7 |
| Source | IBIMAaa IBIMA from this study, corrected for primary beam effects from the BIMA interferometer and the NRAO 12 m telescope for comparison with IKP. | IKPbb IKP from Helfer & Blitz 1993, corrected to main beam brightness temperature scale. | Fractioncc Fraction recovered = (IBIMA K Jy-1 12/(71″)2) / IKP, where 1, 2, and K Jy-1 are listed in Table 2. |
|---|---|---|---|
| (Jy kms-1) | (K kms-1) | recovered | |
| NGC 3628 | 49.0 17.5 | 1.5 0.2 | 1.01 0.36 |
| NGC 4826 | 39.0 16.7 | 1.3 0.2 | 0.93 0.41 |
| NGC 5194 (M51) | 26.4 10.5 | 1.2 0.2 | 0.68 0.27 |
| NGC 5236 (M83) | 103 23 | 2.7 0.2 | 1.18 0.27 |
| NGC 6946 | 39.2 5.5 | 1.5 0.2 | 0.81 0.17 |
| Region | Milky Way | NGC 6946 | NGC 1068aaHelfer & Blitz 1995 |
|---|---|---|---|
| BulgebbMilky Way: r = 300 pc; NGC 6946: r = 150 pc; NGC 1068: r = 175 pc | 0.081ccJackson et al. 1995. We use their correction for HCN and CO emission at nonzero Galactic latitude. In their “aperture photometry”, Jackson et al. smooth their HCN map to a spatial resolution larger than that of their CO map by a factor of in order to emulate the single-dish measurements of extragalactic ratios. This correction is not appropriate for comparison with our interferometeric measurements, in which the HCN and CO maps have been smoothed to the same resolution. We therefore “re-correct” their ratio so that it is appropriate for direct comparison to these results. 0.004 | 0.11 0.01 | 0.6 |
| DiskddMilky Way: kpc; NGC 6946: pc; NGC 1068: kpc | 0.026eeHelfer 1995 0.008 | 0.01 | 0.1 |
| Local GMCs | 0.014 0.020eeHelfer 1995 | — | — |
| Source | |
|---|---|
| () | |
| NGC 3628 | -0.5, -0.1 |
| NGC 4826 | +2.2, -3.0 |
| NGC 5194 (M51) | -2.2, +1.3 |
| NGC 5236 (M83) | -1.3, -0.9 |
| NGC 6946 | -0.1, -0.5 |