Complex Mg II absorption in the outer disk of M611
Abstract
The increasing availability of high quality spectra of QSO absorption line systems at resolutions of only a few km s-1 is expected to facilitate the translation of the kinematics of components comprising the lines into the spatial distribution of gas around an absorbing galaxy. In this Letter, we present Hubble Space Telescope (HST) spectra of Q1219+047, a QSO whose sightline passes 21 kpc from the center of M61, through the outer regions of an extended H I disk. We detect complex Mg II absorption, spanning a velocity range of km s-1, and strong C IV absorption; these are the first UV observations of a QSO absorption line system arising in the outskirts of a disk of a nearby galaxy at low inclination. Our observations are at odds with models of galaxies in which absorbing clouds co-rotate with a galaxy’s disk, because M61’s low inclination should give rise to only a few Mg II components spread over a small velocity range in such a model. Hence our results throw doubt on whether absorption line profiles can be used to infer the spatial distribution of gas around absorbing galaxies.
1 Introduction
It has long been hoped that the distribution of subcomponents in QSO absorption line complexes would prove instrumental in understanding how gas is distributed around galaxies. For example, the asymmetric profiles of low ionization species observed with the Keck Telescope in high redshift damped Ly systems are interpreted as being due to the line of sight to the background QSO passing through a rotating disk (Wolfe 1995; Prochaska & Wolfe 1996), in keeping with the hypothesis that such systems are the early progenitors of late type galaxies. The direct detection of galaxies responsible for Mg II absorption systems at redshifts has provided an opportunity to examine whether the profiles of the absorption lines are related to the properties of the galaxies, particularly their distance from the QSO sightline (‘impact parameter’), their luminosity, or their inclination. From the small sample of absorbing galaxies surveyed by Bergeron & Boissé (1991), Lanzetta & Bowen (1992) used high-resolution (FWHM of km s-1) data of the Mg II lines to propose that the variation in strength of the sub-components with velocity was consistent with that expected for absorption by a rotating ensemble of clouds, and that the complexity should decrease with impact parameter. In their model, the important parameter determining the variation in the sub-structure along many different lines of sight is the inclination of the absorbing disk.
Unfortunately, the identification of a larger sample of absorbing galaxies (Steidel 1995; Steidel, Dickinson & Persson 1994) and high resolution spectra (Churchill, Steidel & Vogt 1996) has failed to confirm that the distribution of sub-components within a line depends on impact parameter. Observations of nearby galaxies also show that the characteristics of Mg II absorption lines depend on a wide variety of physical mechanisms (particularly whether the galaxy is interacting with neighbouring galaxies), and not simply on impact parameter or galaxy inclination (Bowen, Blades & Pettini 1995a, hereafter BBP). Moreover, in our own Galaxy, Ca II and Na I absorption lines observed toward distant stars or extragalactic sources, (which arise in high H I column densities and which should therefore trace the bulk of the disk gas) are more often found at velocities which are inconsistent with gas co-rotating with the disk when observed at high resolution (Morton & Blades 1986; Sembach, Danks & Savage 1993).
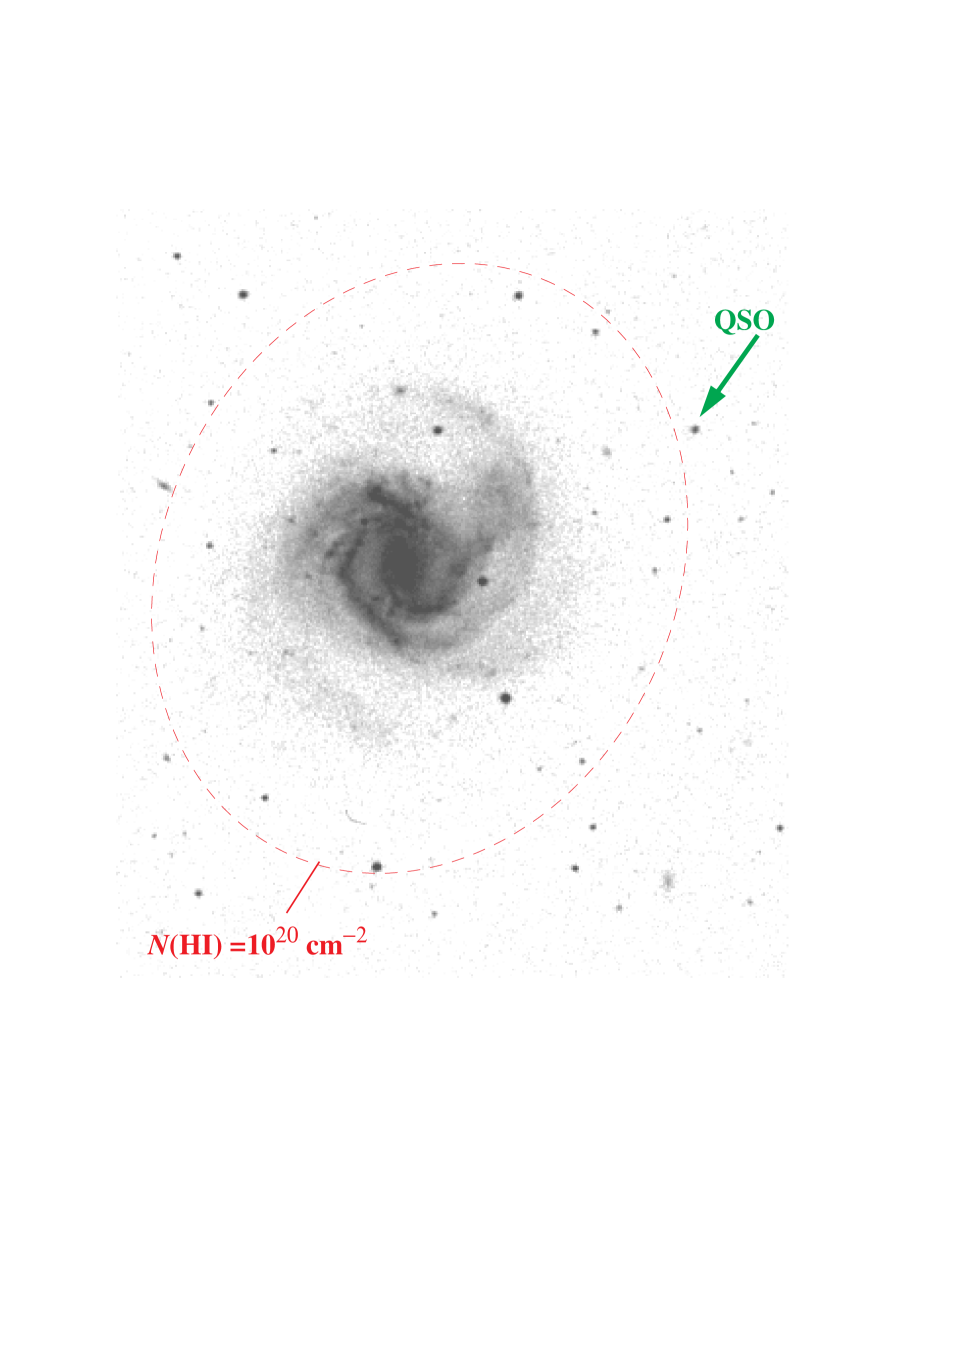
In this Letter, we present observations of Q1219+047, a QSO whose line of sight passes 4.67′ from the center of M61 ( NGC 4303 ; see Fig. 1), which corresponds to 21.1 kpc at the galaxy’s velocity of 1569 km s-1. M61 is a grand-design spiral [of type SAB(rs)bc] located near the outer edge of the Virgo Cluster at a projected distance of 8.2 degrees from M87. It shows little H I deficiency (Giovanelli & Haynes 1985) but may have a high star formation rate (Kennicutt 1983). M61 is a galaxy at low inclination (), and the QSO sightline intercepts the disk at a distance of 1.5 times the optical radius (measured to a surface brightness of 25 mag arcsec-2). With the spectra presented in this paper, we test explicitly whether the absorbing gas in the outer regions of a normal spiral galaxy follows the velocity field of the bulk of the disk gas. If it does, we would expect absorption lines to have a simple structure because of the galaxy’s low inclination, causing the line of sight velocity component to be small. In fact, we find that the Mg II absorption along the line of sight is clearly complex and contains components spanning a total velocity range of nearly 300 km s-1.
2 Observations and Results
Q1219+047 was observed with the Faint Object Spectrograph (FOS) and 1.0 arcsec circular aperture (B-3) using the G130H and G270H gratings. The QSO () has a -band magnitude of 16.8, and was observed for 34.0 mins with the G270H and 38.3 mins with the G130H. The spectra were calibrated using standard pipeline software. To obtain a more exact zero point for the wavelength calibration of the G270H data, we compared the velocity of five strong Fe II absorption lines from Milky Way gas in the QSO spectra, with H I emission along the QSO line of sight taken from the Leiden/Dwingeloo 21 cm H I survey (Hartmann 1994). A shift of Å ( km s-1) was required to match the velocities. The G130H spectrum was of too low a signal to noise to measure accurately the wavelengths of Milky Way absorption lines and improve its calibration.
Both G130H and G270H spectra are presented in full, along with complete line identifications, in a forthcoming paper. Plots of the normalised spectra around the position of Mg II and C IV are shown in Figure 2. The signal-to-noise of these data are 4 and 13 per pixel for the G130H and G270H gratings, respectively. The figure marks the rest wavelengths of absorption expected from our own Galaxy, as well as the wavelengths of absorption expected at the systemic velocity of M61. Strong Mg II is detected from both the Milky Way and from M61: the equivalent widths, , of the lines observed from M61 are (Mg II) Å, (Mg II) Å, (C IV) Å, and (C IV) Å. From our own galaxy, we find local absorption at strengths of (Mg II) Å, and (Mg II) Å. In the lower signal-to-noise G130 spectrum, C IV is absent from Milky Way gas.
A 21 cm H I map of M61 has been constructed by Cayatte et al. (1990). The sightline to Q1219+047 passes just beyond the last H I column density contour of cm-2, which we indicate by the dashed ellipse in Fig. 1. This value is approximately 11/8 th times the column density we would expect to see from our own galaxy observed face-on (e.g. Elvis, Lockman & Wilkes 1989; Diplas & Savage 1994), but since the Mg II absorption from the Milky Way is already saturated (e.g. Bowen, Blades & Pettini 1995b), we would predict that the absorption from M61 would be of similar strength to Galactic absorption. The fact that it is stronger means that the velocity spread of components comprising the line is larger than that seen locally. In particular, as can be seen in Fig. 2, components of the Mg II are clearly resolved blueward of the bulk of the absorption. Since the FOS has a resolution of km s-1 FWHM for point sources at this wavelength the Mg II line must be composed of components which span at least this velocity range. To illustrate this point, Fig. 2 shows theoretical absorption line Voigt profiles convolved with the Line Spread Function (LSF) of the FOS, assuming that the LSF is gaussian and 0.96 diodes FWHM. We have chosen column densities, , and Doppler parameters, , such that the instrumental LSF dominates the shape of the profile ( km s-1). The dotted line shows the shape of the profile for a single absorbing cloud, equivalent to many smaller clouds (with similar values) spread over a velocity range less than the FWHM of the LSF. The excess absorption in the blue wing of both Mg II lines can be clearly seen. To estimate the velocity range over which this excess absorption extends, we have simply fit a second single cloud to the excess absorption. We find that additional absorption is required at velocities km s-1 different from the bulk of the absorption.
Unfortunately, the G130H spectra is of too low a signal-to-noise to reveal any excess absorption in the C IV absorption lines from M61. Nevertheless, it is clearly strong compared to Milky Way absorption which is not detected. Unlike Mg II, C IV absorption lines in our own halo are not saturated, and the strong lines seen in M61 probably reflect a significantly larger column density than that detected locally. Considering that the H I column density is lower along the line of sight, this suggests that some portion of the gas in the disk and/or halo of M61 is more highly ionized than it is in the Milky Way. Discerning whether this highly ionized gas is found over the same velocity range as the Mg II lines, or whether it arises exclusively in the same components marked by the excess Mg II absorption at km s-1 blueward of the bulk of the absorption, will require higher signal-to-noise data.
3 Discussion
Since M61 is at low inclination, we would expect any velocity component from absorbing gas along our line of sight originating from the disk of the galaxy to be small. However, the Mg II absorption is clearly complex and spans a velocity range km s-1. This is larger than the range of velocities seen from the H I gas observed across the entire galaxy ( km s-1); hence the complexity of the absorption cannot be related to the inclination of M61’s disk to the line of sight.
The bulk of the Mg II absorption occurs at km s-1, close to the systemic velocity of the galaxy (1569 km s-1). However, the velocity of the H I gas seen in 21 cm emission near the sightline is km s-1, some 80 km s-1 higher than the Mg II absorption. As noted in §2, we have attempted to zero-point the wavelength calibration of the spectrum as accurately as possible. 80 km s-1 corresponds to a shift of only 1.5 pixels, so we cannot be sure that the measurement of the bulk of the absorption is in error by a similar amount. H I gas is detected at 21 cm from column densities which can be several dex larger than those in which the Mg II occurs (Mg II absorption lines of the strength detected here arise in gas which is optically thick at the Lyman Limit, i.e., (H I) cm-2); hence Mg II absorption lines will arise from the same H I detected at 21 cm, but could, in addition, arise from gas which remains undetected at 21 cm. Thus the observed Mg II absorption does not have to be centered at the same velocity as the H I. Whether the difference in velocity is real, or due to wavelength calibration errors, will require further observations, but the uncertainty in the absolute velocity of the absorption does not affect the relative velocity difference between the excess absorption and the main body of the Mg II line.
The large velocity range over which Mg II absorption is observed suggests that the distribution of sub-components comprising the absorption complex cannot be related to the velocity field of the disk of M61. Asymmetric profiles similar in shape to that observed in M61 are predicted for highly inclined disks (Lanzetta & Bowen 1992), not for galaxies at low inclination. Our observations therefore show that the shape of absorption line profiles seen in higher-redshift absorption systems need not have anything to do with rotating ensembles of gas clouds in inclined galaxy disks.
The complicated absorption could be evidence of the two component model for Mg II absorption, in which Mg II absorption arises in both high (H I) disk gas, and lower (H I) halo gas (Briggs & Wolfe 1983). The bulk of the Mg II absorption would be expected to arise in the disk of the galaxy in this model, and the fact that it does not appear to be close to the velocity of the H I gas in the disk measured from 21 cm emission is hard to understand. Nevertheless, as we have noted, the absolute wavelength scale of the FOS spectrum may be in error. Even disregarding this observation, the relative velocity difference of km s-1 between disk and halo gas is just as hard to interpret. If the halo were completely at rest with respect to the disk of the galaxy, the difference in velocity between halo and disk gas along the line of sight should be no more than the maximum amplitude of the galaxy’s rotation curve. Again, the 21 cm maps of M61 show that this value should be km s-1. Hence we believe that a simple two component disk-halo model of the absorbing gas may not be adequate to describe the observed absorption.
It is also possible that the complex absorption has nothing to do with gas intrinsic to M61, but is the superposition of absorption lines from the overlapping halos of nearby galaxies. There are two nearby galaxies, NGC 4292 and NGC 4303A, 7.58′ and 12.66′ away from the QSO sightline, respectively. The velocity of NGC 4292 is km s-1, 690 km s-1 higher than M61, which puts it km s-1 away from the velocity of the excess absorption seen in the QSO spectrum. For this reason alone, it seems unlikely that NGC 4292 contributes to the absorption complex, as there is no evidence for such large motions in the halos of normal galaxies. NGC 4303A is closer in velocity to M61, km s-1, a difference of km s-1 between the galaxy and M61, almost the same as that detected in the QSO spectrum. In this model where single galaxies are surrounded by spherical halos, the radius of the absorbing cross-section, , is related to the galaxy’s luminosity, , by (Steidel 1995), at least for galaxies at redshifts . In Table 1 we list the separation of the galaxies from the QSO line of sight, , and the value of (for ). For NGC 4292 & NGC 4303A, , that is, the predicted radii of the spherical Mg II halos simply do not extend far enough to intercept the QSO line of sight. It therefore seems unlikely that the complex absorption arises from the overlapping halos of neighbouring galaxies.
If the complex absorption seen toward M61 does not arise from systematic—as opposed to random—gas motions within a galaxy, what else might cause the complex absorption? The large velocity range which the absorption covers is most reminiscent of absorption from the High Velocity Clouds (HVCs) seen in our Galaxy (Savage et al. 1993; Bowen, Blades & Pettini 1995b; Sembach et al. 1995 and refs therein). The problem in relating Galactic HVCs to the more general phenomenon of QSO absorption lines is that their origin is still unresolved. There is evidence of HVCs in some external galaxies, such as M101 and NGC 628 (van der Hulst & Sancisi 1988; Kamphuis 1993), which are both galaxies with small inclinations and which show H I complexes with sizes of several kpc. In both cases, the difference in velocity between the HVC complexes and the systemic velocity of the galaxy are only of order 100 km s-1, less than the 300 km s-1 found for the Mg II complex in M61. As noted above though, the HVCs and the Mg II lines arise in H I column densities which can differ by several dex, and they may therefore have completely different velocity structures.
One of the explanations for the origins of some of the Milky Way HVCs is that they are the result of interactions between the Galaxy and neighbouring satellites. Since M61 has the two close neighbours discussed above, it is possible that such interactions may have influenced the distribution of H I in the galaxy, both spatially and kinematically. There is no evidence for the more severe distributions which lead to large, extended tidal tails spread well away from the center of a galaxy, and which can certainly lead to the observations of complex metal line absorption (BBP, Bowen et al. 1994), although the high rate of supernovae and the high density of H II regions (Hodge & Kennicutt 1983) seen in M61 could have been triggered by such interactions.
The effects of galaxy-galaxy interactions on the properties of QSO absorption line systems have been largely ignored, partly because there are too few of the ‘classic’ interacting systems seen at the present epoch to account for the number of systems detected at higher-redshift, but also because it is difficult to generalize what the effects of interactions would be on the observed absorption systems. In the case of M61, the effect is even more subtle, if complex Mg II absorption has been induced from very mild galaxy-galaxy interactions which do not show up in any other obvious way. If the interaction rate between galaxies has been higher in the past, as is being inferred from HST images of the distant universe (Abraham et al. 1996; van den Bergh et al. 1996) then the effects of interactions on even apparently normal galaxies should be evident in the characteristics of the absorption lines which arise from gas associated with those galaxies.
Whether the complex absorption seen in the disk of M61 arises because of isolated HVCs in the galaxies, from weak galaxy-galaxy interactions, or simply from normal interstellar processes, the line profiles indicate that it may not be so easy to translate the kinematic structure of high resolution absorption line profiles to the spatial structure of interstellar gas in absorbing galaxies. Future observations with HST and STIS (particularly of the higher ionization lines) will enable us to confirm our result and probe the kinematics of M61’s disk in more detail.
We thank Dap Hartmann for providing H I spectra from the Dwingeloo/Leiden 21 cm survey to help calibrate the FOS data. DVB and JCB acknowledge financial support from HST grant GO-5451.
| Galaxy | (km s-1) | ( kpc) | ( kpc) | ||
|---|---|---|---|---|---|
| M61 | 1641 | 21 | 45 | 0.5 | |
| NGC 4292 | 2258 | 49 | 30 | 1.6 | |
| NGC 4303A | 1273 | 47 | 23 | 2.0 |
References
- (1) Abraham, R. G., Tanvir, N. R., Santiago, B. X., Ellis, R. S., Glazebrook, K., & van den Bergh, S. 1996, MNRAS, 279, L47
- (2) Bergeron, J., & Boissé, P. 1991, A&A, 243, 344
- (3) Bowen, D. V., Roth, K. C., Blades, J. C., & Meyer, D. M. 1994, ApJL, 420, 71
- (4) Bowen, D. V., Blades, J. C., & Pettini, M., 1995a, ApJ, 448, 634 (BBP)
- (5) Bowen, D. V., Blades, J. C., & Pettini, M., 1995b, ApJ, 448, 662
- (6) Briggs, F. H., & Wolfe, A. M. 1983, ApJ, 268, 76
- (7) Cayatte, V., van Gorkom, J. H., Balkowski, C., & Kotanyi, C. 1990, AJ, 100, 604
- (8) Churchill, C. W., Steidel, C. C., & Vogt, S. S., ApJ, in press
- (9) Diplas, A., & Savage, B. D. 1994, ApJ, 427, 274
- (10) Elvis, M., Lockman, F. J., & Wilkes, B. J. 1989, AJ, 97, 777
- (11) Giovanelli, R., & Haynes, M. P. 1985, ApJ, 292, 404
- (12) Hartmann, D., 1994, The Leiden/Dwingeloo Survey of Galactic Neutral Hydrogen, Ph.D. Thesis, University of Leiden
- (13) Hodge, P. W., & Kennicutt, R. C., 1983, AJ, 88, 296
- (14) Kamphuis, J. 1993, PhD thesis, Gronigen
- (15) Kennicutt, R. C. 1983, ApJ, 272, 54
- (16) Lanzetta, K. M., & Bowen, D. V. 1992, ApJ, 391, 48
- (17) Morton, D. C., & Blades, J. C. 1986, MNRAS, 220, 927
- (18) Prochaska, J. X., & Wolfe, A. M. 1996, preprint.
- (19) Savage, B. D., et al. 1993, ApJ, 413, 116
- (20) Sembach, K. R., Danks, A. C., & Savage, B. D. 1993, A&AS, 100, 107
- (21) Sembach, K. R., Savage, B. D., Lu, L., & Murphy, E. M. 1995, ApJ, 451, 616
- (22) Steidel, C. C. 1995, in Quasar Absorption Lines, ed. G. Meylan (Springer-Verlag), p139
- (23) Steidel, C. C., Dickinson, M., & Persson, S. E. 1994, ApJ, L75
- (24) van den Bergh, S., Abraham, R. G., Ellis, R. S., Tanvir, N. R., Santiago, B. X., & Glazebrook, K. 1996, AJ, 112, 359
- (25) van der Hulst, J. M., & Sancisi, R. 1988, 95, 1354
- (26) Wolfe, A. M. 1995, in Quasar Absorption Lines, ed. G. Meylan (Springer-Verlag), p13
- (27)
Image of M61 (NGC 4303) reproduced from the STScI Digitised Sky Survey. The position of the QSO is marked. The sightline passes just beyond the last H I contour plotted by Cayatte et al. (1990), and represented here by a dashed ellipse.
Portions of the normalised FOS spectra of Q1219+047 around the wavelength region expected for Mg II (upper panel) and C IV (lower panel) absorption from M61. Unresolved Mg II absorption lines are seen from our own Milky Way, but the Mg II detected from M61 is clearly resolved and contains an asymmetric blue wing. Theoretical line profiles are shown to illustrate the LSF of the FOS (dotted line) and the extra component 290 km s-1 to the blue. Strong C IV absorption is also detected in M61, whereas C IV from our own Galaxy is absent.