Interpretation of UV Absorption Lines in SN1006111 Based on observations made with the NASA/ESA Hubble Space Telescope, obtained at the Space Telescope Science Institute, which is operated by the Association of Universities for Research in Astronomy, Inc., under NASA contract NAS 5-26555.
Abstract
We present a theoretical interpretation of the broad silicon and iron ultraviolet absorption features observed with the Hubble Space Telescope in the spectrum of the Schweizer-Middleditch star behind the remnant of Supernova 1006. These features are caused by supernova ejecta in SN1006. We propose that the redshifted Si 2 1260 Å feature consists of both unshocked and shocked Si 2. The sharp red edge of the line at indicates the position of the reverse shock, while its Gaussian blue edge reveals shocked Si with a mean velocity of and a dispersion of , implying a reverse shock velocity of . The measured velocities satisfy the energy jump condition for a strong shock, provided that all the shock energy goes into ions, with little or no collisionless heating of electrons. The line profiles of the Si 3 and Si 4 absorption features indicate that they arise mostly from shocked Si. The total mass of shocked and unshocked Si inferred from the Si 2, Si 3 and Si 4 profiles is on the assumption of spherical symmetry. Unshocked Si extends upwards from . Although there appears to be some Fe mixed with the Si at lower velocities , the absence of Fe 2 absorption with the same profile as the shocked Si 2 suggests little Fe mixed with Si at higher (before being shocked) velocities. The column density of shocked Si 2 is close to that expected for Si 2 undergoing steady state collisional ionization behind the reverse shock, provided that the electron to Si 2 ratio is low, from which we infer that most of the shocked Si is likely to be of a fairly high degree of purity, unmixed with other elements. We propose that the ambient interstellar density on the far side of SN1006 is anomalously low compared to the density around the rest of the remnant. This would simultaneously explain the high velocity of the redshifted Si absorption, the absence of blueshifted Si absorption, and the low density of the absorbing Si compared to the high Si density required to produce the observed Si x-ray line emission. We have reanalyzed the Fe 2 absorption lines, concluding that the earlier evidence for high velocity blueshifted Fe 2 extending to is not compelling. We interpret the blue edge on the Fe 2 profiles at as the position of the reverse shock on the near side of SN1006. The mass of Fe 2 inferred from the red edge of the Fe 2 profile is up to , if spherical symmetry is assumed. The low ionization state of unshocked Si inferred from our analysis of the silicon features, Si 2/Si , suggests a correspondingly low ionization state of unshocked iron, with Fe 2/Fe = . If this is correct, then the total mass of Fe up to is with a upper limit of . Such a low ionization state and mass of iron is consistent with the recent observation of Fe 3 1123 Å with HUT, indicating Fe 3/Fe 2 , but conflicts with the expected presence of several tenths of a solar mass of iron in this suspected Type Ia remnant. However, the inference from the present HST data is too indirect, and the HUT data are too noisy, to rule out a large mass of iron. Re-observation of the Fe 3 1123 Å line at higher signal to noise ratio with FUSE will be important in determining the degree of ionization and hence mass of iron in SN1006.
keywords:
ISM: individual (SN1006) — ISM: supernova remnants — ultraviolet: ISMSubmitted to The Astrophysical Journal June 1996 \leftheadHamilton et al. \rightheadUV Lines in SN 1006
and
Submitted to The Astrophysical Journal June 1996
1 Introduction
In two previous papers, we (Wu et al. 1993, 1996, hereafter WCFHS93, WCHFLS96) described HST FOS observations of the UV spectrum of the SM star (Schweizer & Middleditch 1980) which lies behind and close to the projected center of the remnant of SN1006. In the present paper we offer a theoretical interpretation of the broad silicon and iron UV absorption features observed with HST. These features are almost certainly caused by supernova ejecta in SN1006, as originally proposed by Wu et al. (1983), who first observed the features with IUE.
Detailed theoretical analysis of the Fe 2 features observed with IUE has been presented previously by Hamilton & Fesen (1988, hereafter HF88). The main purpose of that paper was to try to explain the apparent conflict between the low mass of Fe 2 inferred from the IUE observations of SN1006 (Fesen et al. 1988) with the expected presence of several tenths of a solar mass of iron (Höflich & Khokhlov 1996) in this suspected Type Ia remnant (Minkowski 1966; Schaefer 1996). HF88 demonstrated that ambient UV starlight and UV and x-ray emission from reverse-shocked ejecta could photoionize unshocked iron mainly to Fe 3, Fe 4, and Fe 5, resolving the conflict.
Recently Blair, Long & Raymond (1996) used the Hopkins Ultraviolet Telescope (HUT) to measure Fe 3 1123 Å absorption in the spectrum of the SM star. They found Fe 3/Fe 2 , which neither confirms, nor excludes, the ratio Fe 3/Fe 2 predicted by HF88.
The HST spectra, particularly the silicon features, prove to be a rich source of information beyond the reach of IUE’s capabilities. In the first half of this paper, Section 2, we analyze the Si absorption features. We find (§2.1) that the profile of the redshifted Si 2 1260 Å feature, with its sharp red edge and Gaussian blue edge, appears to be attributable to the presence of both unshocked and shocked silicon. We then develop a chain of inferences, first about the reverse shock (§2.2) and collisionless heating (§2.3), then about the column density and mass (§§2.4, 2.7), purity (§2.5), and ionization state (§2.6) of the silicon. We argue (§2.8) that the ambient interstellar density on the far of SN1006 is anomalously low compared to density around the rest of the remnant, which explains the high velocity of the redshifted Si, the absence of corresponding blueshifted Si (§2.9), and some other observational puzzles.
In the second half of the paper, Section 3, we discuss the broad Fe 2 absorption features. WCFHS93 reported blueshifted Fe 2 absorption up to . Finding the presence of such high velocity blueshifted absorption difficult to understand in the light of other observational evidence, we detail a reanalysis of the Fe 2 features in §3.1. We conclude (§3.2) that the evidence for high velocity blueshifted absorption is not compelling, and we propose (§3.3) that the sharp blue edge on the Fe 2 profiles at represents the position of the reverse shock on the near side. In the remainder of the Section, §§3.4-3.6, we address the issue of the ionization state and mass of the iron.
2 Silicon
There are three possibilities for the origin of the broad Si absorption features in the spectrum of the SM star, if it is accepted that these features arise from the remnant of SN1006.
The first possibility is that the absorption arises from cool, dense, fast moving knots of ejecta, as suggested by Fesen et al. (1988) and further discussed by Fesen & Hamilton (1988). However, there has been no significant change in the features over 12 years, from the original detection of the features with IUE in 1982 (Wu et al. 1983), through their re-observation with IUE in 1986 and 1988 (Fesen & Hamilton 1988), up to the FOS observation with HST in 1994 (WCHFLS96). Furthermore, the relative strengths of the redshifted Si 2 1260 Å, 1304 Å, and 1527 Å features are approximately proportional to their oscillator strengths times wavelengths, indicating that the lines are not saturated. This constancy in time and lack of saturation argues against the absorption features being caused by small, dense knots. We do not consider this hypothesis further in this paper.
A second possibility is that the Si absorption is from shocked ejecta in which the collisional ionization timescale is so long that the observed low ionization species Si 2, Si 3, and Si 4 can survive. At first sight, the high velocity of the observed absorption makes this possibility seem unlikely, because shocked ejecta should be moving no faster than the velocity of gas behind the interstellar shock, which in the NW sector of the remnant can be inferred from the FWHM of the Balmer broad line emission to be - (this is of the shock velocity), depending on the extent to which electron-ion equilibration takes place (Kirshner, Winkler & Chevalier 1987; Long, Blair & van den Bergh 1988; Smith et al. 1991; Raymond, Blair & Long 1995). However, below we will conclude that it is likely that much, in fact most, of the Si absorption is from shocked ejecta, and that the ISM surrounding SN1006 may be quite inhomogeneous.
A third possibility is that the Si absorption arises from unshocked supernova ejecta freely expanding in SN1006, which is consistent with the high velocity of the absorption. The low ionization state of the Si, predominantly Si 2, with some Si 3 and Si 4, is at least qualitatively consistent with the expectations of models in which the unshocked ejecta are photoionized by ambient UV starlight and by UV and x-ray emission from shocked ejecta (HF88). Neutral Si is neither observed, e.g. at Si 1 1845 Å, nor expected, since it should be quickly () photoionized by ambient UV starlight. Recombination is negligible at the low densities here. At the outset therefore, this possibility seems most likely, and we pursue the idea further in the next subsection.
Fesen et al. (1988) pointed out that the redshifted Si 2 1260 Å feature (at Å) in the IUE data appeared to be somewhat too strong compared to the weaker redshifted Si 2 1527 Å feature. The discrepancy appears to be confirmed by the HST observations (WCHFLS96). Fesen et al. proposed that some of the Si 2 1260 Å feature may come from S 2 1260, 1254, 1251 Å redshifted by relative to the Si 2, a possibility also addressed by WCHFLS96. In the present paper we regard the possibility of any significant contribution from S 2 as unlikely, notwithstanding the discrepancy between the Si 2 profiles. The oscillator strengths of the S 2 1260, 1254, 1251 Å lines are , 0.01088, 0.005453, whose combined strength is only 1/30 of the oscillator strength of the Si 2 1260 Å line (Morton 1991). In models of Type Ia supernovae, such as SN1006 is believed to be, silicon and sulfur occur typically in the same region of space, with a relative abundance of (e.g. Nomoto, Thielemann & Yokoi 1984). Thus S 2 might be expected to contribute only of the optical depth of Si 2 in the 1260 Å feature, assuming a similar ionization state of Si and S. In the remainder of this paper we ignore any possible contribution of S 2 to the Si 2 1260 Å feature. In this we follow Wu et al.’s (1983) original identification of the 1280 Å absorption feature as redshifted Si.
2.1 The redshifted Si 2 1260 Å feature

| Parameter | Value |
|---|---|
| Expansion velocity into reverse shock | |
| Mean velocity of shocked Si 2 | |
| Dispersion of shocked Si 2 | |
| Reverse shock velocity | |
| Lower edge of unshocked Si 2 | |
| Preshock density of Si 2 | |
| Column density of shocked Si 2 | |
| Column density of unshocked Si 2 | |
| Column density of all Si 2 | |
| Mass of shocked Si 2 | |
| Mass of unshocked Si 2 |
Given that SN1006 shows a well-developed interstellar blast wave in both radio (Reynolds & Gilmore 1986, 1993) and x-rays (Koyama et al. 1995; Willingale et al. 1996), it is inevitable that a reverse shock must be propagating into any unshocked ejecta.
If the observed UV Si absorption is from unshocked ejecta, then there should be a sharp cutoff in the line profile at the expansion velocity of the reverse shock, because the shock should ‘instantaneously’ decelerate the ejecta to lower bulk velocity. In fact the Si 2 1260 Å feature does show a steep red edge at , albeit with a possible tail to higher velocities. Tentatively, we take the presence of the steep red edge as evidence that at least some of the Si 2 is unshocked.
Once shocked, how long will Si 2 last before being collisionally ionized to higher levels? The ionization timescale of Si 2 entering the reverse shock can be inferred from the optical depth of the Si 2 1260 Å absorption just inside its steep red edge at , which putatively represents the position of the reverse shock. In freely expanding ejecta where radius equals velocity times age, , the column density per unit velocity of any species is equal to the density times age . For freely expanding ejecta, the optical depth in a line of wavelength and oscillator strength is then proportional to :
| (1) |
The optical depth of the Si 2 1260.4221 Å line (, Morton 1991) just inside its steep red edge is . This implies, from equation (1), a preshock Si 2 density times age of . The postshock Si 2 density times age would then be 4 times higher for a strong shock, . At a collisional ionization rate for Si 2 of (Lennon et al. 1988; see subsection 2.5 below for further discussion of this rate), the ratio of the Si 2 ionization timescale to the age of the remnant, , is (the following estimate is revised below, equation [3])
| (2) |
Since the ratio of electron to Si 2 density in the postshock gas should be greater than but of order unity, this estimate (2) indicates that the collisional timescale of Si 2 is of the order of the age of the remnant. It follows that shocked Si 2 is likely also to contribute to the observed Si 2 absorption.
Shocked Si 2 will be decelerated by the reverse shock to lower velocities than the freely expanding unshocked ejecta. Shocked Si 2 should have a broad thermal profile, unlike the unshocked Si 2. Examining the redshifted Si 2 1260 Å profile, we see that the blue edge extends down to about , with a shape which looks Gaussian. Fitting the blue edge to a Gaussian, we find a best fit to a Gaussian centered at , with a dispersion (standard deviation) of . This fit is shown in Figure 1. Having started from the point of view that the Si 2 was likely to be unshocked, we were surprised to see that, according to the fit, it is shocked Si 2 which causes most of the absorption, although an appreciable quantity of unshocked Si is also present, at velocities extending upwards from . The slight tail of Si 2 absorption to high velocities is naturally produced by the tail of the Gaussian profile of the shocked Si 2.
The estimate (2) of the collisional ionization timescale of Si 2 presumed that all the Si 2 1260 Å absorption was from unshocked Si 2, whereas the picture now is that only some of the absorption is from unshocked Si 2. According to the fit in Figure 1, the optical depth of unshocked Si 2 at the reverse shock front is , a little over half that adopted in estimate (2), so a revised estimate of the ionization timescale of Si 2 is not quite double that of the original estimate (2):
| (3) |
Evidently the conclusion remains that the ionization timescale of Si 2 is comparable to the age of the remnant.
2.2 Shock jump conditions
The fitted profile of the Si 2 1260 Å feature in Figure 1 includes both unshocked and shocked components. The consistency of the fitted parameters can be checked against the jump conditions for a strong shock. The shock jump conditions predict that the three-dimensional velocity dispersion of the ions should be related to the deceleration of the shocked gas by energy conservation
| (4) |
provided that all the shock energy goes into ions. The observed dispersion is
| (5) |
while the observed deceleration is
| (6) | |||||
These agree remarkably well, encouraging us to believe that this interpretation is along the right lines. The reverse shock velocity, , corresponding to the observed dispersion is
| (7) |
We prefer to infer the shock velocity from the observed dispersion rather than from the observed deceleration , since the latter may underestimate the true deceleration, if, as is likely, the shocked Si is moving on average slightly faster than the immediate postshock gas (see below).
The predicted equality (4) between the deceleration and ion dispersion holds provided that all the shock energy goes into ions, and that the bulk velocity and dispersion of the ions in the shocked gas are equal to their postshock values. Since the shocked Si 2 can last for a time comparable to the age of the remnant (equation [3]), it cannot be assumed automatically that the bulk velocity and dispersion of the observed Si 2 ions are necessarily equal to those immediately behind the reverse shock front. We discuss first the issue of the bulk velocity, then the dispersion, and finally the question of collisionless heating in subsection 2.3.
Consider first the bulk velocity of the shocked ions. In realistic hydrodynamic models, the velocity of shocked gas increases outward from the reverse shock. Indeed, the fact that the observed dispersion is larger than the observed deceleration by (the uncertainty here takes into account the correlation between the uncertainties in and ) is consistent with the notion that the shocked Si 2 is moving on average faster than the immediate postshock gas. This modest velocity is consistent with expectations from one-dimensional hydrodynamic simulations appropriate to SN1006 (see HF88, Fig. 2), according to which shocked ejecta remain relatively close to the reverse shock front. However, the deceleration of ejecta is generally Rayleigh-Taylor unstable (e.g. Chevalier, Blondin & Emmering 1992), which instabilities could have caused shocked Si 2 to appear at velocities many hundred faster than the immediate postshock gas. Since the observations do not show this, it suggests, though by no means proves, either that Rayleigh-Taylor instabilities are not very important, or perhaps that the line of sight through SN1006 to the SM star happens to lie between Rayleigh-Taylor plumes.
What about the ion dispersion? If there were a range of ion dispersions in the shocked gas, then the line profile would tend to be more peaked and have broader wings than a simple Gaussian. The observed profile of the blue edge of the redshifted Si 2 1260 Å feature is consistent with a Gaussian, which suggests, again weakly, that the ion dispersion does not vary by a large factor over the bulk of the shocked Si 2.
While the observations agree well with the simplest possible interpretation, it is certainly possible to arrange situations in which a combination of Rayleigh-Taylor instabilities, spatially varying ion dispersion, and collisionless heating conspire to produce fortuitous agreement of the observations with the jump condition (4).
2.3 Collisionless heating
The shock jump condition (4) is valid provided that all the shock energy goes into the ions, rather than into electrons, magnetic fields, or relativistic particles. The timescale for equilibration by Coulomb collisions between electrons and ions or between ions and ions is much longer than the age of SN1006. However, collisionless processes in the shock may also transfer energy, and the extent to which these may accomplish equilibration remains uncertain (see Laming et al. 1996 for a recent review). The prevailing weight of evidence favors little if any collisionless heating of electrons in the fast shocks in SN1006. Raymond et al. (1995) find similar velocity widths in emission lines of H 1 (Ly ), He 2, C 4, N 5, and O 6 observed by HUT from the interstellar shock along the NW sector of SN1006. They conclude that there has been little equilibration between ions, though this does not rule out substantial electron heating. From the same data, Laming et al. (1996) argue that the ratio of C 4 (which is excited mainly by protons) to He 2 (which is excited mainly by electrons) is again consistent with little or no electron-ion equilibration. Koyama et al. (1995) present spectral and imaging evidence from ASCA that the high energy component of the x-ray spectrum of SN1006 is nonthermal synchrotron radiation, obviating the need for collisionless electron heating (see also Reynolds 1996).
The results reported here, equations (5) and (6), tend to support the conclusion that virtually all the shock energy is deposited into the ions. If some of the shock energy were chaneled into electrons, magnetic fields, or relativistic particles, then the ion dispersion would be lower than predicted by the observed deceleration, whereas the opposite is observed — the ion dispersion is slightly higher.
2.4 Column density and mass of Si 2
The numbers given here are summarized in Table 1. Quoted uncertainties in column densities and masses here and throughout this paper ignore uncertainties in oscillator strengths. The uncertainties in the oscillator strengths of Si 2 1260 Å is 17%, and of Si 3 1206 Å and Si 4 1394, 1403 Å are 10% (Morton 1991).
The column density of shocked and unshocked Si 2 follows from integrating over the line profiles shown in Figure 1. The column density of shocked Si 2 is
| (8) |
where is the optical depth at line center of the fitted Gaussian profile of the shocked Si 2, and the factor comes from integrating over the Gaussian profile. The profile of unshocked Si 2 is the residual after the shocked Si 2 is subtracted from the total, and we measure its column density by integrating the unshocked profile over the velocity range -:
| (9) |
where the uncertainty is largely from uncertainty in the fit to the shocked Si 2. Integrating the full Si 2 profile over - yields the total column density of Si 2
| (10) |
where the uncertainty is from photon counts, and is smaller than the uncertainties in either of the shocked or unshocked Si 2 column densities individually (because there is some uncertainty in allocating the total column density between the shocked and unshocked components).
The corresponding masses of unshocked and shocked Si 2 can also be inferred, if it is assumed that the Si was originally ejected spherically symmetrically. In subsection 2.8 we will argue that the absence of blueshifted Si 2 absorption can be explained if the reverse shock has passed entirely through the Si on the near side of SN1006, and Si has been collisionally ionized to high ion stages. Thus the absence of blueshifted Si 2 need not conflict with spherical symmetry of Si ejected in the supernova explosion. If the shocked ejecta are taken to lie in a thin shell at a free expansion radius of (slightly outside the position of reverse shock — cf. the argument in paragraph 3 of subsection 2.2), then the mass of shocked Si 2 is
| (11) |
where the uncertainty includes only the uncertainty in the column density of shocked Si 2. This value should perhaps be modified to to allow for uncertainty in the radial position of the shocked Si 2. The mass of unshocked Si 2 is an integral over the unshocked line profile
| (12) |
where the uncertainty is largely from uncertainty in the fit to the shocked Si 2.
2.5 Purity of shocked Si
We show below that the observed column density of Si 2 is close to the column density which would be predicted under the simple assumption of steady state collisional ionization downstream of the shock (note that recombination is negligible). Now the assumption of steady state ionization is surely false, since the timescale to ionize Si 2 is comparable to the age of the remnant, equation (3). Below we will argue that the effect of non-steady state is generally such as to reduce the column density below the steady state value. The constraint that the observed column density should be less than or comparable to the steady state value then leads to an upper limit on the electron to ion ratio, equation (14). The fact that this upper limit is not much greater than unity leads to the interesting conclusion that the bulk of the observed shocked Si 2 must be fairly pure, since admixtures of other elements would increase the electron to ion ratio above the limit.
If the postshock number density of Si 2 ions is (which is 4 times the preshock number density), then at shock velocity the number of Si 2 ions entering the reverse shock per unit area and time is . The Si 2 ions are collisionally ionized by electrons in the shocked gas at a rate ionizations per unit time. For and , it follows that the column density of shocked Si 2 in steady state should be
| (13) |
If, as will be argued below, the actual (non-steady state) column density (8) of shocked Si 2 is less than or comparable to the steady state value (13), then the mean ratio of electron to Si 2 density in the shocked gas satisfies
| (14) |
The ratio must of course also satisfy , since each Si 2 ion itself donates one electron. Such a low value (14) of the electron to Si 2 ratio in the shocked Si 2 would indicate that the bulk of the shocked Si 2 must be of a rather high degree of purity, since the presence of significant quantities of other elements or higher ionization states of Si would increase the number of electrons per Si 2 ion above the limit (14). Indeed, even if the Si 2 entering the shock were initially pure, ionization to Si 3 and higher states would release additional electrons. In steady state, the mean electron to Si 2 ratio experienced by Si 2 during its ionization from an initially pure Si 2 state is , already slightly larger than the limit (14).
The limit (14) on the electron to Si 2 ratio is so low as to make it difficult to include even modest quantities of other elements with the silicon. This may be a problem. While Si is generally the most abundant element in Si-rich material produced by explosive nucleosynthesis, other elements, notably sulfur, usually accompany the silicon. For example, the deflagrated white dwarf model W7 of Nomoto et al. (1984) contains of Si mostly in a layer which is about 60% Si, 30% S by mass. At this elemental abundance, and assuming similar ionization states for all elements, the expected mean electron to Si 2 ratio in steady state would be , almost twice the limit given by equation (14). Because of this potential difficulty, we discuss carefully below how robust is the constraint (14). First we address the accuracy of the predicted value (13) of the steady state column density, and then we discuss the non-steady state case.
The electron to Si 2 ratio could be increased if the predicted steady state column density (13) were increased, either by increasing the shock velocity , or by reducing the collisional ionization rate . We consider the former first, then the latter. The shock velocity is inferred from the observed ion dispersion in the Si 2 1260 Å line, equation (7). This should give a fair estimate of the mean shock velocity of the observed shocked Si 2, except for a small correction from the fact that the ion dispersion (temperature) in the past would have been higher because of adiabatic expansion of the remnant. Moffet, Goss & Reynolds (1993) find that the global radius of the radio remnant is currently increasing with time according to . If the ambient ISM is assumed to be uniform, this indicates that the pressure in the remnant is varying with time as , hence that the temperature is varying in Lagrangian gas elements as , hence that the ion dispersion is varying as , a rather weak function of time. If one supposes that the observed Si 2 was shocked on average when SN1006 was say half its current age, then the dispersion, hence the reverse shock velocity, could have been higher than at present. The steady state column density (13) would then be higher, and the constraint on the electron to Si 2 ratio (14) would be relaxed slightly to .
The collisional ionization rate used in equation (13) comes from integrating the cross sections of Lennon et al. (1988) over a Maxwellian distribution of electrons at a temperature of 83 eV. The quoted error in the cross-sections is 60%, the large uncertainty arising from the fact that the cross-sections for Si 2 are derived from isoelectronic scaling rather than from real data. Reducing the ionization rate by 0.2 dex would relax the constraint (14) to .
The temperature of 83 eV used in the collisional ionization rate above is the temperature reached by electrons as a result of Coulomb collisions with Si 2 ions over the collisional ionization timescale of Si 2. The assumption here that there is no collisionless heating of electrons in the shock is in accordance with the arguments given in subsection 2.3. Actually, the ionization rate of Si 2 by electron impact, as derived from the cross-sections of Lennon et al., has a broad maximum at an electron temperature of eV, and varies over only - for electron temperatures 40-1000 eV. Thus uncertainty in the electron temperature does not lead to much uncertainty in the collisional ionization rate, unless there is substantial collisionless heating of electrons to temperatures much higher than 1 keV.
We have argued against significant collisionless electron heating in subsection 2.3. However, if collisionless electron heating to temperatures greater than 1 keV did occur, it would imply both a higher shock velocity, since the observed ion dispersion would underestimate the shock energy, and a lower collisional ionization rate, both of which act to increase the steady state column density (13). Thus collisionless electron heating, if it occurs, would allow a larger electron to Si 2 ratio than given by equation (14).
We now turn to the argument that in a non-steady state situation, as here, the column density of shocked Si 2 is likely to be less than the steady state column density (13), which leads to the constraint (14) on the mean electron to Si 2 ratio in the shocked Si 2. In the first place, simply truncating the Si at some point downstream of the shock will give a lower column density than the steady state value. Secondly, geometric effects tend to reduce the column density below the steady state value. That is, the column density of Si 2 is diluted by the squared ratio of the original radius of the gas at the time it was shocked to the present radius () of this shocked gas. Thirdly, if the density profile of shocked Si at the present time increases outwards, then the faster ionization of the denser, earlier shocked, gas reduces its column density per interval of ionization time, and the net column density is again lower than steady state (a more rigorous demonstration of this is given in the Appendix). Conversely, if the density profile of shocked Si decreases outwards, then the net column density can be higher than steady state, but only if the flow is allowed to continue for sufficiently longer than a collisional ionization time. However, according to equation (3) the ionization timescale at the present Si 2 density is comparable to the age of the remnant, and the ionization timescale would be longer at lower density, so there is not much room for increasing the column density this way either.
So is there any way that the actual column density of Si 2 could be higher than the steady state value? Clearly yes, given sufficient freedom with the density profile of shocked Si. For example, one possibility is that there is a ‘hump’ in the shocked Si 2 density profile, such that the density increases outward of the present position of the reverse shock front, but then declines at larger radii. Some tuning is required to ensure that the density on both near and far sides of the hump is high enough to produce significant column density, but not so high as to ionize Si above Si 2. The higher the column density, the more fine-tuning is required.
We thus conclude that while some violation of the limit (14) on the mean electron to Si 2 ratio in the shocked Si 2 is possible, greater violations, exceeding say a factor of two, are less likely. It then follows that the bulk of the shocked Si 2 is likely to be of a fairly high degree of purity. In particular, there is unlikely to be much iron mixed in with the shocked silicon, a conclusion which is consistent with the absence of Fe 2 absorption with the same profile as the shocked Si 2, as discussed in subsection 3.4. To avoid misunderstanding, this statement refers only to the shocked Si 2: iron could be mixed with the unshocked Si, and indeed the absorption profile of Fe 2, Figure 6 below, does suggest that there is some Fe mixed with unshocked Si.
2.6 Si 3 and Si 4 line profiles
Given that shocked Si 2 apparently persists for a time comparable to its ionization time, it is difficult to avoid producing an appreciable quantity of Si 3 and Si 4 as the result of collisional ionization of Si 2 in the shocked ejecta. We thus conclude that it is likely that most of the observed Si 3 and Si 4 absorption arises from shocked ejecta. This is consistent with the observed line profiles, as will now be discussed.


Figures 2 and 3 show fits to the redshifted Si 3 1206 Å and Si 4 1394, 1403 Å features using as templates the shocked and unshocked profiles of Si 2 1260 Å shown in Figure 1. Table 3 gives the fitted column densities of shocked and unshocked Si 3 and Si 4, expressed relative to the best fit column density of shocked and unshocked Si 2 given in Table 1.
The Si 3 1206 Å profile appears to be mostly shocked. There is some indication of unshocked Si 3 over - at the level, Table 3, as suggested by the residual profile after subtraction of shocked Si 3 plotted in Figure 2. The dispersion of the fitted Gaussian profile of the Si 3, if allowed to be a free parameter, is if unshocked Si 3 is excluded, or if unshocked Si 3 is admitted, which are in good agreement with the dispersion of the Si 2.
The profile of the Si 4 1394, 1403 Å feature, Figure 3, is consistent with containing no unshocked Si 4. If the line center and width of the Gaussian pair fitted to the Si 4 1394, 1403 Å doublet are allowed to be free, then the center remains close to , the same as for Si 2 1260 Å, but the best fit dispersion of the Si 4 is , which is higher than the dispersion of Si 2 1260 Å. The broader dispersion suggests that the Si 4 may be in slightly lower density gas than the Si 2, since the pressure is presumably the same for both. It is not clear however that the observed difference in velocity width between Si 4 and Si 2 is real. One problem is that the continuum around Si 4 appears less well defined than for the Si 2 and Si 3 features. As elsewhere in this paper, we assume a stellar continuum which is linear in -, but in fact there is a hint of curvature, a large scale depression in the continuum around Si 4 1394, 1403 Å (see WCHFLS96, Figure 1). If we have systematically misjudged the continuum, then it is possible that we have underestimated the uncertainties in the parameters of Si 4 given Table 3, perhaps by as much as a factor of 2. The Gaussian profile shown in Figure 3 is constrained to have the same center and dispersion as the Si 2 1260 Å feature. Visually, at least, the fit appears satisfactory.
lccc \tablewidth0pt \tablecaptionColumn densities of shocked and unshocked Si 3 and Si 4, relative to best fit column densities of Si 2 \tablehead& \colheadSi 2 \colheadSi 3 \colheadSi 4 \startdataShocked & \nlUnshocked \nl\enddata\tablecomments Absolute column densities of Si 2 are given in Table 1. Column densities of Si 4 relative to Si 2 are for fits in which the dispersion of Si 4 is constrained to be that of Si 2 1260 Å, namely . The column densities of Si 4 become (shocked) and (unshocked) if instead the dispersion of the Si 4 is taken to have the best fit value .
2.7 Total Si mass
In subsection 2.5 we showed that the observed column density of shocked Si 2 is close to the theoretical steady state value. Is the same also true for Si 3 and Si 4? The answer is no. In steady state, the predicted column densities of shocked ionic species are inversely proportional to their respective collisional ionization rates , modified by an appropriate electron to ion ratio (cf. equation [13]). Adopting rates , , for Si 2, Si 3, Si 4 respectively (Lennon et al. 1988), and assuming a nominal electrons per ion for Si+i, yields relative column densities in steady state
| (15) |
By comparison the observed shocked column densities are , according to Table 3. Evidently the observed abundances of shocked Si 3 and Si 4 relative to Si 2 are several times less than predicted in steady state.
As discussed in subsection 2.5, there are several ways to reduce the column density below the steady state value, of which the most obvious is to truncate the column density, as is strongly suggested by the fact that the ionization timescales of Si 3 and Si 4 are becoming long compared to the age of the remnant. In fact these ionization timescales are in precisely the same ratio (cf. equation [2]) as the steady state column densities (15)
| (16) |
and it has already been seen that the ionization timescale of Si 2 is comparable to the age of the remnant, equation (3).
If it is true that it is the long ionization times which cause the column densities of Si 3 and Si 4 to be lower than steady state, then this suggests that there may be little Si in higher ionization states in the shocked gas on the far side of SN1006. Thus it appears plausible that we are observing in UV absorption essentially all the Si there is on the far side of SN1006 along the line of sight to the background SM star. To avoid confusion, it should be understood that this statement refers specifically to Si on the far side along this particular line of sight. Higher ionization states of Si are indicated by the observed Si x-ray line emission (Koyama et al. 1995), which could arise from denser shocked gas in other parts of the remnant.
The mass of Si can be inferred from the observed column densities of Si 2, Si 3, and Si 4, if it is assumed that silicon was ejected spherically symmetrically by the supernova explosion. We will argue in subsection 2.8 that the absence of blueshifted absorbing Si is not inconsistent with spherical symmetry. Taking the shocked and unshocked masses of Si 2 from Table 1, and the ratios of Si 2, Si 3, and Si 4 from Table 3, yields a total inferred Si mass of
| (17) | |||||
This is comparable to the of Si in model W7 of Nomoto et al. (1984). It is also consistent with the of Si inferred from the strength of the Si K line observed with ASCA (Koyama et al. 1995). Koyama et al. do not quote a mass, but they do state that the measured surface brightness of the Si K line is 5 times higher than that in the model222 Hamilton et al. took the strength of the Si K line to be (the upper limit to) that measured from the Einstein Solid State Spectrometer (Becker et al. 1980), so there is a discrepancy between the ASCA and SSS data. However, Hamilton et al. also noted in their Figure 6 a marked discrepancy between the SSS and HEAO-1 data of Galas, Venkatesan & Garmire (1982), so it is reasonable to suspect an error in the normalization of the SSS data. of Hamilton, Sarazin & Szymkowiak (1986; see also Hamilton et al. 1985), which had of Si.
2.8 No blueshifted Si — evidence for an inhomogeneous ISM?
There is no evidence for blueshifted Si absorption in the UV spectrum. At best, there is a possible hint of a broad shallow depression around , from 1365 Å to 1390 Å, on the blue side of the Si 4 1394, 1403 Å line (see WCHFLS96, Figure 1). The possibility that some high velocity blueshifted Si 2 1260 Å is hidden in the red wing of Si 3 1206 Å is excluded by the absence of corresponding blueshifted Si 2 1527 Å.
There are two possible reasons for the asymmetry in the observed Si absorption. One is that there was an intrinsic asymmetry in the supernova explosion. According to Garcia-Senz & Woosley (1995), the nuclear runaway that culminates in the explosion of a nearly Chandrasekhar mass white dwarf begins as stable convective carbon burning, and ignition is likely to occur off-center at one or more points over a volume of the order of a pressure scale height. The subsequent propagation of the convectively driven burning front is Rayleigh-Taylor unstable (Livne 1993; Khokhlov 1995; Niemeyer & Hillebrandt 1995), although Arnett & Livne (1994) find that in delayed detonation models the second, detonation, phase of the explosion tends to restore spherical symmetry.
Thus asymmetry in the explosion is possible, perhaps even likely, as an explanation of the asymmetry in the Si absorption, especially since the absorption samples only a narrow line of sight through SN1006 to the background SM star. However, we do not pursue this possibility further, in part because in abandoning spherical symmetry we lose any predictive power, and in part because there is another explanation which is more attractive because it resolves some other observational problems.
The other possible cause of the asymmetry in the Si absorption is that the ISM around SN1006 is inhomogeneous, with the ISM on the far side of SN1006 having a significantly lower density than the near side. According to this hypothesis, the low density on the far side is such that the reverse shock on the far side has reached inward only to a free expansion radius of , whereas the higher density on the near side is such that the reverse shock on the near side has passed entirely through the Si layer, and Si has been collisionally ionized to stages higher than Si 4, making it unobservable in UV absorption.
A serious objection to the reverse shock on the near side being farther in than the reverse shock on the far side is the observation by WCFHS93 of blueshifted Fe 2 absorption certainly to velocities , perhaps to velocities . We will review the observational evidence for such high velocity blueshifted Fe 2 in Section 3 below, where we will argue that the evidence is not compelling.
An inhomogeneous ISM around SN1006 is indicated by other observations. Wu et al. (1983) and subsequent authors have remarked on the difficulty of fitting the observed high velocity () Si within the confines of the observed interstellar blast wave, if spherical symmetry is assumed. At a distance of (Laming et al. 1996), the remnant’s observed radius (Reynolds & Gilmore 1986, 1993; see also Willingale et al. 1996) at 980 years old333 Note there is a 23 year light travel time across one radius of the remnant, so really we are seeing the far side at an age 23 years younger, and the near side 23 years older, than the mean age. corresponds to a free expansion radius of . The difficulty is resolved if the remnant of SN1006 bulges out on the far side, because of the lower density there.
A second piece of evidence suggesting inhomogeneity is the high velocity of the shocked ejecta behind the reverse shock on the far side of SN1006 inferred from the present observations, compared with the - (the lower velocity corresponds to no collisionless electron heating, which is the preferred case) velocity of shocked gas behind the interstellar shock inferred from H and UV emission line widths along the NW sector of the remnant (Kirshner et al. 1987; Long et al. 1988; Smith et al. 1991; Raymond et al. 1995). These two velocities, versus -, appear incompatible, especially as the velocity of shocked gas is expected in realistic hydrodynamic models to increase outwards from the reverse shock to the interstellar shock (see for example HF88, Fig. 2). The incompatibility is resolved if the ISM around SN1006 is inhomogeneous, with the density on the far side of SN1006 being substantially lower than the density at the NW edge.
A final piece of evidence supporting inhomogeneity comes from the observation of Si K line emission in x-rays (Koyama et al. 1995). This emission is likely to be from ejecta, since the inferred abundance of Si is stated to be an order of magnitude higher than that of O, Ne, or Fe. To ionize Si to high ionization states in the age of SN1006, and to produce Si K line emission at the observed luminosity, requires densities (i.e. since the Si is highly ionized), substantially higher than the postshock density of deduced here from the redshifted Si 2 1260 Å absorption profile. It is difficult to see how the required high Si density could be achieved if the reverse shock everywhere around the remnant is at a radius as high as , whereas higher densities would occur naturally if the reverse shock around most of the remnant were farther in, since then ejecta would have been shocked at earlier times when its density ( in free expansion) was higher.
All these arguments point to the notion that the ISM density on the far side of SN1006 is anomalously low compared to the density around the rest of the remnant.
2.9 Ionization of Si on the near side
In Section 3, we will argue that the Fe 2 absorption profiles suggest that the reverse shock on the near side of SN1006 may be at a free expansion radius of (as with the Hubble expansion of the Universe, it is often convenient to think in a comoving frame expanding freely with the ejecta, so that a free expansion velocity can be thought of as a radius). Here we estimate whether Si could have ionized beyond Si 4, as required by the absence of observed blueshifted Si absorption, if the reverse shock on the near side is indeed at .
In our first estimate, we find that blueshifted Si 4 should be observable, with a column density that of the observed redshifted Si 4 absorption. However, the column density is somewhat sensitive to the assumptions made, and it is not hard to bring the column density down below observable levels.
The line profile of any blueshifted absorbing Si would have a width comparable to that of the observed broad redshifted Si absorption, but the centroid would be shifted to lower velocities, to , if it assumed that the reverse shock velocity on the near side is comparable to that, , observed on the far side. To avoid being observed at say , the column density of blueshifted Si 4 should be less than .
To estimate the ionization of Si, it is necessary to adopt a hydrodynamic model. Now one interesting aspect of hydrodynamical models of deflagrated white dwarfs expanding into a uniform ambient medium is that the reverse shock velocity remains almost constant in time (this conclusion is based on hydrodynamic simulations carried out by HF88). In model W7 of Nomoto et al. (1984), the reverse shock velocity varies (non-monotonically) between and as it propagates inward from a free expansion radius of to , after which the shock velocity accelerates. Similarly in model CDTG7 (Woosley 1987, private communication), which is similar to model CDTG5 of Woosley & Weaver (1987), the reverse shock velocity varies between and as it propagates inward from a free expansion radius of to . These numbers do not depend on the density of the ambient medium, although they do depend on the ambient density being uniform. If the reverse shock velocity remains constant in time, then the radius of the reverse shock evolves with time according to , from which it follows that the free expansion radius of the reverse shock varies with time as
| (18) |
where is the age at which the reverse shock eventually hits the center of the remnant.
The assumption that the reverse shock is constant in time may not be correct for SN1006, but it provides a convenient simplification to estimate the ionization of Si on the near side. Let us first estimate the ionization state of Si which was originally at a free expansion radius of , the current location of the reverse shock on the far side. If the reverse shock on the near side is currently at a free expansion radius of , and if it has moved at a constant , the measured value on the far side (recall that the reverse shock velocity is independent of the ambient density, for uniform ambient density), then it would have passed through a free expansion radius of when the age of SN1006 was times its present age , according to equation (18). The postshock density of Si ions at that time would have been times higher than the presently observed postshock density of . The ion density in the parcel of gas shocked at that time has been decreasing because of adiabatic expansion. The rate of decrease of density by adiabatic expansion can be inferred from the observed global rate of expansion of the remnant (Moffet, Goss & Reynolds 1993)
| (19) |
which for an assumed uniform ambient density would imply that the pressure is decreasing as , hence that the density in Lagrangian gas elements is varying as . The current ionization time of the parcel of gas originally at free expansion radius which was shocked at an age is then
| (20) | |||||
where is the present postshock density of Si 2 ions times age at the radius . If the Si is assumed unmixed with other elements and initially singly ionized, then the ionization time (20) yields ion fractions 5% Si 3, 34% Si 4, and the remaining 61% in higher stages.
Since this ionization state is close to (just past) the peak in the Si 4 fraction, it should be a good approximation to estimate the column density of Si 4 by expanding locally about the conditions at . The expected column density is the steady state column density, multiplied by a geometric factor, and further multiplied by a ‘density profile’ factor , as shown in the Appendix, equation (35). The steady column density is = = assuming a nominal . The geometric factor is , which is the squared ratio of the radius of the gas at the time it was shocked to its radius at the present time . For the density profile factor, equation (20) gives , while the logarithmic slope of the shocked density profile, equation (31), is = = , the 3 coming from free expansion, the from the observed unshocked Si 2 density profile (see eq. [27]) at along with equation (18), and the from the reduction in density caused by adiabatic expansion. The resulting density profile factor is . The expected column density of blueshifted Si 4 is then , which is 40% of the observed column density of redshifted Si 4, and 2.5 times the minimum () observable column density.
Thus under a reasonable set of simplifying assumptions, there should be an observable column density of blueshifted Si 4, contrary to observation. However, the expected column density is sensitive to the assumed parameters. For example, reducing the shock velocity on the near side by 20% to reduces the column density by a factor 2.5 to the observable limit . Whether the shock velocity on the near side is less or more than that on the far side depends on the unshocked density profile of ejecta (generally, a shorter exponential scale length of unshocked density with velocity yields lower shock velocities). The expected column density is also sensitive to the shocked density profile, as might be guessed from the fact that the density profile factor of estimated above differs substantially from unity.
Alternatively, the column density of Si 4 could be reduced below the observable limit by mixing the Si with a comparable mass of other elements, such as iron, since this would increase the number of electrons per silicon ion, causing more rapid ionization. The possibility that there is iron mixed with Si at velocities gains some support from the observed density profile of Fe 2, shown in Figure 6 below. Note this does not conflict with the argument in subsection 2.5 that most of the shocked Si (which was originally at higher free expansion velocities) is probably fairly pure, with little admixture of other elements such as iron.
3 Iron
We have argued above that an attractive explanation for the presence of redshifted Si absorption and absence of blueshifted absorption is that the ISM on the near side of SN1006 is much denser than that on the far side, so that a reverse shock has already passed all the way through the Si layer on the near side, ionizing it to high ionization stages, whereas the reverse shock is still moving through the Si layer on the far side. This picture appears to conflict with our previously reported result (WCFHS93), according to which blueshifted Fe 2 is present to velocities . In this Section we reexamine the Fe 2 absorption lines to see how robust is this result.
In the average broad Fe 2 profile shown in Figure 3 of WCFHS93, redshifted Fe 2 seems to extend up to about , but not much farther. This is consistent with the argument of the present paper, which is that the reverse shock on the far side of SN1006 lies at . The problem lies on the blueshifted side of the Fe 2 profile, which appears to extend clearly to , possibly to .
Figure 2 of WCFHS93 shows separately the two broad Fe 2 2383, 2344, 2374 Å and Fe 2 2600, 2587 Å features. The Fe 2 2600, 2587 Å feature appears to have a fairly abrupt blue edge, although there is perhaps a tail to higher velocities depending on where the continuum is placed. The blue edge is at a velocity of with respect to the stronger 2600 Å component of the doublet, and the same edge appears at this velocity in the average Fe 2 profile shown in WCFHS93’s Figure 3. We will argue that this edge plausibly represents the position of the reverse shock on the near side of SN1006.
In contrast to Fe 2 2600 Å, the deconvolved profile of the Fe 2 2383 Å feature, plotted in the bottom curve of WCFHS93’s Figure 2, shows blueshifted absorption clearly extending to . We note that the second strongest component of the triplet, 2344 Å, with the oscillator strength of the principal 2383 Å component, lies at blueward of the principal line, and uncertainty involved in removing the secondary component in the deconvolution procedure could tend to obscure any sharp blue edge at on the principal component.
3.1 Fe 2 analysis

In this subsection we present details of a reanalysis of the Fe 2 absorption lines in the HST G190H and G270H spectra originally analyzed by WCFHS93. The observations are described by WCFHS93, and here we describe the differences between the analysis here and that of WCFHS93. In carrying out the reanalysis, we paid particular attention to procedures which might affect the blue wing of the Fe 2 2383 Å feature.
The G190H and G270H spectra overlap over the wavelength range 2222-2330 Å, and we merged the two spectra in this region using inverse variance weighting, whereas WCFHS93 chose to abut the spectra at 2277 Å. In merging the spectra we interpolated the G270H data to the same bin size as the G190 spectrum, which has higher resolution (2 Å versus 2.8 Å), and higher signal to noise ratio than the G270H spectrum in the overlap region. According to the FOS handbook, there is contamination at the level of a few percent in the G190H spectrum above 2300 Å from second order, but, given the absence of strong features over 1150-1165 Å, we accept this contamination in the interests of obtaining higher signal to noise ratio. The merged spectrum is noticeably less choppy than the G270H spectrum alone in the overlap region.
The 2200 Å extinction bump is close to the blue wing of the Fe 2 2383 Å feature, so we re-examined the reddening correction. In practice, the changes made here had little effect on the profile of the Fe 2 2383 Å feature. We dereddened the G190H and G270H spectra using the extinction curve of Cardelli, Clayton & Mathis (1989), adopting , which is the best fitting value determined by Blair et al. (1996) from HUT data, and . The value of is slightly higher than the value measured by WCFHS93 using the extinction curve of Savage & Mathis (1979). WCFHS93 comment that their dereddening leaves a bump from 1900 Å to 2100 Å and a shallow trough from 2100 to 2300 Å. We find the same difficulty here: the slightly higher value of adopted here does slightly better at removing the 2200 Å depression, but at the expense of producing a bigger bump at 2000 Å. The choice of makes little difference, but lower values help to reduce the bump marginally. The value adopted here is slightly below the ‘standard’ value .
WCFHS93 fitted the continuum flux to a quadratic function of wavelength. The simple quadratic form does impressively well in fitting the dereddened spectrum over the full range 1600 Å to 3300 Å (cf. Figure 4 and WCFHS93 Figure 2). However, the quadratic form does not fit perfectly, and there remains a residual discrepancy which is not well fitted by a low order polynomial, and which may possibly result from imperfect modeling of the extinction, especially around the 2200 Å bump. The imperfection mainly affects the Fe 2 2383 Å feature: the quadratic continuum appears too steep compared to the ‘true’ continuum around this feature. Here we resolve the difficulty by the expedient of fitting the dereddened continua around each of the two broad Fe 2 features separately, to two different linear functions in -. The adopted continua are shown in Figure 4.
An important difference between the present analysis and that of WCFHS93 is in the treatment of narrow lines. WCFHS93’s procedure was to identify all lines with an equivalent width, defined relative to a local continuum, greater than 3 times the expected error. WCFHS93 then subtracted the best fitting Gaussian for each such line, treating the position, width, and strength of each line as free parameters. Here we adopt a different policy, requiring that the positions, widths, and strengths of narrow lines conform to prior expectation. That is, for each identified narrow line we subtract a Gaussian profile in which the wavelength is set equal to the expected wavelength (modulo an overall shift for all lines), the width is set equal to the instrumental resolution (2.8 Å FWHM for G270H), and the strengths are required to be mutually consistent with other narrow lines of the same ion.
The relevant narrow lines are those in and near the broad Fe 2 features. In the Fe 2 2383, 2344, 2374 Å feature, besides the narrow (presumed interstellar) components of the Fe 2 lines themselves, we identify the narrow line at 2298 Å as stellar C 3 2297.578 Å (Bruhweiler, Kondo & McCluskey 1981). WCFHS93 subtracted an unidentified narrow line at 2316 Å, but the G190H spectrum does not confirm the reality of this line in the G270H spectrum, and here we leave it unsubtracted. In the Fe 2 2600, 2587 Å feature, besides the narrow Fe 2 lines themselves, we identify narrow lines of Mn 2 2577, 2594, 2606 Å, as did WCFHS93.
The mean velocity shift of the three most prominent narrow Fe 2 lines, those at 2383 Å, 2600 Å, and 2587 Å, is , and we adopt this velocity shift for all the narrow Fe 2 and Mn 2 lines. We allow the stellar C 3 2298 Å line its own best fit velocity shift of , since there is no reason to assume that the stellar and interstellar velocities coincide exactly.
The observed equivalent widths of the Mn 2 lines are approximately proportional to their oscillator strengths times wavelengths, which suggests the lines are unsaturated, so we fix the ratios of the fitted Mn 2 lines at their unsaturated values.
Of the five narrow Fe 2 lines, the two principal lines Fe 2 2383 Å and Fe 2 2600 Å, and also the line with the fourth largest oscillator strength, Fe 2 2587 Å, have approximately equal observed equivalent widths (in velocity units) relative to a local continuum, , , = , , respectively (at fixed centroid and dispersion), which suggests the lines are saturated. The fifth and weakest line, Fe 2 2374 Å, has an observed equivalent width about half that of the strong lines, which is consistent with the weak line being marginally optically thin and the strong lines again being saturated. For these four lines we allow the strength of the fitted line to take its best fit value, since they are mutually consistent within the uncertainties.
The line with the third largest oscillator strength, Fe 2 2344 Å, appears anomalous, since the observed line has an equivalent width less than that of the strong lines, or that of the intrinsically weaker Fe 2 2374 Å line. In the fit, we force the equivalent width of the anomalous Fe 2 2344 Å narrow line to be the saturated value measured from the Fe 2 2600 Å and Fe 2 2587 Å lines, multiplied by to allow for a uncertainty in this value. The fit gives the impression that the anomalous Fe 2 2344 Å line is oversubtracted, but the effect is to bring the profile of the deconvolved broad Fe 2 2383 Å line into closer agreement with that of Fe 2 2600 Å.

We deconvolved the broad Fe 2 2383, 2344, 2374 Å and Fe 2 2600, 2587 Å features by subtracting the contributions from the weaker components, using the following analytic procedure. In a two component line, the observed optical depth at velocity with respect to the principal component is a sum of the line profile of the principal component and the line profile of the secondary component, where is the velocity shift of the secondary relative to the principal component, and is the ratio of oscillator strengths times wavelengths:
| (21) |
Equation (21) inverts to
| (22) |
which can conveniently be solved iteratively by
| (23) |
The iterative procedure converges rapidly to the solution, , as increases; we stop at . To avoid irrelevant parts of the spectrum outside the line profile from propagating through the solution, we set the optical depth to zero, in equation (3.1), at velocities . The above procedure works for a two component line such as Fe 2 2600, 2587 Å, and a slightly more complicated generalization works for a three component line such as Fe 2 2383, 2344, 2374 Å.
3.2 Fe 2 line profiles
Figure 5 shows the results of our reanalysis. The upper curves in the Figure show the deconvolved Fe 2 2383 Å and Fe 2 2600 Å line profiles, and these deconvolved profiles agree well with each other. The deconvolved Fe 2 2600 Å profile here also agrees well with that of WCFHS93. However, the revised Fe 2 2383 Å profile no longer shows compelling evidence for high velocity blueshifted absorption beyond , although the presence of some absorption is not excluded.
What causes the difference between the Fe 2 2383 Å line profile shown in Figure 5 versus that of WCFHS93? One factor is that we adopt different continua, as illustrated in Figure 4. WCFHS93’s single quadratic fit to the continuum over the entire spectrum is certainly more elegant than the two separate linear fits to each of the two broad Fe 2 features which we adopt here. The advantage of the fit here is that it removes the apparent tilt in the Fe 2 2383 Å line profile left by the quadratic fit, evident in Figures 2 and 3 of WCFHS93.
However, the major difference between the two analyses is the subtraction here of the narrow Fe 2 2344 Å interstellar line with a strength times the saturated line strength observed in the Fe 2 2600 Å and 2587 Å narrow lines. By comparison, WCFHS93 subtracted the narrow Fe 2 2344 Å line using the observed strength of the line, which is anomalously weak compared to the other four narrow Fe 2 lines.

lr \tablewidth0pt \tablecaptionParameters measured from Fe 2 profile \tablehead\colheadParameter & \colheadValue \startdataPosition of reverse shock on near side & \nlColumn density of Fe 2 \nlMass of Fe 2 up to \nl\enddata\tablecomments Fe 2 mass is from red side of profile, and assumes spherical symmetry.
Figure 6 shows the Fe 2 density inferred from the mean of the two deconvolved Fe 2 features. The Fe 2 column density inferred from the mean profile, integrated from to , is
| (24) |
Most of the uncertainty, based here on the scatter between the two deconvolved profiles, comes from the blue side of the profile: the column density on the blue side from to is , while the column density on the red side from to is .
In estimating the mass of Fe 2 from the density profile in Figure 6, we take into account the small correction which results from the fact that the SM star is offset by southward from the projected center of the radius remnant (Schweizer & Middleditch 1980). The offset corresponds to a free expansion velocity of at the distance of the remnant. If spherical symmetry is assumed, then the mass is an integral over the density at line-of-sight velocity :
| (25) |
where is the mass inside the free-expansion velocity . At a constant central density of , the mass inside would be , and the actual Fe 2 mass is probably slightly higher, given that the density is increasing mildly inward. The masses given below, equation (26), include a fixed . The factor rather than in equation (25) increases the Fe 2 masses by a further , so the masses quoted in equation (26) are altogether larger than they would be if no adjustment for the offset of the SM star were applied.
The total mass of Fe 2 inferred from the cleaner, red side of the profile, assuming spherical symmetry, is then
| (26) |
The uncertainties here are based on the scatter between the two deconvolved Fe 2 profiles, and do not included systematic uncertainties arising from placement of the continuum, which mostly affects the outer, high velocity parts of the profile. WCFHS93 obtained from the red side of the mean Fe 2 profile, which is lower than the obtained here mainly because of the different placement of the continuum (see Figure 4), and to a small degree because of the adjustment applied here for the offset of the SM star.
Figure 6 also shows for comparison the density of unshocked Si. Below , the Si density profile is just the unshocked profile inferred from the Si 2 1260 Å absorption, Figure 1. Above , the Si density is a plausible extrapolation which is consistent with observational constraints: it is a quadratic function of the free expansion velocity
| (27) | |||||
which approximately reproduces the observed profile of unshocked Si 2, and which contains, on the assumption of spherical symmetry, a total Si mass of , in accordance with equation (17).
3.3 Reverse shock on the near side
If the reanalysis of the Fe 2 lines here is accepted, then it is natural to interpret the sharp blue edge on the broad Fe 2 lines at as representing the free expansion radius of the reverse shock on the near side of SN1006. This identification is not as convincing as the identification of the sharp red edge on the Si 2 1260 Å feature as representing the radius of the reverse shock on the far side at .
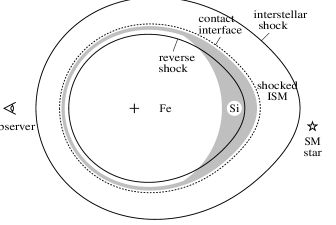
Figure 7 illustrates schematically the inferred structure of the remnant of SN1006. The picture is intended to be approximately to scale, and in it the diameter of SN1006 along the line of sight is roughly 20% larger than the diameter transverse to the line of sight. By comparison, the diameter of the observed radio and x-ray remnant varies by 10%, from a minimum of to a maximum of (Reynolds & Gilmore 1986, 1993) or (Willingale et al. 1996).
As already discussed in subsections 2.8 and 2.9, if the position of the reverse shock on the near side at is typical of the rest of the remnant, while the position of the reverse shock on the far side is anomalously high because the interstellar density on the far side is low, then it would resolve several observational puzzles. In summary, these observational puzzles are: (1) how to fit gas expanding at within the confines of the interstellar shock (answer: the remnant bulges out on the far side because of the low density); (2) how the velocity of shocked Si on the far side could be so much higher than the velocity (assuming no collisionless electron heating) of gas behind the interstellar shock along the NW filament (answer: velocities on the far side are anomalously high because the interstellar density there is anomalously low); (3) how to achieve Si densities necessary to produce the observed Si x-ray emission, compared to the postshock Si density of measured from the Si 2 absorption on the far side (answer: gas shocked at earlier times is denser because density decreases as in free expansion); and (4) why there is strong redshifted Si absorption but no blueshifted absorption (answer: Si on the near side has been shocked and collisionally ionized above Si 4). As regards the second of these problems, if the reverse shock on the near side is indeed at , then the velocity of reverse-shocked gas on the near side would be of order , much more in keeping with the velocity of shocked gas in the NW filament.
3.4 Contribution of shocked Fe to absorption
In subsections 2.1 and 2.6 we concluded that most of the observed absorption by Si ions is from shocked Si. Does shocked Fe also contribute to the observed broad Fe 2 absorption profiles? The answer, on both observational and theoretical grounds, is probably not much.
On the red side of the Fe 2 profile, shocked Fe 2 would have a Gaussian line profile centered at , the same as observed for shocked Si. No absorption with this profile is observed, Figure 5 or 6. Since the collisional ionization rates of Fe 2 and Si 2 are similar (Lennon et al. 1988), the absence of such Fe 2 absorption implies that there cannot be much iron mixed in with the shocked Si. This is consistent with the argument in subsection 2.5, that the bulk of the shocked Si 2 must be fairly pure, unmixed with other elements.
On the other hand the observed Fe 2 profile, Figure 6, does suggest the presence of some Fe 2 mixed with unshocked Si, at velocities . The picture then is that there is Fe mixed with Si at lower velocities, but not at higher velocities. This is consistent with SN Ia models, such as W7 of Nomoto et al. (1984), in which the transition from the inner Fe-rich layer to the Si-rich layer is gradual rather than abrupt.
On the blue side of the Fe 2 profile, if the reverse shock is at , then shocked Fe 2 should have a Gaussian profile centered at , with a width comparable to that of the broad redshifted Si features. While some such absorption may be present, the similarity between the blueshifted and redshifted sides of the Fe 2 absorption suggests that the contribution to the blue side from shocked Fe 2 is not large. This is consistent with expectation from the density profile of unshocked Fe 2 on the red side. The mass of Fe 2 at velocities - inferred from the red side of the profile on the assumption of spherical symmetry is . If this mass of Fe 2 is supposed shocked on the blue side and placed at the reverse shock radius of , the resulting Fe column density is , which translates into a peak Fe density of at velocity , for an assumed dispersion of like that of the redshifted Si features. This density of shocked Fe is low enough that it makes only a minor contribution to the Fe 2 profile in Figure 6.
In practice, collisional ionization of shocked Fe 2 reduces its contribution further. For pure iron with an initial ionization state of, say, 50% Fe 2, 50% Fe 3 (see subsection 3.5), we find that the column density of shocked Fe 2 is reduced by a factor 0.6 to , which translates into a peak Fe 2 density of at velocity . The shocked column density would be even lower if the initial ionization state is higher, or if there are other elements mixed in with the Fe, since a higher electron to Fe 2 ratio would make collisional ionization faster. If the initial ionization state of the iron is as high as proposed by HF88, then the shocked Fe 2 column density of Fe could be as low as , for a peak density of at velocity in Figure 6.
3.5 Photoionization
The mass of Fe 2 inferred here from the Fe 2 profile is, according to equation (26), up to , and up to .
Historical and circumstantial evidence suggests that SN1006 was a Type Ia (Minkowski 1966; Schaefer 1996). Exploded white dwarf models of SN Ia predict that several tenths of a solar mass of iron ejecta should be present, as required to explain SN Ia light curves (Höflich & Khokhlov 1996). Thus, as emphasised by Fesen et al. (1988) and by HF88, the observed mass of Fe 2 in SN1006 is only a fraction () of the expected total Fe mass.
Hamilton & Sarazin (1984) pointed out that unshocked SN ejecta will be subject to photoionization by UV starlight and by UV and x-ray emission from the reverse shock. Recombination is negligible at the low densities here. HF88 presented detailed calculations of the time-dependent photoionization of unshocked ejecta in SN1006, using deflagrated white dwarf models W7 of Nomoto et al. (1984), and CDTG7 of Woosley (1987, private communication), evolved by hydrodynamic simulation into a uniform interstellar medium. HF88 found that in these models most of the unshocked Fe was photoionized to Fe 3, Fe 4, and Fe 5. While model W7 produced considerably more Fe 2 than observed in SN1006, model CDTG7, which is less centrally concentrated than W7, produced an Fe 2 profile in excellent agreement with the IUE Fe 2 2600 Å feature. HF88 concluded that several tenths of a solar mass of unshocked Fe could be present at velocities in SN1006, as predicted by Type Ia supernova models.
However, the low ionization state of unshocked Si inferred from the present HST observations does not support the high ionization state of Fe advocated by HF88. According to the ion fractions given in Table 3, unshocked Si is Si 2. By comparison, HF88 argued that unshocked Fe is only Fe 2. We now show that these ionization states of Si 2 and Fe 2 are not mutually consistent.
The ionizations of unshocked Si 2 and Fe 2 are related according to their relative photoionization cross-sections, and by the energy distribution of the photoionizing radiation. Neutral Si and Fe can be neglected here, since they have ionization potentials below the Lyman limit, and are quickly ionized by UV starlight (Si 1 in , Fe 1 in if the starlight is comparable to that in the solar neighborhood), once the ejecta start to become optically thin to photoionizing radiation, at -.

Photoionization cross-sections of Si 2 and Fe 2, taken from Reilman & Manson (1979) and adapted to include autoionizing photoionization as described by HF88, are shown in Figure 8. The Figure shows that the photoionization cross-section of Fe 2 is about an order of magnitude larger than that of Si 2 from the ionization potential up to the L-shell (autoionizing) photoionization threshold of Si 2 at 100 eV, above which the photoionization cross-sections are about equal, until the L-shell threshold of Fe 2 at 700 eV. According to HF88 (Table 6, together with Table 2 of Hamilton & Sarazin 1984), much of the photoionizing emission from the reverse shock is in the UV below 100 eV. However, there is also some soft x-ray emission above 100 eV, which is important for Si 2 because its L-shell photoionization cross-section is larger than that of the valence shell. Averaging over the photoionizing photons tabulated by HF88, we find that the effective photoionization cross-section of Fe 2 is about 5 times that of Si 2, which is true whether the source of the emission in the reverse shock is oxygen, silicon, or iron.
If the effective photoionization cross-section of Fe 2 is 5 times that of Si 2, then an unshocked Si 2 fraction of would predict an unshocked Fe 2 fraction of , considerably larger than the desired unshocked Fe 2 fraction of . The lower limit on the Si 2 fraction is , which would predict an unshocked Fe 2 fraction of , closer to but still higher than desired.
A higher ionization state of Fe compared to Si might be achieved if the photoionizing emission could be concentrated entirely in the UV below 100 eV, since then the effective photoionization cross-section of Fe 2 would be about 10 times that of Si 2, as illustrated in Figure 8. This could occur if the photoionizing emission were mainly from He. In this case, the predicted unshocked Fe 2 fraction would be , with a lower limit of , which is satisfactory. To achieve this relatively high level of Fe ionization requires that there be little soft x-ray emission from heavy elements. It is not clear whether this is possible, given the observed x-ray emission from oxygen and silicon (Koyama et al. 1995).
Thus the low ionization state of unshocked Si inferred in this paper is difficult to reconcile with the expected presence of several tenths of a solar mass of Fe at velocities . Is it possible that the unshocked Si is substantially more ionized than we have inferred? From Tables 1 and 3, the total column densities of Si ions, shocked and unshocked, are in the ratio
| (28) |
If the ionization state of the unshocked Si were this high, then a high ionization state of Fe would be allowed, and the problem would be resolved. In fact, in photoionization trials similar to those described by HF88, we find that the unshocked Si fractions predicted by the CDTG7 model are close to the ratio (28).
However, in subsection 2.6 we argued both theoretically and from the observed line profiles that most of the observed Si 3 and Si 4 absorption is from shocked Si. Might this be wrong, and could in fact much or most of the absorption be from unshocked Si? And is then our interpretation of the Si 2 1260 Å profile as arising mostly from shocked Si 2 also faulty? If so, then much of the tapestry of reasoning in this paper begins to unravel. For example, we must regard as merely coincidental the agreement, found in subsection 2.2, of the measured parameters of the Si 2 1260 Å profile with the energy shock jump condition, equations (4)-(6). We must also conclude that the observed asymmetry between the red and blueshifted Si absorption arises from asymmetry in the initial explosion, not (or not all) from asymmetry in the ambient ISM. For if the blue edge of the redshifted Si 2 and Si 4 features (the blue edge of redshifted Si 3 is obscured by Ly ) arises from unshocked Si extending down to velocities (see Figs. 1 and 3), then there should be, on the assumption of spherical symmetry, corresponding blueshifted Si absorption outward of , which is not seen.
3.6 Where’s the iron?
Höflich & Khokhlov’s (1996) Table 1 presents a survey of 37 SN Ia models, encompassing all currently discussed explosion scenarios. In their models, the ejected mass of , which decays radioactively to iron, ranges from to . Models yielding ‘acceptable’ fits to the sample of 26 SN Ia considered by Höflich & Khokhlov have ejected masses of - for normal SN Ia, and - for subluminous SN Ia. In the subluminous models, a comparable amount of Fe is ejected along with the (Höflich, Khokhlov & Wheeler 1995), so the total iron ejected in these cases is -.
In the previous subsection, we argued that the low ionization state of unshocked Si inferred from the present observations suggests that the ionization state of unshocked Fe is also likely to be low. Specifically, if the unshocked Si 2 fraction is , from Table 1, then the predicted unshocked Fe 2 fraction is . Correcting the Fe 2 mass of up to , equation (26), for the ionization state of the Fe yields a total inferred Fe mass of up to , with a upper limit of . These Fe masses are lower than predicted by either normal or subluminous models of SN Ia.
A low ionization state of Fe is supported by the HUT observations of Blair et al. (1996), who looked for Fe 3 1123 Å absorption in the background SM star. If there is a large mass of Fe in SN1006, significantly larger than the observed Fe 2 mass, then certainly Fe 3 should be more abundant than Fe 2, and from detailed models HF88 predicted . Blair et al.’s best fit is , and their upper limit is . This result does not support, though it does not yet definitely exclude, HF88’s prediction.
Neither of the above two observational evidences favoring a low ionization state of Fe, hence a low mass of Fe in SN1006, is yet definitive. To settle the issue will require re-observation of the Fe 3 1123 Å line at a higher signal to noise ratio. The Far Ultraviolet Space Explorer (FUSE) should accomplish this.
4 Worries
In this paper we have attempted to present a consistent theoretical interpretation of the broad Si and Fe absorption features in SN1006. While the overall picture appears to fit together nicely, the pieces of the jigsaw do not fit perfectly everywhere. In this Section we highlight the ill fits.
What causes the discrepancy between the profiles of the redshifted Si 2 1260 Å and Si 2 1527 Å features? This discrepancy was originally pointed out and discussed for the IUE data by Fesen et al. (1988), and the discrepancy remains in the HST data (WCHFLS96). The discrepancy is especially worrying for the present paper because the excess in the Si 2 1260 Å profile compared to Si 2 1527 Å (see WCHFLS96, Figure 2) looks a lot like what we have interpreted here as the unshocked component of the Si 2 1260 Å absorption (Figure 1).
We have argued that the redshifted Si 2, Si 3, and Si 4 absorption is caused mostly by shocked Si, yet it is not clear that the observed relative column densities are naturally reproduced in collisionally ionized gas. Specifically, one might expect relatively more Si 3, or relatively less Si 2 or Si 4 in the shocked Si. On the other hand the observed relative column densities of Si are naturally reproduced in unshocked, photoionized gas. Is our interpretation at fault?
The best fit dispersion of the redshifted Si 4 feature, Figure 3, is , which is larger than that of the Si 2 1260 Å feature, . What causes this discrepancy?
Does the density of shocked Si vary a little or a lot? In subsection 2.1 we argued that the Gaussian profile of the shocked Si suggests little temperature variation, hence little density variation. On the other hand the unshocked Si density profile below (Fig. 1) suggests a density profile increasing steeply outwards, and there are other clues hinting at the same thing: the large column density of shocked Si 2, subsection 2.5, and the need for a high density to ionize Si on the near side above Si 4, subsection 2.9. Is there an inconsistency here?
In subsection 2.5 we argued that the high observed column density of shocked Si 2 indicates a low mean electron to Si 2 ratio, , equation (14). Higher ratios would cause more rapid collisional ionization of Si 2, reducing the column density below what is observed. This limit on the electron to Si 2 ratio is satisfactory as it stands (the limit is somewhat soft, and at least it is not less than 1), but it is uncomfortably low, making it difficult to admit even modest quantities of other elements, such as sulfur, which might be expected to be mixed with the silicon. Is there a problem here, and if so have we perhaps overestimated the contribution of shocked compared to unshocked Si in the Si 2 absorption?
In subsection 2.9 we estimated that if the reverse shock on the near side of SN1006 is at , then under a ‘simplest’ set of assumptions there should be an observable column density of blueshifted Si 4, contrary to observation. However, we also showed that the predicted column density is sensitive to the assumptions, and that it is not difficult to bring the column density of Si 4 below observable levels. Is this explanation adequate, or does the absence of blueshifted Si absorption hint at asymmetry in the supernova explosion?
Is the sharp blue edge on the Fe 2 features at real? Further observations of the Fe 2 features at higher resolution would be helpful in deciding this issue.
Notwithstanding our reanalysis of the Fe 2 features, there remains some suggestion of high velocity blueshifted absorption outside , perhaps to or even farther, Figures 5 and 6. Is this absorption real? If so, then the arguments of subsection 2.8 fail, and the absence of blueshifted Si absorption must be attributed to intrinsic asymmetry in the initial supernova explosion.
Finally, there is the problem discussed in subsection 3.6: where is the iron?
5 Summary
We have presented a consistent interpretation of the broad Si and Fe absorption features observed in SN1006 against the background SM star (Schweizer & Middleditch 1980).
We have argued that the strong redshifted Si 2 1260 Å absorption feature arises from both unshocked and shocked Si, with the sharp red edge of the feature at representing the free expansion radius of the reverse shock on the far side of SN1006, and the Gaussian blue edge signifying shocked Si (Fig. 1). Fitting to the Si 2 1260 Å line profile yields three velocities, the position of the reverse shock, and the velocity and dispersion of the shocked gas, permitting a test of the energy jump condition for a strong shock. The measured velocities satisfy the condition remarkably well, equations (4)-(6). The Si 2 1260 Å line thus provides direct evidence for the existence of a strong shock under highly collisionless conditions.
The energy jump condition is satisfied provided that virtually all the shock energy goes into ions. This evidence suggests little or no collisionless heating of electrons in the shock, in agreement with recent evidence from UV line widths and strengths (Raymond et al. 1995; Laming et al. 1996).
The observed column density of shocked Si 2 is close to the column density expected for steady state collisional ionization behind a shock, provided that the electron to Si 2 ion ratio is low. From the low electron to Si 2 ratio, we have argued that the shocked Si is probably of a fairly high degree of purity, with little admixture of other elements. More directly, the absence of Fe 2 absorption with the same line profile as the shocked Si indicates that there is little Fe mixed with the shocked Si. On the other hand, there is some indication of absorption by Fe 2 at the velocity 5600- of the unshocked Si 2, which suggests that some Fe is mixed with Si in the lower velocity region of the Si layer.
We have proposed that the ambient interstellar density on the far side of SN1006 is anomalously low compared to the density around the rest of the remnant, so that the remnant bulges out on the far side (Fig. 7). This would explain several observational puzzles. Firstly, it would explain the absence of blueshifted Si absorption matching the observed redshifted Si absorption. If the interstellar density on the near side is substantially larger than on the far side, then the reverse shock on the near side would be further in, so that all the Si on the near side could have been shocked and collisionally ionized above Si 4, making it unobservable in absorption. Secondly, if the velocity on the far side is anomalously high because of the low interstellar density there, it would resolve the problem noted by Wu et al. (1983) and subsequent authors of how to fit gas expanding at within the confines of the interstellar shock. Thirdly, a low density on the far side would explain how the velocity of shocked Si there could be so much higher than the velocity (assuming no collisionless electron heating) of gas behind the interstellar shock along the NW filament (Smith et al. 1991; Raymond et al. 1995). Finally, the density of Si on the far side inferred from the Si absorption profiles is one or two orders of magnitude too low to yield Si x-ray emission at the observed level (Koyama et al. 1995). Again, an anomalously low density on the far side is indicated.
The notion that the reverse shock on the near side has moved inward much farther, to lower velocities, than on the far side conflicts with our earlier conclusion (WCFHS93) that there is blueshifted Fe 2 absorption to velocities . Reanalyzing the Fe 2 data, we find that the evidence for such high velocity blueshifted Fe 2 absorption is not compelling. In the WCFHS93 analysis, the main evidence for high velocity blueshifted Fe 2 comes from the Fe 2 2383, 2344, 2374 Å feature. However, the 2344 Å component, which lies at relative to the principal 2383 Å component, confuses interpretation of the blue wing of the feature. The Fe 2 2600, 2587 Å feature is cleaner, and it shows a sharp blue edge at , which we interpret as representing the free expansion radius of the reverse shock on the near side of SN1006. In our reanalysis of the Fe 2 features, we adopt a rigorous approach to the subtraction of narrow interstellar and stellar lines, requiring that lines subtracted have the correct positions and dispersions, and have mutually consistent strengths. In particular, we subtract the narrow Fe 2 2344 Å line with a strength consistent with the other narrow Fe 2 lines, which strength is substantially greater than the apparent strength. Subtraction of this line introduces a sharp blue edge on the deconvolved Fe 2 2383, 2344, 2374 Å feature at the same place, , as the Fe 2 2600, 2587 Å feature. The resulting deconvolved Fe 2 profiles (Fig. 5) are in good agreement with each other.
The mass and velocity distribution of Si and Fe inferred in this paper provides useful information for modeling the remnant of SN1006 (see Fig. 6). Freely expanding unshocked Si on the far side extends from a low velocity of up to the position of the reverse shock at . Above this velocity the Si is shocked, and information about its detailed velocity distribution before being shocked is lost. The total mass of Si, both unshocked and shocked, inferred from the Si 2, Si 3, and Si 4 lines is , on the assumption of spherical symmetry.
We have argued that the observed broad Fe 2 absorption arises almost entirely from unshocked freely expanding Fe. The mass of Fe 2 inferred from the cleaner, red side of the mean Fe 2 profile is up to , and up to , again on the assumption of spherical symmetry. These masses include a small positive adjustment () resulting from the offset of the SM star from the projected center of the remnant.
Our analysis of the Si lines indicates a low ionization state for the unshocked silicon, with Si 2/Si = . Such a low state would imply a correspondingly low ionization state of unshocked iron, with Fe 2/Fe = . If this is correct, then the total mass of Fe up to is with a upper limit of . The absence of Fe 2 absorption with a profile like that of the shocked Si 2 suggests that there is not much more Fe at higher velocities. Such a low mass of Fe conflicts with the expectation that there should be several tenths of a solar mass of Fe in this suspected Type Ia remnant. A low ionization state of Fe and a correspondingly low Fe mass is consistent with the low Fe 3/Fe 2 ratio measured by Blair et al. (1996) from HUT observations of the Fe 3 1123 Å line in the spectrum of the SM star. However, neither the present observations nor the HUT data are yet conclusive.
Re-observation of the Fe 3 1123 Å line at higher signal to noise ratio with FUSE will be important in determining the ionization state of unshocked Fe in SN1006, and in resolving the question, Where’s the iron?
Acknowledgements.
We would like to thank Bill Blair for helpful correspondence on the HUT data, and Graham Parker and Mike Shull for advice on respectively stellar and interstellar lines. Support for this work was provided by NASA through grant number GO-3621 from the Space Telescope Science Institute, which is operated by AURA, Inc., under NASA contract NAS 5-26555.Appendix A Ionization times in non-steady state
This Appendix demonstrates the assertion made in subsection 2.5, that the column density per interval of ionization time is reduced compared to the steady state value if the density of shocked gas increases downstream, and vice versa. The main result is equation (35).
Define a collisional ionization time (not to be confused with optical depth) by the integral over time of the number density in a Lagrangian gas element, from the time when the gas element was first shocked, to the present time :
| (29) |
The density in the definition (29) of the ionization time is the ion density. One might think to use the electron density rather than the ion density, since the collisional ionization is by electron impact, but in fact the electron to ion ratio is itself determined by the ionization time, for any given initial ionization state, so there is no loss of generality in the definition (29).
It is useful to regard the shock age as a Lagrangian coordinate labeling different gas elements. Then the ionization time of different gas elements at fixed time varies according to
| (30) |
where is the postshock density at the time the gas was shocked. The minus sign in front of reflects the fact that gas elements farther downstream were shocked at earlier times. If the pressure is spatially constant, which should be a good approximation, and if the gas density varies adiabatically as the pressure changes in time, then the densities in different elements vary with time in proportion to each other. It follows that the logarithmic derivative of density with respect to the Lagrangian coordinate is independent of time. It is convenient to denote this dimensionless logarithmic derivative by :
| (31) |
which is positive if the density at fixed time increases downstream. Then equation (30) becomes
| (32) |
Now consider the column density contributed by gas elements shocked at different times . The rate at which mass of ions mass enters the shock at time , when the shock radius is , is
| (33) |
the postshock density being 4 times the preshock density for a strong shock, . The minus sign here arises because we choose to label the interior mass so that it increases downstream of the shock, in the direction of decreasing . Mass is conserved in Lagrangian elements, and the column density at time when the shock radius is varies with as
| (34) |
which is diluted by the geometric factor compared to the column density at the time when the gas was shocked.
Comparing the column density (34) to the ionization time (32) shows that the column density per interval of ionization time observed at a time is
| (35) |
which is the principal result of this Appendix. In steady state, equation (35) reduces to . Compared to steady state, the non-steady state column density per unit ionization time (35) thus contains two factors discussed in subsection 2.5, the geometric dilution factor , and the density profile factor . Since and are always positive, this latter factor is less than or greater than one depending on whether , equation (31), is greater than or less than zero. In other words, if the density increases downstream, , then the column density is reduced compared to steady state, and vice versa, as was to be proved.
References
- [1]
- [2] Arnett D., & Livne E., 1994, ApJ, 427, 330
- [3]
- [4] Becker R. H., Szymkowiak A. E., Boldt E. A., Holt S. S., & Serlemitsos P. J., 1980, ApJ, 240, L33
- [5]
- [6] Blair W. P., Long K. S., & Raymond J. C. 1996, ApJ, 468, 871
- [7]
- [8] Bruhweiler F. C., Kondo Y., & McCluskey G. E. 1981, ApJS, 46, 255
- [9]
- [10] Cardelli J. A., Clayton G. C., & Mathis J. S. 1989, ApJ, 345, 245
- [11]
- [12] Chevalier R. A., Blondin J. M., & Emmering R. T. 1992, ApJ, 392, 118
- [13]
- [14] Fesen R. A., & Hamilton A. J. S. 1988, in A Decade of UV Astronomy with IUE. ESA SP-281, Vol. 1, p. 121
- [15]
- [16] Fesen R. A., Wu C.-C., Leventhal M., & Hamilton A. J. S. 1988, ApJ 327, 164
- [17]
- [18] Galas C. M. F., Venkatesan D., & Garmire G. 1982, ApJ, 22, 103
- [19]
- [20] Garcia-Senz D., & Woosley S. E. 1995, ApJ, 454, 895
- [21]
- [22] Hamilton A. J. S., & Fesen R. A. 1988, ApJ, 327, 178 (HF88)
- [23]
- [24] Hamilton A. J. S., & Sarazin C. L. 1984, ApJ, 287, 282
- [25]
- [26] Hamilton A. J. S., Sarazin C. L., & Szymkowiak A. E. 1986, ApJ, 300, 698
- [27]
- [28] Hamilton A. J. S., Sarazin C. L., Szymkowiak A. E., & Vartanian M. H. 1985, ApJ, 297, L5
- [29]
- [30] Höflich P., & Khokhlov A. 1996, ApJ, 457, 500
- [31]
- [32] Khokhlov A., 1995, ApJ, 449, 695
- [33]
- [34] Kirshner R. P., Winkler P. F., & Chevalier R. A. 1987, ApJ, 315, L135
- [35]
- [36] Koyama K., Petre R., Gotthelf E. V., Hwang U., Matsuura M., Ozaki M., & Holt S. S. 1995, Nature, 378, 255
- [37]
- [38] Laming J. M., Raymond J. C., McLaughlin B. M., & Blair W. P. 1996, ApJ, in press
- [39]
- [40] Lennon M. A., Bell K. L., Gilbody H. B., Hughes J. G., Kingston A. E., Murray M. J., & Smith F. J. 1988, J. Phys. Chem. Ref. Data, 17, 1285
- [41]
- [42] Livne E. 1993, ApJ, 406, L17
- [43]
- [44] Long K. S., Blair W. P., & van den Bergh S. 1988, ApJ, 333, 749
- [45]
- [46] Minkowski R. 1966, AJ, 71, 371
- [47]
- [48] Moffet D. A., Goss W. M., & Reynolds S. P. 1993, AJ, 106, 1566
- [49]
- [50] Morton D. C. 1991, ApJS, 77, 119
- [51]
- [52] Niemeyer J. C., & Hillebrandt W. 1995, ApJ, 452, 769
- [53]
- [54] Nomoto K., Thielemann F.-K., & Yokoi K. 1984, ApJ, 286, 644
- [55]
- [56] Raymond J. C., Blair W. P., & Long K. S. 1995, ApJ, 454, L31
- [57]
- [58] Reilman R. F., & Manson S. T. 1979, ApJS, 40, 815
- [59]
- [60] Reynolds S. P. 1996, ApJ, 459, L13
- [61]
- [62] Reynolds S. P., & Gilmore D. M. 1986, AJ, 92, 1138
- [63]
- [64] Reynolds S. P., & Gilmore D. M. 1993, AJ, 106, 272
- [65]
- [66] Savage B. D., & Mathis J. S. 1979, ARA&A, 17, 73
- [67]
- [68] Schaefer B. E. 1996, ApJ, 459, 438
- [69]
- [70] Schweizer F., & Middleditch J. 1980, ApJ, 241, 1039
- [71]
- [72] Smith R. C., Kirshner R. P., Blair W. P., & Winkler P. F. 1991, ApJ, 375, 652
- [73]
- [74] Willingale R., West R. G., Pye J. P., & Stewart G. C. 1996, MNRAS, 278, 749
- [75]
- [76] Woosley S. E., & Weaver T. A. 1987, in IAU Coll. 89, Radiation Hydrodynamics in Stars and Compact Objects, ed. D. Mihalas & K.-H. A. Winkler (Berlin: Springer-Verlag), 91
- [77]
- [78] Wu C.-C., Crenshaw D. M., Fesen R. A., Hamilton A. J. S., & Sarazin C. L. 1993, ApJ, 416, 247 (WCFHS93)
- [79]
- [80] Wu C.-C., Crenshaw D. M., Hamilton A. J. S., Fesen R. A., Leventhal M., & Sarazin C. L. 1996, ApJ Letters, submitted (WCHFLS96)
- [81]
- [82] Wu C.-C., Leventhal M., Sarazin C. L., & Gull T. R. 1983, ApJ, 269, L5
- [83]