An Overview of Blazar Variability
Abstract
Blazars are characterized by rapid variability at virtually all wavelengths from radio through TeV gamma-rays. The challenge since their discovery has been to understand the origin of their luminous, apparently nonthermal, nuclear emission. Considerable progress has been made in recent years thanks to a handful of multiwavelength monitoring campaigns with high enough temporal sampling to resolve the most rapid variations. The best data for a few objects have shown a variety of behaviors, for the most part commensurate with synchrotron and Compton-scattered emission from a relativistic jet, though better data for more blazars are still clearly needed. In particular, the origin of the seed photons that are upscattered to gamma-ray energies remains unclear. The latest multiwavelength light curves for the BL Lac object PKS 2155–304 appear to rule out synchrotron emission from a homogeneous source.
keywords:
blazars, BL Lac objects, multiwavelength spectra, inhomogeneous jets, synchrotron radiation, inverse Compton radiation1 Introduction
Soon after blazars were discovered and identified, they were selected as interesting targets for long-term monitoring programs, by pioneers like Alex Smith among others, because of their extreme characteristics: they were the most variable, the most luminous, the most polarized, and in some sense the most exciting type of Active Galactic Nuclei (AGN). Understanding them at first seemed the key to understanding the AGN phenomenon. Ironically, blazars were eventually perceived as less interesting for the very same reason — because they were so unusual, so the reasoning went, they must not be relevant to the greater body of AGN (i.e., Seyfert galaxies and quasars). Blazar research was seen as a special field and blazars as arcane oddities.
Now in the mid-90s, we have come full circle. Because blazars are rare geometric manifestations of a general phenomenon (assuming they are relativistic jets pointing directly at us; Urry & Padovani 1995), they must be a quite common kind of AGN, and when they are not pointing at us, we simply call them radio galaxies. This makes blazars highly relevant to understanding AGN as a whole. Specifically, the enormous energy of a relativistic jet, its emanation from the vicinity of the putative central black hole, and its high degree of collimation over many orders of magnitude in scale, offer direct clues to the extraction of energy from the black hole. Blazars thus reveal the energetic processes occurring in the very centers of active galaxies, while in the more common radio galaxies, jet radiation (and hence information) is beamed away from us. With blazars, then, the goal is to understand black hole physics through understanding the physics of the jet. This in turn can be deduced from multiwavelength spectral characteristics, most notably correlated variability across the spectrum.
2 Blazars as Relativistic Jets
Here I summarize the arguments for believing blazars are relativistic jets. First, they commonly exhibit superluminal motion (Vermeulen & Cohen 1994; see also Wehrle et al., these Proceedings) which, while it could arise from pattern rather than bulk relativistic velocity, is at least suggestive. Second, blazars can exhibit extremely high brightness temperatures; in at least some cases, intraday variations are observed at optical wavelengths, ruling out an extrinsic (scintillation) explanation for the variability, although the implied bulk Lorentz factors are uncomfortably high (Wagner & Witzel 1995). Third, the characteristically high and variable polarization of blazars is explained naturally by an aligned jet (Smith et al., these Proceedings). Fourth, multiwavelength radio variability is well explained by shocks in a jet (Aller, these Proceedings).
Fifth and most compelling, the strong and variable gamma-ray emission observed in many blazars (Hartman, these Proceedings) implies such a high compactness that the gamma-ray source would inevitably be dominated by pair production unless the emission is relativistically beamed (Dondi & Ghisellini 1995). While there is some uncertainty about the degree of beaming required (it depends on the ambient X-ray photon density, as X-gamma interactions are the most likely pair-production mechanism), the argument for some beaming is fairly tight.
Blazars can be defined in various ways, via their rapid variability, their compact flat-spectrum radio emission, their superluminal motion, their polarization, and now their gamma-ray brightnesses, and in fact these characteristics occur in the same sources. That is, those sources that are superluminal have flat radio spectra and are highly polarized, and so on.111An exception is that some highly polarized quasars (HPQ), largely radio-quiet, have continuum emission polarized by scattering rather than intrinsic processes like synchrotron radiation. These obviously do not have blazar characteristics like superluminal motion or rapid variability. An even more direct link has been seen in at least two cases. Ten years of VLBI maps of 3C 279 (Wehrle et al., these Proceedings) show a new VLBI component being “born” (extrapolating the observed position backward with the observed velocity) at the time of the bright gamma-ray flare in June 1991 (Wehrle et al. 1994). The same phenomenon has been observed in PKS 0528+134 (Pohl et al. 1995). In these two blazars, the production of (beamed) gamma-rays is directly related to superluminal motion of the radio source. That these various blazar characteristics are all closely linked, statistically and in some cases directly, is a strong argument that the underlying cause is relativistic beaming.
3 Multiwavelength Spectra and Monitoring
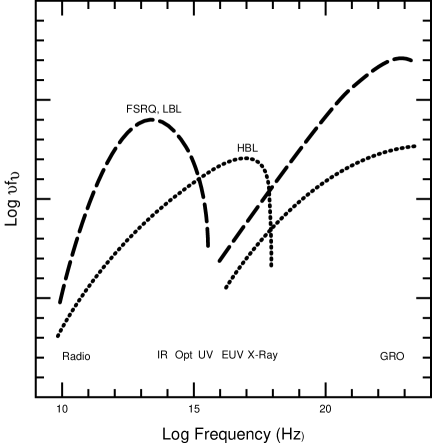
Observations in individual wavebands have established the viability of the relativistic beaming hypothesis for blazars but have led to at best cursory understanding of the physical state of the jet. For this, multiwavelength variability holds the key. Blazar spectra span an extremely broad range of energies, from radio through GeV gamma-rays and perhaps through TeV gamma-rays. The emission consists of two distinct spectral components, a low-energy synchrotron bump and a high-energy Compton-scattered bump (Figure 1).
The temporal evolution of each spectral component and the correlation between them are critical to understanding the underlying emission mechanisms, which is why a number of large multiwavelength monitoring campaigns have been carried out in recent years.
It should be noted that the difficulty of arranging these multiwavelength monitoring observations, typically coordinated among several satellites and many more ground-based telescopes, has kept us from obtaining good data on more than a few of the brightest blazars. More importantly, sensitivity limits have introduced significant target selection effects. Specifically, among BL Lac objects, “High-frequency peaked BL Lacs” (HBL) and “Low-frequency peaked BL Lacs” (LBL) have distinctly different continuum shapes.222The two sub-classes of BL Lac object are defined by their ratio of X-ray to radio flux, which anti-correlates with the wavelength of their peak synchrotron emission. A High-frequency peaked BL Lac (HBL) has (between 5 GHz and 1 keV) less than 0.75, while a Low-frequency peaked BL Lac (LBL) has (Padovani & Giommi 1995). These may indeed be opposite extremes of a continuous distribution because current BL Lac samples come from radio or X-ray surveys with fairly high flux limits and so are naturally dominated by LBL or HBL, respectively. The strong emission-line blazars (i.e., flat-radio-spectrum quasars, or FSRQ), also generally radio-selected, have continua like LBL (Sambruna et al. 1996).
In any case, the spectral energy distributions of HBL and LBL/FSRQ differ in several ways (Fig. 1). The peak wavelength of the synchrotron component is in the infrared-optical band for LBL and FSRQ, whereas it peaks in the extreme ultraviolet to soft X-ray range for HBL. Also, LBL and FSRQ have a higher ratio of gamma-ray to synchrotron flux than the HBL (Sambruna et al. 1996), and most of the EGRET blazars are in fact FSRQ and LBL. Note that the synchrotron emission is most variable above the peak in , where the shortest wavelength component becomes optically thin (Ulrich, Maraschi, & Urry 1996).
Only two blazars, Mrk 421 and Mrk 501, both HBL, have been detected at TeV energies (Punch et al. 1992, Quinn et al. 1996). It may be that these particular objects were detected because they are relatively nearby ( in both cases) so that the ultra-high-energy gamma-rays have little path length along which to produce pairs via scattering of intergalactic microwave photons, but it is probably also significant that the peak Compton emission in HBL is likely at much higher energies than in LBL/FSRQ. The luminosity represented by the extension of the blazar spectrum to GeV/TeV energies is phenomenal; clearly, understanding the production of this emission is central to understanding the blazar.
Because of these systematic spectral differences, the observational details of the multiwavelength study dictate the type of blazar studied. To study blazars above the synchrotron peak, where they are most variable, means selecting UV- and X-ray-bright targets, which are inevitably HBL. To study correlated intraday variability at radio and optical wavelengths means selecting LBL/FSRQ. To correlate with GeV gamma-rays, one looks primarily at LBL/FSRQ; to correlate with TeV gamma-rays, one looks instead at HBL. With higher sensitivities, this artificial distinction will disappear, but it is important to remember that as presently observed, the radio-optical intraday variables are systematically different objects than the highly variable UV/X-ray-bright sources.
With multiwavelength monitoring of blazars, there are two critical questions we are in the process of addressing. First, where do the gamma-rays come from, and second, what is the structure of the jet itself? By figuring out what the particle density is, what the magnetic fields are, how each varies along the jet, and what causes flaring behavior, we can ultimately understand what created the jet, how it was formed, and what is happening down at the center where we cannot observe directly. For the rest of this paper, I discuss only two objects, 3C 279 and PKS 2155–304, which illustrate some of the best available data (see also Takahashi et al., these Proceedings) and thus the limits of what we can learn about blazars at this point.
4 Multi-Epoch Flaring in the Superluminal Quasar 3C 279
3C 279 is the brightest gamma-ray blazar in the sky. [During the week of the Miami blazar meeting, it was undergoing a major outburst, rising an order of magnitude above its previous highest gamma-ray state, with substantial variations at other wavelengths.] Figure 2 shows the broad-band spectra at two epochs, the high state in June 1991 when it was first discovered and a low state in January 1994; the greatest change in intensity occurs at gamma-ray wavelengths, with lesser but still substantial variations at UV and X-ray wavelengths, and little change at radio to sub-millimeter wavelengths (Maraschi et al. 1994).

Note that the gamma-ray flux can dominate the bolometric luminosity, particularly in the flare state. Maraschi et al. (1994) suggested that the larger increase in gamma-rays relative to synchrotron emission was consistent with the synchrotron self-Compton (SSC) model, although a change in Doppler factor of the jet or concurrent increases in seed photons and scattering electrons could also cause the observed variability. Clearly, sampling these flares more finely is critical to identifying the origin of the seed photons and thus the production of the dominant spectral component. The multiwavelength observations of the 1996 flare should help resolve the ambiguity about the identity of the seed photons (Wehrle et al., in preparation).
The basic blazar models currently under consideration have one common element, a synchrotron-emitting jet filled with energetic electrons and perhaps positrons. In addition, there may be ambient UV and X-ray emission from the vicinity of an accretion disk, and broad-line emission from clouds farther out, photoionized either by the central UV/X-ray source or by the jet itself. The debate turns on which photons are Compton-scattered to gamma-ray energies. Photons impinging on the jet from the side are boosted in the frame of the jet electrons, and so constitute a very intense flux of seed photons even when the directly observed non-jet UV/X-ray flux is low.
Ghisellini and Madau (1996) present a nice comparison of the principal ideas (see references therein as well) and conclude two interesting points. One is that the inner part of the jet has to be dissipationless. If the energy density of gamma-rays in an optically thick inner region of the jet were high, there would probably be enough local UV photons to generate a pair cascade, transferring much of the gamma-ray energy into X-rays, contrary to what is observed. So the principal mode by which energy is transferred from the black hole to the jet must not be via energetic photons. The second point is that, for plausible numbers, the illumination of the broad-line clouds by the beamed continuum can be an important contribution to the UV flux impinging on the jet. The bulk of the gamma-rays could therefore come from scattered broad-line photons which were photoionized by the jet itself. This might be the dominant mechanism in FSRQ, say, while SSC emission dominates in the weaker-lined HBL.
It would be extremely interesting to monitor simultaneously the variability of the broad lines and the synchrotron continuum. As far as I am aware this has not yet been done, at least with sufficient sampling. We have looked at the archival UV data for 3C 279 (Koratkar et al. 1996) but even there, with a very well-observed source, the data are not sufficient to determine the photoionization source unambiguously. The 1996 campaign on 3C 279 will help and there are a number of other blazar campaigns planned for the upcoming year which may contribute to solving this problem. Unfortunately, the loss of IUE, with its long, sustained monitoring campaigns, is a major blow for this kind of study.
5 Multiwavelength Variability of the HBL PKS 2155–304
PKS 2155–304 is the brightest BL Lac object at ultraviolet wavelengths and one of the brightest in the X-ray as well. So it is the obvious choice for UV/X-ray monitoring. It is an HBL, with peak synchrotron emission near Hz, which is four orders of magnitude higher in frequency than the peak synchrotron emission in 3C 279. We have every reason to expect, therefore, that the physics of the emission from PKS 2155–304 and 3C 279 differ in significant ways.
There have been two intensive multiwavelength campaigns to observe PKS 2155–304. [There was a third three months after the Miami blazar meeting.] The first was in November 1991 and lasted for one month. At that time, no one even knew whether the UV and X-ray emission were related, nor what the fastest time scale for variability was. We observed PKS 2155–304 with IUE once per day throughout November 1991 (thinking that was probably overkill) and then in the middle of the month, at the insistence of Rick Edelson (who rightly realized it was not overkill), we observed it for nearly 5 days continuously. The UV variations we detected were indeed fast enough that the daily sampling was insufficient and only the continuous observations were useful for multiwavelength cross-correlations (Urry et al. 1993). We also had days of continuous X-ray observations (Brinkmann et al. 1995) overlapping with most of the intensive UV coverage, as well as considerable ground-based radio, infrared, and optical observations (Smith et al. 1992, Courvoisier et al. 1995).
Results from the November 1991 campaign are shown in Figure 3.

The X-ray, UV, and optical light curves are well-correlated, arguing for a common origin of the optical through X-ray emission, and the X-rays lead the UV by -3 hours (Edelson et al. 1995). The optical/UV emission can not be produced by thermal emission from a viscous accretion disk because they should arise at very different radii, implying a large lag between the two. The amplitude of variation is independent of wavelength, a result contrary to what is expected from a synchrotron flare caused by an increase in energetic electrons (Celotti, Maraschi, & Treves 1991).
Several aspects of the 1991 results were intriguing enough to inspire us to repeat the experiment for a longer period and with more extensive wavelength coverage. First, the light curves consisted of a series of peaks modulated by an overall decline in flux; while not strictly periodic (Edelson et al. 1995), they suggested possible repetition through five cycles. Second, the UV and X-ray light curves, which tracked very well for most of the observation, appeared to diverge at the very end of the overlapping period.
We therefore arranged a second intensive monitoring campaign in May 1994, with IUE for 10 days continuously (Pian et al. 1996), EUVE for 9 days (Marshall et al., in prep.), and ASCA for 2 days (Kii et al., in prep.), and with additional Rosat (Urry et al. 1996) and ground-based data (Pesce et al. 1996). Figure 4 shows the results from this second set of multiwavelength observations of PKS 2155–304 (Urry et al. 1996).

A very sharp flare is seen in X-rays, followed by an EUV flare one day later and a broader, lower amplitude UV flare two days later. The X-ray flux doubles in days and is approximately symmetric. The Rosat data, while sparse, show that large X-ray flares were not unusual but were occurring throughout the week prior to the ASCA observations. The EUV flux increased by % in less than a day (the time scale is difficult to estimate given the errors and the untimely end of the data train), and the UV flux rose by % with a doubling time scale of days. The duration of the flare increases from less than a day in the X-rays to nearly 4 days in the UV.
The delays between X-ray, EUV, and UV light curves are easily measured with cross-correlation functions. Formally, the EUV flux leads the UV by 1.1 days and the X-ray flux leads the UV by 2.0 days. The cross-correlation between IUE and ASCA light curves is shown in Figure 5; the cross-correlation of X-ray versus EUV light curves is not well defined due to the small temporal overlap. (Fig. 5).

The IUE data also reveal a complex and extremely rapid flare at the beginning of the observation, with doubling times as fast as 1 hour, the fastest ever observed at ultraviolet wavelengths and comparable to the fastest doubling times seen in the X-ray (Pian et al. 1996). The event is seen in both LWP and SWP cameras, and is undersampled by both; it has larger amplitude in the LWP in part because the LWP integration times are less than half the SWP integration times. It is also possible to see similar structure in the EUV light curves, although the EUVE data are relatively noisy, -2 days in advance of the IUE event.

Figure 6 shows an expanded view of the EUVE and IUE light curves, with the EUVE curve shifted forward by 1.25 days.
There are strong differences between the May 1994 and November 1991 light curves of PKS 2155–304. In the second epoch, the amplitude and duration depend strongly on wavelength and the lags are considerably longer than in the first. In addition, there is little of the low-amplitude repetitive variability, at least in the first half of the IUE observation. These differences mean either that there are two different mechanisms operating or that the relevant physical parameters have changed considerably. The variability in 1991 was probably not a synchrotron flare, since the observed time scales were energy independent. Instead, it is possible that it was caused by microlensing: for a dense star cluster at the redshift of a known Lyman-alpha absorption system (about half way to the BL Lac), and assuming relativistic motion of the BL Lac jet, the amplitudes and time scales are approximately correct, and the achromatic nature is automatic as long as the source size is independent of wavelength. This is a plausible but not proven explanation.
The 1994 data are much richer in extent and wavelength coverage. These data are consistent with a synchrotron flare in a jet but the clear delay between X-ray and UV flares rules out the homogeneous case (Urry et al. 1996). The reasoning is as follows. The simplest causes of a flare in the homogeneous case would be a sudden uniform increase in the injection of energetic electrons or the instantaneous and uniform enhancement of the magnetic field, perhaps via compression of a charged plasma. In both cases, the flux at all (optically thin) wavelengths would rise simultaneously, with amplitude increasing with decreasing wavelength, while the duration of the flare (if due to energy losses only) would go as . That is, the long-wavelength emission would last longer than the short-wavelength emission but the (instantaneous) peaks in the light curves would be simultaneous. The delay in the flare onset and the longer rise time for the UV flare compared to the X-ray flare clearly rule out the simplest homogeneous case, unless ad hoc dependences on time and energy of the injection rate are postulated.
Thus, some energy stratification of the synchrotron-emitting plasma is required, either behind a shock or in the jet structure itself. The X-ray decay is faster than the UV but perhaps by less than a factor , suggesting the decay is dominated by geometry rather than synchrotron losses. The flare duration increases with wavelength, possibly indicating that the size of the emitting region is increasing with wavelength. The observed lags are also comparable to the flare durations. Both these results are as expected for a shock propogating outward in an inhomogeneous jet, successively passing from X-ray- to EUV- to UV-emitting regions.
6 Future Multiwavelength Monitoring
As this review has shown, the best available data are still insufficient for determining jet structure but enough to indicate the kind of data needed. We should repeat the kind of multiwavelength monitoring done for PKS 2155–304 for many more blazars, including LBL, which will require a new ultraviolet capability. We also need to study further the correlation of gamma-ray and optical/IR variability. In all cases, long and intensive time sampling is critical: two light curves that are well correlated could, if sampled at few points or for less time than the characteristic lag, appear uncorrelated. Thus the single epoch approach is no longer valuable for adding information. The requirement for intensive monitoring and for larger samples of objects points to the need for a multiwavelength platform with modest, very simple, very inexpensive optical/UV telescopes paired with X-ray and gamma-ray detectors.
Acknowledgements.
I am grateful to my many collaborators for their contributions to our multiwavelength monitoring of blazars, particularly those with whom I have worked most closely in recent years, Laura Maraschi, Joe Pesce, Elena Pian, Rita Sambruna, Aldo Treves, and Ann Wehrle, and those who were PIs for the second campaign on PKS 2155–304, Tsuneo Kii, Herman Marshall, and Greg Madejski.Question 6.1.
Al Marscher In the 1994 PKS 2155–304 flare, you say that the fast rise is from the time scale for particle acceleration but that the slower decay is geometric. Light travel effects should limit the shorter time scale, not the longer. Also I disagree that the longer time scales and lags at lower frequencies require gradients in the underlying jet to be the root cause: shocks should be frequency-stratified and give the behavior you observe (Marscher, Gear & Travis 1992, in Variability of Blazars).
Meg Urry You are right about the geometric limit for the fastest time scale. We agree that the jet needs to be inhomogeneous. Whether the inhomogeneity arises from the natural stratification due to energy-dependent losses and diffusion from a shock, or from some other means, is not known at this point.
Question 6.2.
Hugh Aller I am worried about involving different physical processes to explain two different flare events (1991 versus 1994) in PKS 2155–304. Isn’t a single process which permits both events to be explained ultimately simpler?
Meg Urry I can see how it would seem that way but frankly, the character of the variations in 1991 and in 1994 is so different that the required change in parameters of the single process you might prefer is more or less equivalent to a distinct process. If, for example, we decide that the 1994 flares are the signature of a shock propagating through an inhomogeneous jet, with the expected dependence of amplitude on wavelength and delays of day from X-rays to EUV to UV-emitting regions, then how can this model explain the 1991 variability, with its achromaticity and negligible lags? In a sense these are opposite behaviors, which naturally suggest unrelated causes.
References
- [1] rinkmann, W., et al. 1994, A&A, 288, 433
- [2] elotti, A., Maraschi, L., & Treves, A. 1991, ApJ, 377, 403
- [3] ourvoisier, T. J.-L., et al. 1995, ApJ, 438, 108
- [4] ondi, L., & Ghisellini, G. 1995, MNRAS, 273, 583
- [5] delson, R. A., et al. 1995, ApJ, 438, 120
- [6] hisellini, G., & Madau, P. 1996, MNRAS, 280, 67
- [7] oratkar, A., Pesce, J. E., Urry, C. M., & Pian, E. 1996, in preparation
- [8] araschi, L., et al. 1994, ApJ, 435, L91
- [9] adovani, P., & Giommi, P. 1995, ApJ, 444, 567
- [10] esce, J. E., et al. 1996, ApJ, submitted
- [11] ian, E., et al. 1996, ApJ, submitted
- [12] ohl, M. et al. 1995, A&A, 303, 383
- [13] unch M., Akerlof C. W., Cawley M. F., Chantell M. ., Fegan D. J., Fennell S., Gaidos J. A., Hagan J., Hillas A. M., & Jiang Y. 1992, Nature, 358, 477
- [14] uinn J., et al. 1996, ApJ, 456, L83
- [15] ambruna R., Maraschi L., & Urry C. M. 1996, ApJ, 463, 444
- [16] mith, P. S., Hall, P. B., Allen, R. G., & Sitko, M. L. 1992, ApJ, 400, 115
- [17] lrich, M.-H., Maraschi, L., & Urry, C. M. 1996, ARAA, in preparation
- [18] rry, C. M., et al. 1993, ApJ, 411, 614
- [19] rry, C. M., et al. 1996, ApJ, submitted
- [20] rry, C. M., & Padovani, P. 1995, PASP, 107, 803
- [21] ermeulen R., & Cohen M. 1994, ApJ, 430, 467
- [22] agner S., & Witzel A. 1995, ARA&A, in press
- [23] ehrle, A. E., Zook, A. C., Unwin, S. C., Urry, C. M., & Madejski, G. 1994, in The Multi-Mission Perspective (High Energy Astrophysics Division Meeting of the American Astronomical Society, Napa Valley, November 1994), p. 27
- [24]