06 (02.01.2; 08.02.3; 13.25.5)
Greiner, jcg@mpe-garching.mpg.de
ROSAT observation of GRS 1739–278
Abstract
We have observed GRS 1739–278 with the ROSAT HRI on March 31, 1996. The improved X-ray position proves the identification with an earlier discovered variable radio source. We derive an extinction of from the dust scattering halo, which implies a distance of d 6–8.5 kpc. Thus, GRS 1739–278 radiates at least near the Eddington limit for a 1 M⊙ compact object.
The existence of the dust scattering halo necessitates a prolonged X-ray activity period prior to the ROSAT observation. Combined with the non-detection by Granat during an earlier galactic center observation, we speculate that the X-ray turn-on of GRS 1739–278 happened in Nov./Dec. 1995.
keywords:
X-rays: stars – binaries: general – black hole candidate – stars: individual: GRS 1739–2781 Introduction
A new X-ray transient (GRS 1739–278) was discovered by the SIGMA instrument onboard Granat on March 18, 1996 (Paul et al. 1996) at a level of 80 mCrab in the 40–75 keV range. The source was detected also in an observation taken already on March 16.8 UT showing that the source turned on earlier. GRS 1739–278 was also detected with the TTM experiment on the Mir-Kvant Space Station as early as February 28 as a bright source (200 mCrab in the 2–27 keV range) rising to 200 mCrab on March 1, 1996 (Borozdin et al. 1996).
GRS 1739–278 was also observed with the Proportional Counter Array (PCA) on RXTE on March 31.754–31.862 UT and found at 490 mCrab in the 2–60 keV range (Takeshima et al. 1996). Using slew data taken on other occasions, the following flux values were also reported: 810 mCrab on March 16, 430 mCrab on March 22 and 300 mCrab on April 21. No oscillations were found with periods between 0.002 and 256 sec.
Subsequent radio observations at the VLA of the 1′ radius TTM X-ray error box (Borozdin et al. 1996) revealed a variable radio source at R.A. = 17h42m4003, Decl.=–27∘44′52′′ as a probable counterpart (Hjellming & Rupen 1996).
During the writing of this letter, the discovery of the optical and infrared counterpart of the radio source is reported at R = 20.5 mag, J = 16.0 mag and K = 14.7 mag (Mirabel et al. 1996).
Here, we report the results of a short ROSAT target of opportunity observation of GRS 1739–278.
2 Observational results
2.1 Position and Intensity
GRS 1739–278 was observed with the ROSAT high resolution imager (HRI) on March 31.142, 1996 for a total of 620 sec, and was clearly detected at 1′ off-axis angle. The best fit position (2000.0) of GRS 1739–278 from this ROSAT HRI detection is: R.A. = 17h42m403, Decl. = –27∘44′54′′ with a systematic boresight error of 8′′ and was reported already earlier (Dennerl & Greiner 1996). This centroid X-ray position is only 4′′ off the position of the variable radio source and thus suggests that the latter is indeed the radio counterpart of GRS 1739–278.
Extracting all photons within 1600′′ (see below for the reason) yields, after background subtraction and vignetting correction, a mean HRI count rate of 20 cts/sec.
For the lightcurve reduction a much smaller extraction radius (10′′) has been chosen in order to avoid the dust scattering halo which would smear out temporal variations. Since photons at increasing distances from the central source have travelled longer and thus are emitted earlier any lightcurve of the total detected photons would include an averaging in time of the source intensity. After background subtraction, vignetting and deadtime correction the lightcurve shows no evidence for short-term variability in the 1–200 sec range in excess of a Poisson distribution.
Adopting the spectral fit parameters for the low-energy range (2–15 keV) of the near-simultaneous (14 hours after the ROSAT observations) PCA/RXTE observation (i.e. a powerlaw model with photon index of –4.1 at a normalisation of 0.51 photons/cm2/s at 1 keV which corresponds to 190 mCrab; Takeshima 1996), we have modelled the amount of column density in order to achieve the measured total HRI countrate of 20 cts/s, resulting in NH = (2.60.5)1022 cm-2. This is somewhat below the value of (4.10.7)1022 reported by Borozdin et al. (1996) for the TTM spectral fit of a pure powerlaw model, but they also find a smaller absorbing column for a two component model fit (without specifying the value).
2.2 Dust scattering halo
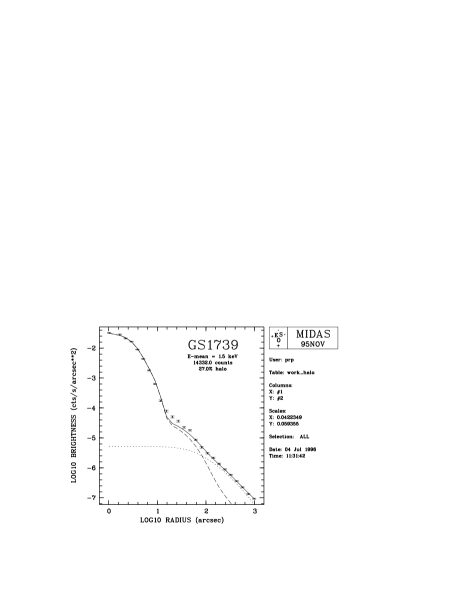
The observed radial profile of GRS 1739–278 in the HRI is considerably wider than the instrument point spread function. This is due to the scattering of the X-rays of GRS 1739–278 by interstellar dust (galactic latitude of bII=12). Since this scattering effect does not alter the number of detected photons, the extraction radius for deducing the total mean count rate was chosen to be as large as possible, i.e. 1600′′ in this case where there is no other source in the field of view. The relative intensity of the halo is 27% at a mean energy E = 1.5 keV (Fig. 1). The fractional halo intensity has been calculated by comparing the measured radial surface brightness distribution with a HRI model point response function and fitting the residual with a model halo (Predehl et al. 1991), using a common powerlaw grain size model (Mathis, Rumpl and Nordsieck 1977) and an uniform dust distribution between observer and source. Since we have no spectral information for each photon in the HRI, we have folded the model (see previous section) through the ROSAT mirror effective area and calculated the mean energy of all photons, as would have been detected with the ROSAT HRI, to be 1.47 keV.
From observations of other X-ray sources having known optical counterparts, correlations of the deduced effective optical depth (1 keV) with the optical extinction (AV/(1 keV)17) and with the hydrogen column density (NH[1021] cm-2/(1 keV)23) have been deduced (Predehl & Schmitt 1995). Applying these relations to GRS 1739–278 results in = 123 or =(1.60.4)1022 cm-2. Given the many uncertainties (not really contemporaneous ROSAT/RXTE measurement, absolute flux calibration of the PCA/XTE, missing information of the energy of each scattered photon in the HRI) this value of is in reasonable agreement with the one derived in section 2.1. In addition, the dust scattering halo intensity corresponds to rather different times of emission from GRS 1739–278 due to the travel time delay (see below), and any variability will result in varying fractional halo intensities. Inspecting the all-sky monitor (ASM) lightcurve of the RXTE satellite shows that the ROSAT observation occurred shortly after a major flare in the 2–10 keV band intensity, and it is thus conceivable that the halo intensity is from a less intense mean state of the source. Consequently, our above estimate of is probably a lower limit. We therefore use for the following and, accordingly, =(2.00.3)1022 cm-2.
2.3 Distance and luminosity
Using a mean extinction along the galactic plane of AV = 1.9 mag/kpc (Allen 1973), the above AV range implies a distance of GRS 1739–278 of about 6–8.5 kpc. The AV contribution towards the galactic center along distance shows a rapid increase within the first 1 kpc but then remains rather flat up to 5 kpc (Neckel & Klare 1980), suggesting the latter number to be a lower limit for the distance of GRS 1739–278.
With the RXTE spectral parameters the unabsorbed flux is 2.810-6 erg/cm2/s corresponding to an unabsorbed luminosity of 1.61040 / (d/7 kpc)2 erg/s (0.1–2.4 keV). This is an extraordinary high value for a galactic X-ray transient. We note that the derivation of the flux and luminosity depends very sensitively on the assumption about the spectral shape at a few keV. For instance, adopting a –3 photon index power law model with NH=2.01022 cm-2 and adjusting the normalisation such that the HRI countrate is reproduced, reduces the unabsorbed flux by a factor of 10. We therefore caution that the –4.1 photon powerlaw fit of the near-simultaneous PCA/RXTE data is an oversimplification, and any intrinsically curved spectral model (like disk blackbody or bremsstrahlung) will reduce the X-ray luminosity drastically compared to the above value. However, it is worth to realize that the estimates of AV and the distance are much less affected than the luminosity estimate.
In order to derive an approximate lower limit for the soft X-ray flux we have assumed a 4 keV bremsstrahlung spectrum (this is taken for simplicity; a 1 keV disk blackbody model gives a similar result) similar to the spectral shape of the high-intensity emission of GRS 1915+105 (Greiner, Morgan and Remillard 1996). We then determine the normalization such that the 2–10 keV flux is identical to the flux obtained with the –4.1 powerlaw model (190 mCrab). The 4 keV bremsstrahlung spectrum with this normalisation is used to model the absorbing column NH necessary to reproduce the observed HRI countrate, leading to a rather small value of NH = 0.91022 cm-2. The resulting minimum unabsorbed flux (e.g. a 4 keV bremsstrahlung extrapolation of the best fit PCA/RXTE spectrum below 2 keV) then follows as 9.110-9 erg/cm2/s (in the 0.1–10 keV range) corresponding to 51037 erg/s at 7 kpc.
2.4 Absolute magnitude of the optical counterpart
Very recently, the optical/IR counterpart has been identified (Mirabel et al. 1996). Using the reddening conversion of Rieke & Lubofsky (1985) with AK = 0.112 AV = 1.50.3 results in an extinction corrected K magnitude of 13.1 mag, and an absolute R, J and K magnitude (at an assumed distance of 7 kpc) of MR, MJ and MK –4.2, –2.1 and –1.1 mag, respectively. We caution that these numbers sensitively depend on AV, e.g. the R–K colour reduces from –3.1 to –1.9 when using our lower bound of AV = 12 instead of 14. These blue colors are difficult to reconcile by a combination of thermal emitters, and do not allow to constrain the companion type. On the contrary, assuming a near-infrared color of the accretion disk similar to those of a hot OB star (R–K=–0.8) implies ER-K = 6.6 or AV = 11, close to our lower bound.
2.5 Estimates of earlier X-ray activity
2.5.1 Archival X-ray observations
During the ROSAT all-sky survey the location of GRS 1739–278 was scanned on Sep. 7/8, 1990 for a total of 330 sec. No emission is detected from GRS 1739–278 giving an upper limit of 0.015 PSPC cts/s.
GRS 1739–278 was serendipitously in the field of view of two earlier ROSAT PSPC observations, namely the galactic center raster pointings (PI: J. Trümper) performed on March 1/2, 1992 (at various off-axis angles ranging from 9′–50′) and a pointing (PI: C. Motch) performed on Sep. 8, 1993. GRS 1739–278 was not detected in both observations, which have effective exposure times at the GRS 1739–278 position of slightly above 1 ksec, thus giving upper limits of 5.110-3 and 7.710-3 PSPC cts/sec for the March 1992 and Sep. 1993 observation, respectively. This is a factor 1.2104 lower than the mean flux on March 31, 1996 (including a PSPC/HRI countrate conversion factor of 3).
2.5.2 The dust halo as a record of earlier X-ray activity
Due to the longer light travel time of the dust scattered X-rays, the halo can be used to determine earlier X-ray activity (Trümper & Schönfelder 1973) of GRS 1739–278. As can be inferred from Fig. 1, the dust scattering halo is observed to beyond 1000′′ and is clearly above the typical HRI background level within the whole field of view. The X-rays observed at 1000′′ off the nominal position of GRS 1739–278 have a travel time which is longer than that of the unscattered emission (assuming homogeneous distribution of dust along the line of sight) by
Shorter timescales are reached only if the X-rays are scattered by very local dust. For instance, assuming scattering only within 1 kpc around the Sun, the delay would be 15 days (again for 7 kpc nominal distance and 1000′′). Given the previous notation that GRS 1739–278 went into outburst at the end of February 1996, the mere existence of a dust scattering halo extending over the whole HRI field of view is therefore surprising. There are two alternative explanations: (1) The observed halo is exclusively due to scattering at local dust or (2) The X-ray outburst (or X-ray turn-on) occurred already a few months earlier and being missed due to lack of observations.
If the observed scattering halo would be exclusively due to scattering within, say, 1 kpc and no scattering near the source (i.e. around 7 kpc from Earth) then the measured halo intensity would be a drastic underestimate of the hypothetic steady state halo intensity. This would imply a considerably larger distance of GRS 1739–278 which in turn would increase the travel time difference even more. In view of the absorbing column determined from TTM and RXTE spectra as well as the flux ratio of the quasi-simultaneous ROSAT and RXTE observations, this explanation seems to be unlikely.
Investigating the ASM/RXTE lightcurve in more detail shows GRS 1739–278 being active not only since the start of the regular ASM monitoring at the end of February 1996, but also at the 200 mCrab level during the few days of ASM operation in January 1996. This is consistent with the second alternative that GRS 1739–278 probably has turned on already a few months earlier. On the other hand, there is no report on GRS 1739–278 activity during the Sep./Oct. 1995 Granat observations of the galactic center (Sunyaev 1996). With the above light travel time difference of three months relative to the ROSAT observation on March 31, 1996 we speculate that the turn-on of GRS 1739–278 happened in Nov./Dec. 1995.
3 Discussion
With our distance estimate of 6–8.5 kpc, GRS 1739–278 is certainly another X-ray transient near the Galactic center. Though the luminosity determination of GRS 1739–278 based on only the HRI data is uncertain by up to a factor of 100, it is rather safe to say that GRS 1739–278 is radiating at least near the Eddington luminosity (if not above) for a 1 M⊙ compact object.
The finding of X-ray activity of GRS 1739–278 starting as early as at the end of 1995 and continuing over after several months (given the ongoing activity as monitored with the ASM/RXTE) without a clear trend of intensity decay argues against the classical black hole transients which show typical decay times of the order of 30 days. Similarly, the X-ray spectrum is unlike that of classical black hole transients though obviously consisting of more than one component (Takeshima 1996). It is interesting to note that both the X-ray spectrum as well as the X-ray intensity evolution are very similar to GRS 1915+105 (Harmon et al. 1994; Greiner, Morgan & Remillard 1996), the first galactic source showing apparent superluminal motion (Mirabel & Rodriguez 1994). Given the additional similarity in the radio intensity evolution (Hjellming & Rupen) it seems likely that GRS 1739–278 is a good candidate for yet another galactic superluminal motion source.
Acknowledgements.
We are grateful to J. Trümper for granting a ROSAT target of opportunity observation and to T. Takeshima for communicating the details of the spectral fits of the PCA/RXTE data of March 31, 1996. We thank the referee C. Motch for valuable comments. The ASM lightcurve information is taken from quick-look results provided by the ASM/RXTE team which we greatly acknowledge. JG is supported by the Deutsche Agentur für Raumfahrtangelegenheiten (DARA) GmbH under contract No. FKZ 50 OR 9201. The ROSAT project is supported by the German Bundesministerium für Bildung, Wissenschaft, Forschung und Technologie (BMBF/DARA) and the Max-Planck-Society.References
- [1] Allen C.W., 1973, Astrophysical Quantities, Athlone Press, London
- [2] Borozdin K., Alexandrovich N., Sunyaev R., 1996, IAU Circ. 6350
- [3] Dennerl K., Greiner J., 1996, IAU Circ. 6426
- [4] Greiner J., Morgan E.H., Remillard R.A., 1996, ApJ Lett. (in press)
- [5] Harmon B.A., Zhang S.N., Wilson C.A., Rubin B.C., Fishman G.J., Paciesas W.S., 1994, 2nd Compton Symposium, Washington 1993, eds. C.E. Fichtel et al. , AIP 304, p. 210
- [6] Hjellming R.M., Rupen M.P., 1996, IAU Circ. 6383
- [7] Mathis J.S., Rumpl W., Nordsieck K.H., 1977, ApJ 217, 425
- [8] Mirabel I.F., Rodriguez L.F., 1994, Nat. 371, 46
- [9] Mirabel I.F., Marti J., Duc P.A., Rodriguez L.F., 1996, IAU Circ. 6427
- [10] Neckel Th., Klare G., 1980, A&A Suppl. 42, 251
- [11] Paul J., Bouchet L., Churazov E., Sunyaev R., 1996, IAU Circ. 6348
- [12] Predehl P., Bräuninger H., Burkert W., Schmitt J.H.M.M., 1991, A&A 246, L40
- [13] Predehl P., Schmitt J., 1995, A&A 293, 889
- [14] Rieke G.H., Lebofsky M.J., 1985, ApJ 288, 618
- [15] Sunyaev R., 1996 (priv. comm.)
- [16] Takeshima T., 1996 (priv. comm.)
- [17] Takeshima T., Cannizzo J.K., Corbet R., Marshall F.E., 1996, IAU Circ. 6390
- [18] Trümper J., Schönfelder V., 1973, A&A 25, 445