GRAVITATIONAL LENSING AND THE REDSHIFT DISTRIBUTION OF B GALAXIES
In addition to the determination of the mass distribution of lenses (see P. Schneider, this conference), strong and weak lensing can also be powerfull tools to analyse the redshift distribution of faint galaxies. In this review, I summarize the present status of redshifts of galaxies beyond as they are inferred by spectroscopy of magnified galaxies, lensing inversion and magnification bias.
1 Introduction
During the last decade, outstanding results have been obtained on the redshift distribution of faint galaxies up to (see O. Le Fèvre, this conference) or (Cowie et al. 1996). With the coming of 10 meter class telescopes equipped with wide field multi-object spectrographs these surveys will be extended to thousands of galaxies. The leading goals of these programme is to explore the evolution of clustering of galaxies, their physical and stellar evolution with redshift up to or as well as to study very high redshift galaxies. The galaxies with magnitudes are also important for the models of galaxy formation since we do not know whether they are all at large redshift or if there is a significant fraction of faint nearby dwarfs galaxies. Furthermore, the weak lensing inversion uses the grid of faint distant sources with magnitudes between to for which the redshift distribution is unknown. While this information is not important for nearby lenses, it is crucial for for those having redshifts larger than and can be a major source of uncertainty in the mass determination (see Luppino & Kaiser 1996). In the perspective of the new surveys to study the large-scale mass distribution by using weak lensing, the need of the redshift distribution of the faintest galaxies is thus esssential.
Unfortunately, while we do expect considerable informations in the magnitude range , beyond this limit even 10 meter class telescopes are still too small and redshifts of a complete sample of galaxies cannot be secured in a reasonable amount of observing time. The possibility of using photometric redshifts has been proposed as early as the beginning of eighties and has been studied in great details. Observations as well as reliability tests are still underway (Pelló private communication). Howewer, they are based on theoretical evolution scenarios of galaxies whose predictions about faint distant galaxies are not confirmed yet. Furthermore, there is no hope to calibrate the photometric redshifts of the faint samples with spectroscopic data.
The most attractive alternative is the use of the deviation, magnification and distortion effects induced by gravitational lensing on extended objects. In this review, I discuss the recent advances in the redshift distribution of galaxies by using spectroscopic samples of arc(let)s, the lensing inversion and finally the magnification bias. Though many works in these fields are still underway, they are new promising approaches that must be tested jointly with photometric redshifts in order to cross-check their reliablity and the consistency of their predictions.
2 Spectroscopic surveys of arc(let)s
Spectroscopic redshifts of arc(let)s are indispensable to calculate the angular distances and and to get the absolute scaling of the projected mass density. The redshifts of a large number of arc(let)s in each individual lensing-clusters provide the positions of many critical lines and allow to probe locally the mass distribution. In practice, the redshifts of arc(let)s check the lens modelling obtained from giant arcs and can be used to refined it. It is also possible to obtain information on the cosmological parameters if one could have enough redshift to constrain both the deflector and the geometry of the Universe.
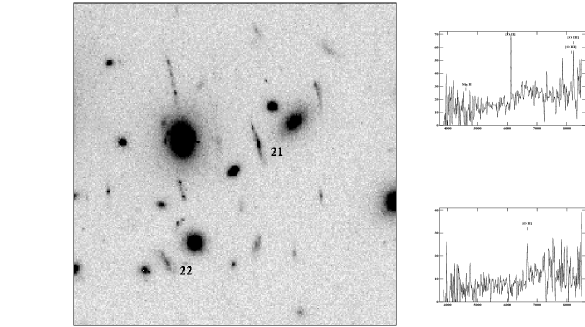
More recently, with the development of the lensing inversion technique (see next section), the need of spectroscopic confirmations of its predictions led to intensive observations of arclets. Spectroscopic surveys of the ”brightest” arclets in many clusters are now underway and first results have been obtained in A2390 (Bézecourt & Soucail 1996) and A2218 (Ebbels et al. 1996; Ebbels this conference). Since most of these objects are very faint, only arclets showing bright spots of stars forming regions on HST images are selected in order to detect an emission line and to optimize the chance to get reliable redshift (see figure 1).
About 20 redshifts of arcs and 20 redshifts of arclets have been measured. However, the use of this sample to recover the redshift distribution of galaxies is difficult because it is biased. First, only arclets with star forming emisson lines are selected. Second, beyond the magnification bias favours observations of blue galaxies rather than red. So, even if the spectroscopy of arclets is crucial for the lens modelling and eventually to obtain the spectral energy distribution of high-redshift galaxies, the redshift distributions obtained from these methods are still questionnable.
3 Redshifts of arclets from lensing inversion
When it is possible to recover the lensing potential with a good accuracy, the lensing equation can be inverted to reconstruct the lensed images back to the source plane. This is basically the procedure of the lensing inversion which searches for each arclet the source plane where its distortion is minimum, assuming it gives its most probable redshift. The obvious interest of this method is that it does not depend on the magnitude of the arclet but on its position and its shape in the image plane. Potentially, it provides redshift of galaxies up to .
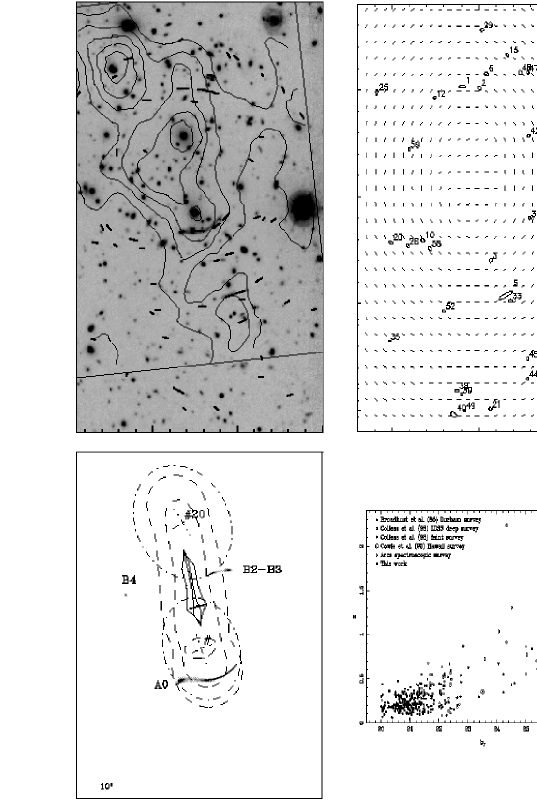
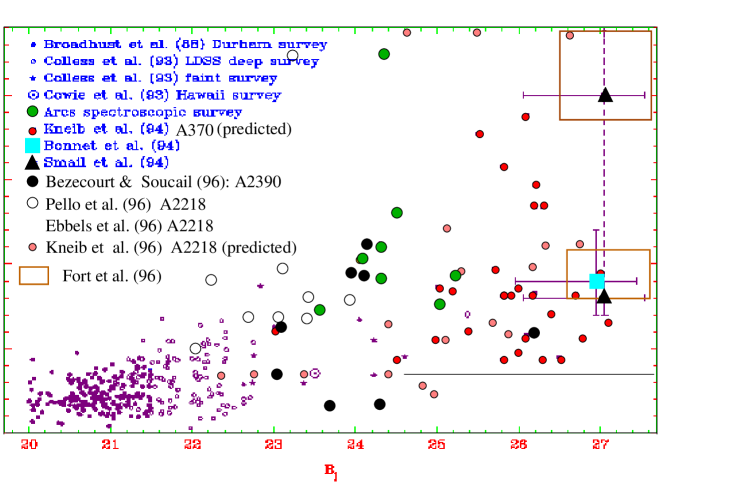
The lensing inversion has been developped by the Toulouse/Paris group and was first applied on A370 (Kneib et al. 1994) from the lens modelling of the giant arc. Though the (intrinsic)magnitude-redshift found for these arclets shows a good continuity with the faint spectroscopic surveys, there are still some uncertainties. In fact, as it is shown in figure 2, the X-ray isophotes and the arclet positions do not follow the expectations of the lens modelling in the eastern region. This is an indication that while the modelling is excellent in the cluster center, the mass distribution has not a simple geometry beyond the giant arc. Furthermore, the lensing inversion is also sensible to the accuracy of the shape measurements of each arclet, and for so faint objects errors can be large.
There are two solutions to solve these issues: first, it is highly preferable to use HST images instead of ground based images. The results obtained by Kneib et al. (1996) on A2218 show the efficiency of the lensing inversion when applied on excellent images. Second, it is important to have lensing-clusters with simple geometry. In this respect, though A370 and A2218 are rather well modelled, they are not the simplest and clusters like MS0440 or MS2137-23 are better candidates.
4 The distribution of faint galaxies from the magnification bias
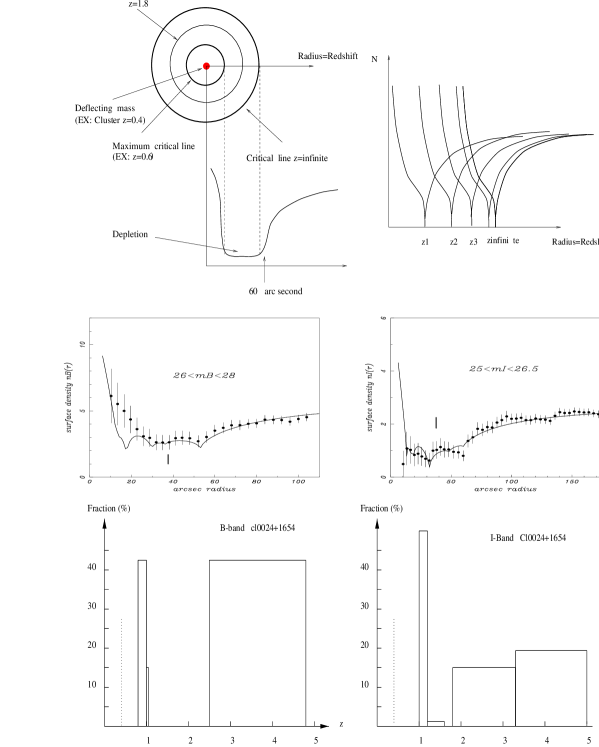
The projected number density of galaxies through a lens results from the competition between the gravitational magnification that increases the detection of individual objects and the deviation of light beam that increases the area and thus decreases the apparent number density. Therefore the amplitude of the magnification bias depends on the slope of the galaxy counts as a function of magnitude and on the magnification factor of the lens (Broadhurst et al. 1995): when the slope is higher than the number density increases, whereas below is decreases and the radial distribution shows a typical depletion curve (see figure 3).
When the slope is lower than , a sharp decrease of the number of galaxies is expected close to the critical radius of the lens corresponding to the redshift of the background sources. For a broad redshift distribution, it can result a shallower depletion between the smallest and the largest critical line which depends on the redshift distribution of the galaxies (Figure 3). Therefore, the analysis of the shape of the depletion curves provide a new way to sort out their redshift distribution. As the lensing inversion, this is a statistical method which can also infer redshift of very faint sources (up to ) but does not need anymore information on the shapes of arclets. However, the need of a good lens modelling is still necessary.
This method was first used by Fort et al (1996) in the cluster Cl0024+1654 to study the faint distant galaxies population in the extreme range of magnitude and . For these selected bins of magnitude they found on their CFHT blank fields that the counts slope was near 0.2, well suited for the study of the effect. After analysis of the shape of the depletion curve (figure 4), of the -selected galaxies were found between and while most of the remaining galaxies appears to be broadly distributed around a redshift of . The selected population present a similar distribution with two maxima, but spread up to a larger redshift range with about 20% above (figure 3).
This very first tentative must be pursued on many lensing clusters in order to provide significant results on the redshift distribution of the faintest distant galaxies. Though it is a very promising approach, it also need to be applied on clusters with simple geometry. Furthermore, the detection procedure demands ultra-deep exposures with subarcsecond seeing.
5 Conclusions
The redshift distribution of galaxies beyond is a crucial scientific question for galaxy evolution and weak lensing inversions. I have discussed three innovative ways which can go as faint as . They must be considered jointly with photometric redshifts which will need confirmations from others observations. But whatever the method, how and when will we be sure that these redshifts are correct from spectroscopic data? This key issue may be solved with ultra-deep CCD spectroscopic exposures with the VLTs. This is a major challenge for the coming years that will be possible to match with the systematic use of gravitational telescopes.
Acknowledgments
I thank B. Fort, R. Ellis, R. Pelló, P. Schneider and L. Van Waerbeke for stimulating discussions on lensing and on distances of faint galaxies.
References
References
- [1] J. Bézecourt, G. Soucail. Preprint astro-ph/9606064, 1996.
- [2] H. Bonnet, Y. Mellier, B. Fort, apj, 427, L83, 1994.
- [3] T. J. Broadhurst, A. N. Taylor, J. Peacock, apj, 438, 49, 1995.
- [4] L. L. Cowie, A. Songaila, E. M. Hu, J. G. Cohen. Preprint astro-ph/9606079, 1996.
- [5] T. Ebbels, J.-F. Le Borgne, R. Pelló, R. S. Ellis, J.-P. Kneib, I. Smail, B. Sanahuja. Preprint astro-ph/9606015.
- [6] B. Fort, Y. Mellier, M. Dantel-Fort. Preprint astro-ph/9606039.
- [7] J.-P. Kneib, G. Mathez, B. Fort, Y. Mellier, G. Soucail, P.-Y. Longaretti, aap, 286, 701, 1994.
- [8] J.-P. Kneib, R. S. Ellis, I. Smail, W. J. Couch, R. M. Sharples. Preprint astro-ph/9511015, 1995.
- [9] G. Luppino, N. Kaiser. Preprint astro-ph/9601194, 1996.