Verifying the Planetary Nebula Luminosity Function Method
Abstract
The planetary nebula luminosity function (PNLF) technique for determining distances to galaxies now has been applied to 34 galaxies, including 6 in the Virgo cluster and 3 in the Fornax cluster. Of these, 16 galaxies are late-type or spirals and presumably contain Cepheid variables useful for verifying the PNLF method. For 7 of these galaxies, Cepheid distances exist; the PNLF distances agree with the Cepheid distances within the dispersion of 8% and within a zero-point offset of 1%.
In addition, 3 small groups were studied (NGC 1023, Leo I, and Coma I) where both spiral and elliptical distances were obtained to investigate the magnitude of any systematic dependence on spiral versus elliptical Hubble type. None was found. Since the PNLF method agrees well with the Cepheid system, and there is no measurable dependence on Hubble type, it follows that PNLF distances to the ellipticals in Virgo and Fornax also are on the Cepheid scale. This conclusion is strengthened by the Cepheid distances to several Virgo galaxies and the recent determination of a Cepheid distance to Fornax.
Challenges to the PNLF method by Bottinelli et al. (1991) and Tammann (1992) are demonstrated to be incorrect. In particular, the allegation that the Virgo distances suffer from inadequate survey depth is rendered baseless with recent observations that extend the PNLF beyond the power law regime and well into the plateau region. Using the new observations of 320 PN, bootstrap tests show that any sample size effect is smaller than 3%.
Finally, a simple thought experiment is presented whereby M87 is placed at 22 Mpc as argued by those favoring H0 . The consequent luminosities for observed planetary nebulae are inconsistent with stellar evolution theory, thereby invalidating the assumption of a distance greater than Mpc; alternatively, a drastic change in stellar evolution theory is required.
1 Introduction
The Planetary Nebula Luminosity Function (PNLF) technique for determining distances to galaxies is described in [Jacoby et al. (1992)]. Briefly, the method relies on the constancy of the [OIII] luminosity at which the population of high luminosity planetary nebulae (PN) declines rapidly. While the number of PN decreases monotonically with increasing luminosity, there exists a luminosity beyond which PN are not observed at all. This limiting luminosity is a consequence of several factors (Jacoby (1989), Kaler & Jacoby (1991), Méndez et al. (1993), Han et al. (1994), Stanghellini (1995), Richer et al. (1997)), the most important being the independence between progenitor age (or initial mass) and the final white dwarf (or central star) mass over reasonable age ranges (e.g., 3–11 Gyrs). For the great majority of progenitors and therefore, for normal populations, the critical PN luminosity varies by less than 0.1 mag.
The PNLF technique is one of the few that has been demonstrated to yield consistent results in both elliptical and spiral galaxies at distances up to 20 Mpc. Consequently, it offers a path to unify the population I distances (e.g., Cepheids) with population II objects (e.g., elliptical galaxies). The former are needed for calibration while the latter are needed to define distances to rich clusters. Other promising cross-population indicators include SN Ia when corrected for decline rate variations ([Hamuy et al. (1996)]), surface brightness fluctuations (SBF), and globular cluster luminosity functions (GCLF).
This paper describes recent results in which the PNLF has been extended to late-type galaxies in order to improve the zero-point calibration, and new observations in M87 to assess the legitimacy of the arguments posed against the use of the PNLF by [Bottinelli et al. (1991)] and [Tammann (1992)].
2 What Makes a Good Distance Indicator?
Several speakers at this meeting presented their views on the important qualities of a good distance indicator. They noted the advantages of an indicator that is luminous, easily identified, and has easily measured properties (e.g., magnitudes). My list focuses more on the physical nature of the indicator rather than its technical properties. Thus, a good distance indicator:
-
(1)
Has a good zero point calibration
-
(2)
Has a good prescription for metallicity correction
-
(3)
Has a good prescription to correct for effects of stellar ages
-
(4)
Can be corrected for effects of foreground and internal extinction
-
(5)
Has a good physical rationale
-
(6)
Can be tested (a) against other methods and (b) by other investigators
This paper concentrates on the first of these. It is worth reviewing, though, how well the PNLF satisfies the remaining 5 criteria.
Metallicity effects were modeled by [Dopita et al. (1992)]. Limited observational testing was performed by [Ciardullo & Jacoby (1992)]. Most galaxies of interest have metallicities within a factor of 2 of solar abundances, and the predicted and observed errors in PNLF distances are smaller than 5% over this range.
The effects of population age on distance have been modeled by [Dopita et al. (1992)], [Méndez et al. (1993)], and [Stanghellini (1995)] and shown to be 5% for galaxies having ages in the oberved range between 3 and 11 Gyrs. Direct tests are complicated by our present inability to measure population ages accurately, but PNLF distances to young (LMC, SMC, M101) and old populations (M31’s bulge, M81’s bulge) where distances are known from Cepheids, fail to detect any age effect at all.
Internal extinction is less of a problem than intuitively suspected. In ellipticals, extinction is not an issue since the dust density is very low. In spirals, significant errors are expected if internal extinction in the galaxy is ignored. Observations, though, fail to reveal any measurable distance errors in the 7 late-type calibrators (Feldmeier, Ciardullo, & Jacoby 1997). Feldmeier, Ciardullo, & Jacoby (1997) modeled the effects of dust to understand this unexpected situation, and found that PN, which generally have scale heights well above the population I disk of a spiral, are either so extincted by heavy dust that they fall out of the PNLF sample, or they are so little affected that their magnitudes are not significantly diminished.
The excellent agreement between the PNLF and Cepheids (as well as SBF and with other methods to a lesser degree) demands that a physical basis for the PNLF must exist. Before all the comparisons were made, though, the theory had been described by [Jacoby (1989)], [Dopita et al. (1992)], and [Méndez et al. (1993)]; recently, Stanghellini (1995) investigated the H PNLF. In short, it has proven easy to reproduce the constancy of the PNLF provided the population age is within the range of 3 to 11 Gyrs. If the progenitors are as young as 0.5 Gyrs, the PNLF brightens by 0.3 mag. And, if all progenitors in a galaxy are much older than 11 Gyrs, they fail to produce observable PN at all.
The requirement that a distance indicator be testable against another method is fundamental to the concept of the scientific method. Because we never know the “right answer” in the distance scale business, we turn to intercomparisons between different methods assuming that 2 independent methods are very unlikely to repeatedly yield the same wrong answer. If a method is not testable, it relies solely on the validity of a model and scientists generally agree that models must be tested. By inference, an untestable indicator is equivalent to an untestable model. Fortunately, the PNLF can be tested against numerous methods (see [Ciardullo, Jacoby, & Tonry (1993)], [Jacoby (1995)], [Feldmeier, Ciardullo, & Jacoby (1997)]).
The second component of the last requirement is that multiple investigators must be able to derive the same answer using the same technique. This sounds simple enough, and again, is fundamental to the scientific method. Results from some methods, however, cannot be reproduced at a later time should a question arise about their validity. The most obvious of these methods is supernovae. A second observer cannot go back in time to observe a supernova in order to check on the observational accuracy of a prior observer’s measurements, or to utilize a superior instrument. Thus, SN Ia fail to satisfy this requirement.
The PNLF technique satisfies the prescription for a good distance indicator on each count. Cross-testing with other methods (the last and most important criterion) shows that disagreements between the PNLF and other reliable methods (e.g., Cepheids) are smaller than 8%. Thus, systematic errors due to extinction, age, metallicity, or application of the method are not accumulating beyond the 8% level. In fact, when consideration is made for the error contribution from the Cepheid distances, the PNLF errors must be smaller than 5%.
3 Some New Insights
If we accept that the PNLF method yields accurate distances, it seems odd, at first, that the errors from population differences and extinction aren’t larger. A potentially dominant population effect is age, as discussed already. The key point is that intermediate age populations all produce nearly identical central star masses. This follows from the initial-to-final mass relation ([Weidemann (1987)]). That is, for progenitor masses between 1 and 2 M⊙ corresponding to ages of about 1 to 10 Gyr, the central star mass will be in the narrow range of M⊙. This narrow range is close to that observed for white dwarfs ([McMahon (1989)]).
Another important effect arises in young (0.5 Gyr) populations to inhibit [OIII] luminous PN from forming. [Kaler & Jacoby (1991)] showed, and [Dopita et al. (1996)] confirmed, that for young progenitors producing central stars more massive than 0.65 M⊙, the surface abundances are strongly altered such that nitrogen is greatly enhanced. The added nitrogen competes with oxygen in cooling the nebula, to the detriment of the [OIII] luminosity. Thus, PN deriving from young, massive progenitors fail to populate the high luminosity end of the PNLF and the effect of a young population on the PNLF is lost.
Similarly, metallicity seems like it ought to play a large role. A competition exists, though, between the efficiency of the nebula to radiate in [OIII] and the luminosity input from the central star. Higher metallicity values enhance the nebula’s ability to radiate at . The central star, however, is predicted to have a lower mass and luminosity as a consequence of experiencing higher mass loss prior to leaving the AGB. The reduced heating compensates to first order for the enhanced radiative efficiency as metallicity increases ([Dopita et al. (1992)]).
4 Summary of PNLF Distances
Table 1 summarizes the available PNLF distances. Distances are referenced to a zero-point based on M31 having a distance of 710 kpc and a reddening of E(B–V). This is the baseline zero-point used in all our papers. To place these distances on the recent scale where the distance to M31 is 770 kpc ([Freedman & Madore (1990)]) and E(B–V), all distances should be increased by 0.06 mag (3%).
Ten galaxies of the 34 in this list are obvious spirals. Six more have a significant late-type component for which Cepheid distances either exist already or could be determined.
5 Spirals
Extending the PNLF technique to spiral galaxies requires extra care due to 3 factors. First, potential confusion exists between PN and HII regions. Second, spiral arms contain obvious dust lanes that could reduce observed luminosities. Third, a young population of stars must exist in spiral arms. Nevertheless, the advantage of working in spirals is tremendous because their Cepheids provide the most accepted reference distances to test the PNLF method for systematic errors. Also, spirals are where zero-point calibrations are most believed.
To identify PN in spiral galaxies, we complement the on-band/off-band imaging technique with on-band/R-band images at H. We define the following criteria for PN candidates in spirals. A PN candidate must:
-
(1)
have a stellar PSF
-
(2)
be on the [OIII] image and absent on a continuum image
-
(3)
be absent in an R-band image
-
(4)
be absent or extremely weak in an H image
-
(5)
not be in a spiral arm
These criteria have been applied recently to observations of M51 (NGC 5194), M96 (NGC 3368), and M101 (NGC 5457) by [Feldmeier, Ciardullo, & Jacoby (1997)]. M96 and M101 distances exist already from HST Cepheid surveys.

Figure 1 illustrates the excellent agreement between the PNLF (adjusted to the modern M31 distance and extinction) and Cepheid distance scales. The PNLF distances are based solely on M31 as the zero-point calibrator, yet the mean offset for the additional 6 Cepheid galaxies differs by only 1%. The random scatter of 8% about the ridge line is consistent with, or smaller than, the combined errors of the Cepheid and PNLF distances. Note that some uncertainties are common to both methods (e.g., foreground extinction) which slightly reduce the apparent uncertainty in the combined distance error.
Figure 1 also includes comparisons between PNLF distances to elliptical galaxies and Cepheid distances for different galaxies in the same group. These indirect comparison points provide further support, but do not confirm the PNLF distances to the Virgo, Fornax, Leo, and NGC 1023 groups.
The lack of any evidence for systematic errors, either among the direct or indirect comparisons, strongly implies that any residual systematic errors for zero-points, population effects (age and metallicity), internal extinction, and methodology (adopted PNLF shape, sizes of PNLF samples) must be smaller than 8%. Alternatively, one can insist that a conspiracy exists among these parameters such that both Cepheid and PNLF distances have errors that correlate.
6 The Spiral–Elliptical Connection
To a limited degree, the 3 indirect distance comparisons shown in Figure 1 illustrate that the PNLF distances to ellipticals are on the same system as the spiral distances. In addition, tests relying purely on PNLF distances have been described for the NGC 1023 group ([Ciardullo, Jacoby, & Harris (1991)]), the Coma I group (Jacoby, Ciardullo, and Harris 1996), and the Leo group ([Feldmeier, Ciardullo, & Jacoby (1997)]). Figure 2 summarizes the 4 PNLF and 2 Cepheid distances to the Leo group.
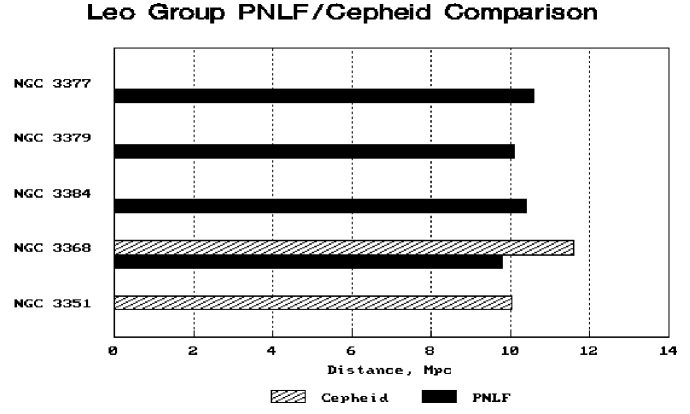
Tests to different galaxies cannot be conclusive, since the two galaxies are not guaranteed to be at exactly the same distance. Nevertheless, the deviations in distance (spiral minus elliptical) for the 3 purely PNLF tests are as follows. NGC 1023 group: mag (NGC 1023); Coma I group: mag (NGC 4278) and mag (NGC 4494); Leo group: mag (NGC 3377), mag (NGC 3379), and (NGC 3384). At face value, assuming that in each of these 3 cases the spiral and associated ellipticals are at exactly the same distance, the average offset is mag for the 3 cases (0.00 for NGC 1023, for Coma I, and for Leo) in the sense that our elliptical distances are too large.
This conclusion is too simplistic because we have not addressed the assumption that the spiral galaxy is always at the same distance as the comparison galaxy. For the Coma I group, for example, the GCLF ([Fleming et al. (1995)]) and the SBF ([Simard & Pritchet]) methods concur that NGC 4494 is beyond NGC 4565, and curiously, the deviance for this galaxy is the largest we see. If removed from the sample, the spiral–elliptical offset is reduced to mag, a level that is too small to consider reliable within the assumptions. Until this problem can be addressed more thoroughly, we apply no correction to our elliptical galaxy distances.
7 Details of New M87 PNLF Studies
Bottinelli et al. (1991) and Tammann (1992) argued that PNLF distances to Virgo ellipticals were underestimated because the luminosity depth of the PN surveys was not adequate to sample beyond the brightest (0.5 mag) edge of the PNLF. Since that edge is nearly linear in the logarithmic PNLF, the method becomes insensitive to distance modulus. In addition, those authors challenged the PNLF distances on the basis that a shallow survey of a large galaxy will suffer from a sample size bias. The sense of this argument is that objects are more likely to be drawn from the low probability bright tail of the large elliptical galaxy PN sample than are objects from the smaller sample in M31’s bulge.
While it is true that PN surveys must extend deep enough to sense the curvature of the PNLF reliably with statistical methods, the required depth is only 0.8 mag. With the exception of NGC 4649 which was observed under poor conditions, Jacoby, Ciardullo, & Ford (1990) estimated the depth of their surveys for 6 Virgo galaxies to be mag. Thus, it seemed unlikely that a serious systematic error was contaminating those distances.
An independent assessment of the likelihood of a serious systematic error is provided by recent Cepheid distances to Virgo galaxies. The average PNLF distance to Virgo, based on 6 galaxies, is 15.3 Mpc (using the modern M31 distance and extinction for the zero-point). This result agrees very well with the [Ferrarese et al. (1996)] distance of 15.8 Mpc to M100 based on HST Cepheids, and the [Pierce et al. (1994)] distance of 14.7 Mpc to NGC 4571 based on CFHT Cepheids. In addition, [Sandage et al. (1996)] reports HST Cepheid distances to three near-Virgo galaxies: NGC 4496 at 16.6 Mpc, NGC 4536 at 16.6 Mpc, and NGC 4639 at 25.1 Mpc. Thus, four galaxies are reported in the range 14.7 to 16.6 Mpc, and these are very comparable to the PNLF range of distances (14.3 to 16.2 Mpc). One galaxy, though, is behind all of these. It is unclear which, if any, of these spirals represents the distances to the ellipticals, but it is evident that most of the spirals (four out of five) have distances that support the PNLF distances.
A direct resolution of the challenges to the PNLF distances lies in a short observing project. Deep PN observations in M87 can push well into the plateau region of the PNLF. Data were obtained in April 1995 with the KPNO 4-m telescope to examine the claim that the earlier Virgo data were not deep enough. A total of 7 hours of on-line integration were devoted to detecting fainter PN. This survey also extends to large radial (10 arcmin) distances from M87’s nucleus. The survey results are described below.
7.1 A Deep PNLF Distance Contradicts the Challenges
Figure 3 shows the new PNLF for M87. A total of 320 PN were identified, but many are fainter than the completeness limit. A total of 201 PN are in the complete sample which extends mag down the PNLF.

Figure 4 shows a curious effect, though, which has not been fully evaluated at the time of this conference. That is, when the sample of PN is divided in half such that the PN drawn from M87’s halo are separated, the PNLF for the inner half (out to 4 arcmin in radius) are systematically fainter by 0.3 mag than the halo sample. I return to this point below, but note here that the more reliable distance is derived from the inner sample because it is less likely to be contaminated by intracluster PN. That distance, Mpc (on the modern M31 distance scale), is nearly identical to the [Jacoby, Ciardullo, & Ford (1990)] value of Mpc.

Thus, a deeper PNLF argues against the contentions of [Bottinelli et al. (1991)] and [Tammann (1992)] that the PNLF distance to Virgo is underestimated as a consequence of inadequate survey depth.
7.2 Sample Size Effects are Small
With the new larger sample of PN, it is possible to investigate the effects that different sample sizes have on the final PNLF distance. Subsets of PN were drawn randomly from the sample of 201 PN. Distances for these subsamples of 20, 30, 40, 50, and 100 PN were derived following our standard procedures and compared to the distance based on 201 PN. Figure 5 shows the magnitude of the effect of sample size differences.

In the worst case, for a sample of 20 PN, there is a slight tendency to overestimate the distance to a galaxy by up to 3%. Again, this contradicts the challenges of [Bottinelli et al. (1991)] and [Tammann (1992)] who claim that our distances would be underestimated. The reason that the effect is small is that the statistical process described by [Ciardullo et al. (1989)] is cognizant of the sample size and adjusts the derived distances to the most likely one for a given sample. That is, a statistical correction for sample size has always been applied to the PNLF results.
7.3 Bright PN in M87’s Halo
As noted above, M87’s halo PNLF is mag brighter than the central PNLF. We can all agree that the halo of M87 is not 15% closer than its core! Thus, something must be artificially enhancing the brightness of the PN in the outer regions. Since we have not seen this effect in the two other samples that permit a similar radial test (Cen A, [Hui et al. 1993]; NGC 4494, [Jacoby, Ciardullo, & Harris (1996)]), we consider what could cause such an effect here. Five possibilities come to mind:
-
(1)
Metallicity decrease in halo
-
(2)
Age decrease in halo
-
(3)
Dust near center
-
(4)
Instrumental effect
-
(5)
Intracluster PN contamination
The color gradient in ellipticals is such that the outer halos are bluer than the inner regions. The first 3 possibilities above have been suggested as possible causes of gradients. The first, a metallicity decrease, reduces the luminosity of PN, in contradiction to the observed effect. The second, the presence of a young population can enhance the PNLF luminosity if the ages of the halo stars are 0.5 Gyrs, provided the central population is 3 Gyrs. We can neither dismiss nor confirm this possibility.
The third option, dust in the central regions, has been suggested by Wise & Silva (1996), [Goudfrooij & De Jong (1995)], and [Witt et al. (1992)] to explain the color gradients. To explain the PNLF enhancement, central reddening of E(B–V)0.06 is needed. Again, this is plausible.
Although the effect has not been seen before, a brightness enhancement in the halo could be caused by instrumental effects. Thus far, flat-fielding errors and filter transmission variations have been dismissed.
The fifth option initially seems highly speculative. The key point is that a large population of intracluster stars exists and can produce PN having a range of distances representing the full depth extent of the Virgo cluster. Thus, some PN may be foreground to M87 and appear brighter than M87’s own PN, while other PN will be in the background and be lost in the faint end of the PNLF. Since the number of intracluster PN found is proportional to the area surveyed, there is a survey bias against finding foreground PN in the smaller central region, while simultaneously, there is a bias in favor of finding true M87 PN at the center where the stellar density is high.
What is the likelihood of finding intracluster PN? [Arnabaldi et al. (1996)] found that 3 of 19 PN in the [Jacoby, Ciardullo, & Ford (1990)] NGC 4406 sample are intracluster. Since that sample is biased against intracluster PN due to velocity rejection in the survey filter (NGC 4406 was sampled at its systemic velocity of km/s, or about 1500 km/s from the Virgo systemic velocity), there are likely to be many intracluster PN. [Arnabaldi et al. (1996)] discuss the intracluster population in detail. To zeroth order, the number density of intracluster PN is not a problem.
A definitive source of the enhanced halo PNLF in M87 is not possible at this time. Kinematics can be used to investigate the likelihood that intracluster PN are contaminating the halo sample. The other likely causes, extinction and very young populations, seem less secure at this time because we don’t know that they exist while we do know that intracluster PN do exist.
8 Can M87 Really Be At 22 Mpc?
Sandage and Tammann (e.g., [Sandage & Tammann (1990)]) have long argued that for values of H55, the Virgo Cluster must be at a distance of about 22 Mpc since the cosmic velocity of Virgo is km/s. Additionally, M87 is usually claimed to be representative of the Virgo distance since its recessional velocity is close to the Virgo average, it is projected near the center of the cluster, and it appears to be at the bottom of the potential well as evidenced by an x-ray cloud typical of x-ray clusters.
A reasonable question to ask is “what must one give up to derive a PNLF distance of 22 Mpc for M87?” The simple answer is that the constancy of the maximum PN luminosity must be abandoned. And, it must be abandoned in a big way – by 0.9 mag.
The astrophysical question becomes “can the PNLF be enhanced by 0.9 mag, and if so, what are the observable manifestations?” The latter turn out to be severe and obvious. Models of the PNLF by [Jacoby (1989)], [Méndez et al. (1993)], and [Stanghellini (1995)] all show that a shift in the PNLF as large as 0.9 mag is almost impossible because there is inadequate UV flux being radiated by any reasonable collection of central stars. A 0.9 mag enhancement demands that the central stars be very massive, originating from 4–5 M⊙ progenitors. A population this young ( Myrs) should be evident.
The presence of a very young population in ellipticals is not unreasonable; many ellipticals exhibit evidence for gas and dust ([Goudfrooij (1995)]). Usually, though, the mass fraction of the elliptical involved in the young population is tiny. To enhance the PNLF by 0.9 mag, though, requires that 40% of the total luminosity of the galaxy comes from the young population. (The 40% value derives from the PN production rate for bright PN in M87. This rate is 40% of the maximum value that is attainable under the assumption that all stars produce PN. Since some stars may not produce PN, the actual fraction of luminosity from young stars could be higher.)
A trivial observational test for a young population is galaxy color. A young population (100 Myr) has a color (B–V) 0.0 while an old population (11 Gyr) has a color (B–V) 1.0. Thus a mix where 40% of the luminosity derives from a young population has a color (B–V) 0.6. This color is the direct consequence of insisting that M87 be at 22 Mpc, combined with stellar evolution predictions (e.g., [Ciotti et al. (1991)]); [Vassiliadis & Wood (1994)]) for the initial-to-final mass relation that was devised to explain the observed relation ([Weidemann & Koester (1983)]).
Comparing the predicted color of 0.6 to the observed (B–V) 1.0 (which depends slightly on radial position), it is evident that a sizable young population is untenable. Thus, we are forced to accept that either M87 is much closer than 22 Mpc in order to alleviate the pressure to enhance the PNLF luminosity, or that the initial-to-final mass relation predicted by stellar evolution models and observed in young Galactic clusters is seriously flawed in such a way that old stars can produce massive central stars. Since there is no evidence for the latter, the more likely conclusion is that the existence of PN in M87 at the observed apparent magnitudes demands a distance much smaller than 22 Mpc. (It is possible to push the distance as large as 17 Mpc before the implied population color becomes inconsistently blue.)
9 Some Important Distances
Based on the comparisons between PNLF and Cepheid distances, between PNLF and SBF ([Ciardullo, Jacoby, & Tonry (1993)]) distances, and between PNLF spiral and PNLF elliptical distances within a cluster, there is repeated evidence that PNLF distances are accurate to 8%. Similar claims are being made for SN Ia. Yet, PNLF distances suggest values for H0 near 75 km/s/Mpc while SN Ia distances are between 55 and 67 km/s/Mpc ([Sandage et al. (1996)]; Riess et al. (1996); Hamuy et al. (1996)) and both methods are based on Cepheids for calibration. While an H0 of 67 is within the combined error budget of the methods, an H0 of 55 stresses the PNLF method (and others) severely.
The PNLF and SN Ia distance comparison shown in Table 2 for galaxies in common in the Virgo and Fornax clusters summarizes the issue. For Virgo, these include a single SN Ia in each of NGC 4374, NGC 4382, and NGC 4486, although none was observed very well. Although SN1991bg in NGC 4374 was observed very well, we reject it for being anomalously underluminous ([Phillips (1993)]; [Leibundgut et al. (1993)]). For Fornax, 2 SN Ia occurred in NGC 1316, and both were reasonably well observed ([Hamuy et al. (1991)]). Distances are given as the average of the 3 galaxies in Virgo.
The SN Ia zero-point is set using the well observed SN Ia SN1981B and SN1990N. No others (SN1895B, SN1937C, SN1960F, SN1972E) were adequately observed for their peak magnitudes and decline rates to be determined at the same level of reliability as these 2 primary calibrators. From [Sandage et al. (1996)], we have M for SN1981B and SN1990N. The apparent peak magnitudes for the Virgo and Fornax SN Ia are taken from [Leibundgut et al. (1991)].
| Cluster | PNLF Distance | SN Ia Distance | Discrepancy |
|---|---|---|---|
| Mpc | Mpc | in ’s | |
| Virgo | 0.8 | ||
| Fornax | 3.3 |
Evidently, the discrepancy in Virgo is not significant while the discrepancy in Fornax is significant. Thus, either the PNLF distance to Fornax is incorrect (although 2 other galaxies yield the same distance and the Cepheid distance is nearly identical), or the 2 well observed SN Ia in Fornax are underluminous by 0.5 mag. There is evidence that the Fornax SN Ia are, in fact, somewhat fast declining ones, but this can only explain about 0.15 mag of the discrepancy. If the decline rate is considered, using the [Hamuy et al. (1996)] slope of 0.78, then the discrepancy is reduced to a 2.2 event, which still is marginally significant. Because the discrepancies between the Fornax SN Ia distance and Fornax distances from the HST Cepheids, SBF, and PNLF are all very similar, the SN Ia Fornax inconsistency cannot be solved by appealing solely to errors in the PNLF method. For now, this issue remains open.
10 Conclusions
No distance indicator is perfect. Confidence in the results, though, is built by extensive testing against other distance indicators, and through the development of the astrophysical theory supporting the indicator’s use.
The PNLF technique has been well tested against Cepheids, SBF, and against itself in clusters. Constancy of the bright end of the PNLF has been easy to reproduce theoretically if the ages of the stars producing PN are within a plausibly wide range. Thus, PNLF distances appear reliable at this time. The main points of this paper are:
-
(1)
PNLF distances to spirals are consistent with Cepheid distances.
-
(2)
There are now 7 PNLF calibrators; their dispersion is 8%.
-
(3)
Good agreement with Cepheid and SBF distances must mean that systematic errors (due to age, metallicity, extinction, PN sample sizes, PNLF methodology) are under control to the limits of the deviations of these methods (typically, 8%).
-
(4)
The M87 deep survey demonstrates that the bright end of the PNLF is not a power law as some have maintained and that PNLF distances are not sensitive to the number of PN in the sample.
-
(5)
Both the Virgo and Fornax distances agree with the Cepheid-based distances, but the Fornax SN Ia distance is 25% larger. The Virgo SN Ia distance is not discrepant, within the errors.
In terms of the future application of the PNLF, it is somewhat costly in telescope time (exposure time is proportional to distance4). So, while the method yields results as reliable as the Cepheids or SBF, its application may be reserved for galaxies that present problems for other methods. For example, it can be used to measure distances to SN Ia hosts such as Sa/S0 galaxies where Cepheids won’t be found easily and where galaxy structure compromises the SBF.
Acknowledgements
Acknowledgements.
This paper derives from other papers in press. The discussions on spirals was based on information provided by John Feldmeier; preliminary results on the deep M87 survey were provided by Robin Ciardullo. I am grateful to John Graham who gave me his HST Cepheid distance to NGC 3351 prior to publication.References
- Arnabaldi et al. (1996) Arnabaldi, M., Freeman, K. C., Méndez, R. H., Capaccioli, M., Ciardullo, R., Ford, H., Gerhard, O., Hui, X., Jacoby, G. H., Kudritzki, R. P., & Quinn, P. J. 1996 Ap.J., submitted.
- Bottinelli et al. (1991) Bottinelli, L., Gouguenheim, L., Paturel, G., & Teerikorpi, P. 1991 Astr.Ap. 252, 550.
- Ciardullo & Jacoby (1992) Ciardullo, R. & Jacoby, G. H. 1992 Ap.J. 388, 268–271.
- Ciardullo, Jacoby, & Ford (1989) Ciardullo, R., Jacoby, G. H., & Ford, H. C. 1989 Ap.J. 344, 715–725.
- Ciardullo et al. (1989) Ciardullo, R., Jacoby, G. H., Ford, H. C., & Neill, J. D. 1989 Ap.J. 339, 53–69.
- Ciardullo, Jacoby, & Harris (1991) Ciardullo, R., Jacoby, G. H., & Harris, W. E. 1991 Ap.J. 383, 487–497.
- Ciardullo, Jacoby, & Tonry (1993) Ciardullo, R., Jacoby, G. H., & Tonry, J. L. 1993 Ap.J. 419, 479.
- Ciotti et al. (1991) Ciotti, L., D’Ercole, A., Pellegrini, S., & Renzini, A. 1991 Ap.J. 376, 380.
- Dopita et al. (1992) Dopita, M. A., Jacoby, G. H., & Vassiliadis, E. 1992 Ap.J. 27–38.
- Dopita et al. (1996) Dopita, M. A., Vassiliadis, E., Wood, P. R., Meatheringham, S. J., Harrington, J. P., Bohlin, R. C., Ford, H. C., Stecher, T. P., & Maran, S. P. 1996 Ap.J., in press.
- Feldmeier, Ciardullo, & Jacoby (1997) Feldmeier, J., Ciardullo, R., & Jacoby, G. H. 1997 Ap.J. submitted.
- Ferrarese et al. (1996) Ferrarese, L., & others 1996 Ap.J. 464, 568.
- Fleming et al. (1995) Fleming, D. B., Harris, W. E., Pritchet, C. J., & Hanes, D. A. 1995 AJ 109, 1044.
- Ford et al. (1996) Ford, H. C., Hui, X., Ciardullo, R., Jacoby, G. H., & Freeman, K. C. 1996 Ap.J. 458, 455.
- Freedman & Madore (1990) Freedman, W. L., & Madore, B. F. 1990 Ap.J. 365, 186.
- Goudfrooij (1995) Goudfrooij, P. 1995 P.A.S.P. 107, 502.
- Goudfrooij & De Jong (1995) Goudfrooij, P., & De Jong, T. 1995 Astr.Ap. 298, 784.
- Graham et al. 1996 Graham, J. A., Phelps, R. L., Freedman, W. L., Saha, A., Stetson, P. B., Madore, B. F., Silbermann, N. A., Sakai, S., Kennicutt, R. C., Harding, P., Turner, A., Mould, J. R., Ferrarese, L., Ford, H. C., Hoessel, J. G., Han, M., Huchra, J. P., Hughes, S. M., Illingworth, G. D., & Kelson, D. D. 1996 Ap.J., submitted.
- Hamuy et al. (1991) Hamuy, M., Phillips, M. M., Maza, J., Wischnjewsky, M., Uomoto, A., Landolt, A. U., & Khatwani, R. 1991 AJ 102, 208.
- Hamuy et al. (1996) Hamuy, M., Phillips, M. M., Schommer, R. A., Suntzeff, N. B., Maza, J., & Avilés, R. 1996 AJ submitted.
- Han et al. (1994) Han, Z., Podsiadlowski, P., & Eggleton, P. P. 1994 M.N.R.A.S. 270, 121
- Hui et al. 1993 Hui, X., Ford, H. C., Ciardullo, R., & Jacoby, G. H. 1993 Ap.J. 414 463
- Jacoby (1989) Jacoby, G. H. 1989 Ap.J. 339, 39.
- Jacoby (1995) Jacoby, G. H. 1995 in Science With the VLT eds. J. R. Walsh & I. J. Danziger, 267.
- Jacoby, Ciardullo, & Ford (1990) Jacoby, G. H., Ciardullo, R., & Ford, H. C. 1990 Ap.J. 356, 332–349.
- Jacoby et al. (1989) Jacoby, G. H., Ciardullo, R., Ford, H. C., Booth, J. 1989 Ap.J. 344, 70.
- Jacoby, Ciardullo, & Harris (1996) Jacoby, G. H., Ciardullo, R., & Harris, W. E. 1996 Ap.J. 462, 1–12.
- Jacoby, Walker, & Ciardullo (1990) Jacoby, G. H., Walker, A. R., & Ciardullo, R. 1990 Ap.J. 365, 471–477
- Jacoby et al. (1992) Jacoby, G. H., Branch, D., Ciardullo, R., Davies, R. L., Harris, W. E., Pierce, M. J., Pritchet, C. J., Tonry, J. L., & Welch, D. L. 1992 P.A.S.P. 104, 599–662.
- Kaler & Jacoby (1991) Kaler, J. B. & Jacoby, G. H. 1991 Ap.J. 382, 134.
- Leibundgut et al. (1991) Leibundgut, B., Tammann, G. A., Cadonau, R., & Cerrito, D. 1991 Astr.Ap.Sup. 89, 537–579.
- Leibundgut et al. (1993) Leibundgut, B. & others 1993 AJ 105, 301.
- McMahon (1989) Mcmahon, R. K. 1989 Ap.J. 336, 409.
- McMillan, Ciardullo, & Jacoby (1993) McMillan, R., Ciardullo, R., & Jacoby, G. H. 1993 Ap.J. 416, 62–73.
- McMillan, Ciardullo, & Jacoby (1994) McMillan, R., Ciardullo, R., & Jacoby, G. H. 1994 AJ 108, 1610–1618.
- Méndez et al. (1993) Méndez, R. H., Kudritzki, R. P., Ciardullo, R. P., & Jacoby, G. H. 1993 Astr. Ap. 275, 534–548.
- Phillips (1993) Phillips, M. M. 1993 Ap.J 413, L105.
- Phillips et al. (1992) Phillips, M. M., Jacoby, G. H., Walker, A. R., Tonry, J. L., & Ciardullo, R. 1992 B.A.A.S. 180, 1304.
- Pierce et al. (1994) Pierce, M. J., Welch, D. L., McClure, R. D., van den Bergh, S., Racine, R., & Stetson, P. B. 1994 Nature 371, 385–389.
- Pottasch (1990) Pottasch, S. R. 1990 Astr.Ap. 236, 231.
- Richer & McCall (1992) Richer, M. G., & McCall, M. L. 1992 AJ 103, 54.
- Richer et al. (1997) Richer, M. G., McCall, M. L., & Arimoto, N. 1997 Astr.Ap., in press.
- Riess et al. (1996) Riess, A. G., Press, W. H., & Kirshner, R. P. 1996 Ap.J., submitted.
- Sandage & Tammann (1990) Sandage, A., & Tammann, G. A. 1990 Ap.J. 365, 1.
- Sandage et al. (1996) Sandage, A., Saha, A., Tammann, G. A., Labhardt, L., Panagia, N., & Macchetto, F. D. 1996 Ap.J. 460, L15–L18.
- Simard & Pritchet Simard, L., & Pritchet, C. J. 1994 AJ 107, 503.
- Soffner et al. (1996) Soffner, T., Méndez, R. H., Jacoby, G. H., Ciardullo, R., Roth, M. M., & Kudritzki, R. P. 1996 Astr.Ap. 306, 9.
- Stanghellini (1995) Stanghellini, L. 1995 Ap.J. 452, 515-521.
- Tammann (1992) Tammann, G. A. 1992 in IAU Symposium 155, Planetary Nebulae eds. R. Weinberger & A. Acker, 515.
- Tanvir et al. (1995) Tanvir, N. R., Shanks, T., Ferguson, H. C., & Robinson, D. R. T. 1995 Nature 377, 27.
- Vassiliadis & Wood (1994) Vassiliadis, E., & Wood, P.R. 1994 Ap.J.Sup. 92, 125.
- Weidemann (1987) Weidemann, V. 1987 Astr.Ap. 188, 74.
- Weidemann & Koester (1983) Weidemann, V., & Koester, D. 1983 Astr.Ap. 121, 7.
- Wise & Silva (1996) Wise, M. W., & Silva, D. R. 1996 Ap.J. 461. 155.
- Witt et al. (1992) Witt, A. N., Thronson, H. A., Jr., & Capuano, J. M., Jr. 1992 Ap.J. 393, 611.