Metal absorption from galaxies in the process of formation
Abstract.
In a hierarchical cosmogony present-day galaxies build up by continuous merging of smaller structures. At a redshift of three the matter content of a typical present-day galaxy is split into about ten individual protogalactic clumps. Numerical simulations show that these protogalactic clumps have a typical distance of about 100 kpc, are embedded in a sheet-like structure and are often aligned along filaments. Artificial QSO spectra were generated from hydrodynamical simulations of such regions of ongoing galaxy formation. The metal and hydrogen absorption features in the artificial spectra closely resemble observed systems over a wide range in HI column density. Detailed predictions of the column density as a function of impact parameter to protogalactic clumps are presented for HI,CII,CIV,SiIV,NV and OVI. The expected correlations between column densities of different species and their role in understanding the physical properties of the gas from which galaxies form are discussed. The model is able to explain both high-ionization multi-component heavy-element absorbers and damped Lyman alpha systems as groups of small protogalactic clumps.
1 Introduction
While at low redshift metal absorption systems have been convincingly demonstrated to arise in the haloes of rather normal galaxies (Boisse & Bergeron 1991, Steidel 1995), much less is known about the nature of metal absorption system at redshifts (Sargent, Boksenberg & Steidel 1988; Petitjean & Bergeron 1994; Aragon-Salamanca et al. 1994). Recently, it was shown that the prominent complex CIV absorption features observed at high redshift can be well reproduced by the absorping properties of regions in which galaxies form by hierarchical merging (Haehnelt, Steinmetz & Rauch 1996). Here we present further results concerning the metal absorption properties of such regions.
2 Numerical Simulations
The simulations were performed using GRAPESPH (Steinmetz 1996). The cosmological background model is a , cold dark matter (CDM) cosmogony with a normalization of . The baryon fraction is . The gas particle masses is . The high resolution region of the simulation box is about 5.5 comoving Mpc across and contains three galaxies with circular velocities between and at redshift zero. For the UV background a power-law spectrum with spectral index , a normalization of z= 3 and a redshift dependence as given by Vedel, Hellsten & Sommer–Larsen (1994) was assumed. The photoionization code CLOUDY (Ferland 1993) was used to calculate the ionization state of the gas (see the contribution by Steinmetz in this volume for a more detailed description of the simulation).
3 The gas distribution
There are about 20 collapsed protogalactic clumps (PGC’s) aligned in a filamentary matrix which itself is embedded in a sheet-like structure (Figure 1a).
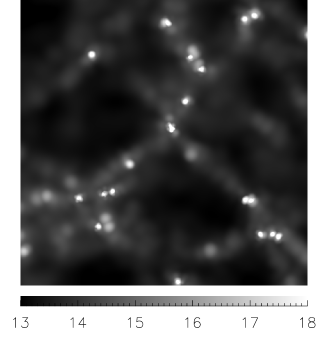

Figure 2a shows the observed column density distribution of HI and a set of other ionic species observable in absorption systems of intermediate HI column density at high redshift. The crosses show the observed HI distribution () obtained by Petitjean et al. (1993). Apart from the high column density end the shape of the observed and simulated HI distribution correspond rather well. There self-shielding becomes important which is not taken into account in the simulation. The normalization was freely adjusted as the simulation box is too small to be a fair sample of the universe. In Figure 2b the typical column density (mean log N) is shown as function of absorption-weighted overdensity . There is a tight correlation between column density and density confirming the visual impression from Figure 1a that higher column densities probe the centre of the collapsed PGC’s. Low column densities arise from the more diffuse gas in sheets and filaments between the collpased objects. Figure 1b and 2b show that the spatial distribution of different ionic species differs. Species like CII and SiIV are only strong in the dense inner regions of the PGC’s and the column density falls off rather rapidly on scales of or less. Higher ionization species probe the gas further away from the PGC’s. The high CIV column density extends to scales of typically 30 kpc. A closer inspection of the simulation shows that CIV is a good tracer of the filamentary matrix connecting the PGC’s. NV and OVI probe even lower densities. Especially OVI is a good tracer of the diffuse intergalactic medium in the sheets between the PGC’s.

4 Column density ratios of different ionic species
In Figure 3 we show a selection of column density ratios as function of HI and CIV column density assuming a homogeneous metallicity of 0.01 solar. These ratios can be used as diagnostic of the UV radiation field and the metallicity of the gas. As consequence of the tight density-column density correlation the ratio of the species [CII/HI] and [SiIV/HI] drops rather fast towards lower HI column density. [CIV/HI] has a pronounced peak arround to while [OVI/HI] rises rapidly towards small column densities. Recently, there have been measurements of CII, SiIV, CIV and NV column densities down to by Soingaila & Cowie (1996). Even so the number of detected lines are small the measured [SiIV/CIV] seems to be larger than those shown in Figure 3b by a factor of 3 at the relevant CIV column density while [NV/CIV] is smaller by about the same factor. A preliminary analysis suggests that this indicates an ionizing spectrum softer than the assumed power law at high energies (see Rauch, Haehnelt & Steinmetz 1996 for a further discussion). OVI has not yet been searched for at small HI column densities. If OVI should turn out to be weak below this would strongly argue for a metallicity gradient towards low-density regions.

References
- 1 Aragon-Salamanca A., Ellis R.S., Schwartzenberg J.-M., Bergeron J.A., ApJ1994421, 27
- 2 Bergeron J., Boissé P., 1991, A&A, 243, 344
- 3 Ferland G.J., 1993, University of Kentucky Department of Physics and Astronomy Internal Report
- 4 Haehnelt M.G., Steinmetz M., Rauch M. ApJ1996465, L95
- 5 Petitjean P., Webb J.K., Rauch M., Carswell R.F., Lanzetta K., MNRAS1993262, 499
- 6 Petitjean P., Bergeron J.A., 1994, A&A, 283, 759
- 7 Rauch M., Haehnelt M.G., Steinmetz M., 1996, submitted
- 8 Sargent W.L.W., Boksenberg A., Steidel C.C., ApJS198868, 539
- 9 Songaila A., Cowie L.L., 1996, Astronomical Journal, in press
- 10 Steidel C.C., 1995, in QSO Absorption Lines, Proc. ESO Workshop, ed. G.Meylan (Heidelberg: Springer), p. 139.
- 11 Steinmetz M., MNRAS1996278, 1005
- 12 Vedel H., Hellsten U., Sommer–Larsen J., MNRAS1994271, 743