1 Introduction
In this short survey of the applications of wide-field, multi-object spectroscopy to galaxy evolution, large-scale structure and cosmology, I interleave summaries of the general goals and state of play in these fields with specific examples based on my own recent work. I first briefly review the goals and figures of merit for current and future redshift surveys, before examining some recent results from deep surveys in the field, cluster redshift surveys and surveys of large scale structure. I take a look beyond redshift surveys to other probes of galaxy evolution before concluding with a discussion of the future prospects for such studies using the next generation of wide-field, multi-object spectrographs on large telescopes.
The main goals of extragalactic/cosmological studies for which wide-field, multi-object spectroscopy is relevant are (i) the world model: , , , , etc.; (ii) large-scale structure: , , Gaussianity, topology, morphology, biassing, etc.; and (iii) galaxy formation and evolution: luminosity function and as functions of galaxy type, environment and lookback time, the redshift of peak star formation in bulges and disks, etc. Redshift surveys are essential to some of these topics and one powerful alternative in studying others, either because they are intrinsically population studies or because they demand large statistical samples. In either case one is playing a numbers game, so that the most efficient observational approach will employ wide-field multi-object spectroscopy.
2 Current Results from Redshift Surveys
There has been much recent progress in studies of galaxy formation and evolution. The general form of the evolution of the galaxy population out to 1 has begun to emerge from deep redshift surveys of 103 field galaxies to =24, =22 and =20 (Ellis et al. 1996, Lilly et al. 1995, Cowie et al. 1996). These studies have revealed differential evolution of the galaxy luminosity function with luminosity and also with colour or spectral type. At the same time, significant advances have been made in detecting high-redshift (3) star-forming galaxies directly from their stellar light and not from an associated QSO or radio source (Steidel et al. 1996).
At the other end of the scale, several redshift surveys of 104 nearby (0.1) galaxies have been carried out over large volumes of the local universe in order to map large-scale structure (CfA, SSRS, IRAS PSCz, LCRS, ORS, etc.). These surveys have measured the galaxy distribution’s power spectrum, , or correlation function, , with fair precision on scales less than about 100 h-1 Mpc, but also reveal still larger structures, suggesting that we have not yet mapped a sufficiently large volume to constitute a fair sample of the universe.
Studies measuring both the redshift and the distance for 103 galaxies at redshifts 5000 km s-1 have mapped the peculiar motions in the local universe and thereby constrained the local mass distribution and the nature of the missing mass. Such observations are much more difficult than simple redshift surveys, as the usual distance indicators are based on versions of the linewidth–luminosity relation (the Fundamental Plane for ellipticals, the Tully-Fisher relation for spirals) and so require measurements of the internal motions of each galaxy. As discussed below, such studies are beginning to be pushed to higher redshifts in order to use the linewidth–luminosity relations as probes of galaxy evolution.
The use of galaxy redshift surveys to probe the parameters of the world model, popular twenty years ago, has largely been abandoned today due to the realisation that evolutionary effects on the galaxy population swamp the more subtle effects of spacetime geometry.
There are at least two other important types of redshift survey which I do not touch on at all here, namely surveys of QSOs (to probe their evolution and very large-scale structures) and surveys of QSO absorption line systems (ALS) and their associated galaxies (which offer an alternative approach to studying galaxy evolution at high redshift).
3 Figures of Merit for Surveys
Table 1 gives a brief summary of some recent and proposed redshift surveys, along with the diameter of the telescope and the field of view and multiplex of the spectrograph with which they are carried out. The numbers are in some cases merely indicative, especially for future surveys.
Survey Band Mag Diam. FoV Multi lim (m) () -plex CfA 15000 15.5 0.02 1.5 — 1 SSRS 10000 15.5 0.02 1.5 — 1 SAPM 1800 17.2 0.04 2.3 — 1 PSCz 15000 0.6 0.03 2.1 — 1 LCRS 26000 17.7 0.10 2.5 1.50 112 ESP 4000 19.4 0.10 3.6 0.50 50 ESOSc 1000 20.5 0.30 3.6 0.70 50 Autofib 1400 22.5 0.30 3.9 0.70 64 CFRS 760 22.5 0.56 3.6 0.02 70 ORS 8500 14.5 0.01 1.5 — 1 MRSP 750000 20.5 0.15 1.2 30.00 15000 2dFb 250000 19.7 0.10 3.9 2.10 400 2dFf 6000 21.0 0.30 3.9 2.10 400 SDSS 1000000 18.3 0.10 2.5 3.00 640 FLAIR 100000 13.0 0.04 1.2 30.00 150 VLTIR 100000 21.0 1.00 8.2 0.35 200 LAMOST 10000000 20.0 0.12 4.0 21.20 5000
Notes (undated references are to these proceedings): CfA = Center for Astrophysics redshift survey (Kurtz, da Costa); SSRS = Southern Sky Redshift Survey (da Costa); SAPM = Stromlo–APM redshift survey (Loveday et al. 1992); PSCz = IRAS Point Source Catalogue -survey (Rowan-Robinson); LCRS = Las Campanas Redshift Survey (Shectman et al. 1996, preprint); ESP = ESO Slice Project (Vettolani, Zucca); ESOSc = ESO-Sculptor faint galaxy redshift survey (Bellanger et al. 1995); Autofib = Autofib redshift survey (Ellis et al. 1996, this paper); CFRS = Canada France Redshift Survey (Lilly et al. 1995, Hammer); ORS = Optical Redshift Survey (Santiago et al. 1995); MRSP = Münster Redshift Survey Project (Schuecker); 2dFb/2dFf = 2dF bright and faint redshift surveys (this paper); SDSS = Sloan Digital Sky Survey (Kron); FLAIR = FLAIR southern sky survey (Parker et al.); VLTIR = VLT near-IR redshift survey (this paper, Le Fevre); LAMOST = Large Area Multi-Object Spectroscopy Telescope (Chu).
Various figures-of-merit can be envisaged for wide-field, multi-object spectrographs. The usual figure-of-merit for imaging surveys is : the product of the telescope aperture and the imaging field-of-view . The analogous figure for spectroscopic surveys is : the product of the telescope aperture and the multiplex of the spectrograph (i.e. the number of objects which can be observed simultaneously). Note in the following exercise we are not comparing the redshift surveys with each other (in which case a more appropriate figure-of-merit might be the effective volume surveyed), but rather the potential of a given telescope/spectrograph combination for carrying out such surveys.

Figure 1a shows as a function of sample size for the surveys listed in Table 1. The one-by-one surveys (Stromlo-APM, CfA, SSRS, ORS, PSCz) all have log1 since they were all carried out on small (1m–2m) telescopes, yet they have sample sizes comparable to any of the recent group of redshift surveys carried out on larger (2m–4m) telescopes with multi-object spectrographs. This reflects partly the large amount of time spent by dedicated observers, but, more importantly, the small field sizes available on larger telescopes. This constraint has meant that (with the exception of LCRS) most recent multi-object redshift surveys have concentrated on going deep rather than covering a large volume. As the figure shows, this situation is expected to change in the near future, as large surveys are begun with spectrograph/telescope combinations with larger (FLAIR on the 1.2m UKST with 92 fibres and 6∘ FoV; SDSS on a 2.5m with 640 fibres and 3∘ FoV; and the 2dF redshift survey on a 4m with 400 fibres and 2∘ FoV). These instruments will increase sample sizes by an order of magnitude for both bright surveys (over 105 galaxies with =17–19.5 for FLAIR, SDSS and the 2dF bright survey) and faint surveys (104 galaxies with =21 for the 2dF faint survey). In the more distant future something like the LAMOST concept (Chu, these proceedings) will achieve another order of magnitude increase in , while multi-object spectrographs on 8m-class telescopes will perform surveys of 105 galaxies at yet fainter limits.
As well as , there are a number of other secondary indicators of capability. One of these is the range of limiting magnitudes, , over which a particular telescope/spectrograph is an effective survey tool. Here is defined by ()= (i.e. the magnitude at which the instrument is well-matched to the surface density of galaxies), while is the approximate limiting magnitude achieved in one half-night on a telescope of diameter (a psychological rather than physical limit, but an effective one nonetheless). Figure 1b shows how the magnitude limits are chosen within this range. ‘Big’ surveys, for which the prime goal is sample size, have , while ‘deep’ surveys, for which the prime goal is sample depth, have . The single-object surveys, for which is arbitrarily set to , still have comparable to other ‘big’ surveys. Two ultra-deep surveys (LDSS2 and CFRS) have , as does the MRSP objective prism survey (where extra depth is obtained at the cost of resolution).
The other indicators of capability are the accessible wavelength range, the spectral resolution (), and the instrumental throughput (which determines the achieved in fixed time). For redshift surveys we want the largest possible spectral range but modest (500 for evolution, 1000 for structure) and S/N (10).
4 Redshift Surveys for Galaxy Evolution
For redshift surveys investigating galaxy evolution, the ultimate aims are to uncover the important physical processes in forming galaxies, what makes galaxies biased tracers of the mass, and what part environment plays in galaxy evolution. The more immediate aims are to fully characterise the distributions of galaxy properties (luminosity, mass, star-formation rate, type, etc.), to determine how these properties depend on environment (i.e. local structure and over-density), and to recover the evolution of the galaxy population with redshift.
Results come from two types of survey:
-
1.
surveys of 104 galaxies at 0 (e.g. LCRS and PSCz) with the goal of definitively establishing the properties of the local galaxy population. The existing surveys are, however, too small to fully explore type/environment dependencies; proposed surveys of 105–106 galaxies (e.g. 2dFb and SDSS) will overcome this limitation. For such surveys good photometry and uniform selection criteria are crucial.
-
2.
surveys of 103 galaxies at 0.5–1 (e.g. CFRS and Autofib) with the goal of tracking the evolution of the galaxy population. Wide-area deep imaging is a prerequisite for such surveys. The 2dF faint redshift survey will cover 104 galaxies selected from deep photographic imaging, but the next generation of surveys on 8m-class telescopes will demand wide-area CCD imaging. In order to push beyond 1 will require a near-infrared multi-object spectrograph (see below; also Le Fevre, these proceedings), as the familiar optical lines are redshifted beyond 1m and the spectral ‘desert’ of the restframe UV is shifted into the optical. Beyond 3, optical spectroscopy is appropriate again as Ly , CIV and the Lyman limit become accessible.
5 The Autofib Redshift Survey
The Autofib redshift survey (Ellis et al. 1996, Heyl et al. 1996), along with the CFRS (Lilly et al. 1995), defines the current state of deep field surveys. The main motivation for the survey was tracking the evolution of the galaxy luminosity function (LF) out to 0.5 over a wide range of intrinsic luminosities. A survey with broad coverage in both and implies the sample must span a very broad range of apparent magnitudes. Our solution was to combine several of our previous redshift surveys, with magnitude limits between =17 and =24, with 1000 new galaxy redshifts filling the gaps between these surveys and increasing the total sample size.
The local LF that we obtain from the 291 galaxies with is adequately represented by a Schechter function over the range . The best-fit parameters are: =19.3+5log, =0.026 Mpc-3, =1.1. This fit is compared in Figure 2 to similar determinations of the local LF obtained in other studies. The significant differences between these results are not understood. Specific problems with some individual surveys have been noted (e.g. clustering in the DARS survey, Zwicky magnitudes and the presence of Virgo in the CfA survey), while the discrepancies between the other surveys have variously been ascribed to magnitude scale errors, different isophotal magnitude systems, ultra-large scale structure, and very rapid evolution at low redshift. None of these possibilities are very palatable, nor particularly credible. The solution to this problem is not bigger redshift surveys (except that these will tie down the faint end of the LF somewhat more securely) but rather better samples, with low-isophote photometry of uniform quality and calibration over large areas, and selection criteria that are as inclusive as possible (particularly with respect to low surface brightness galaxies).

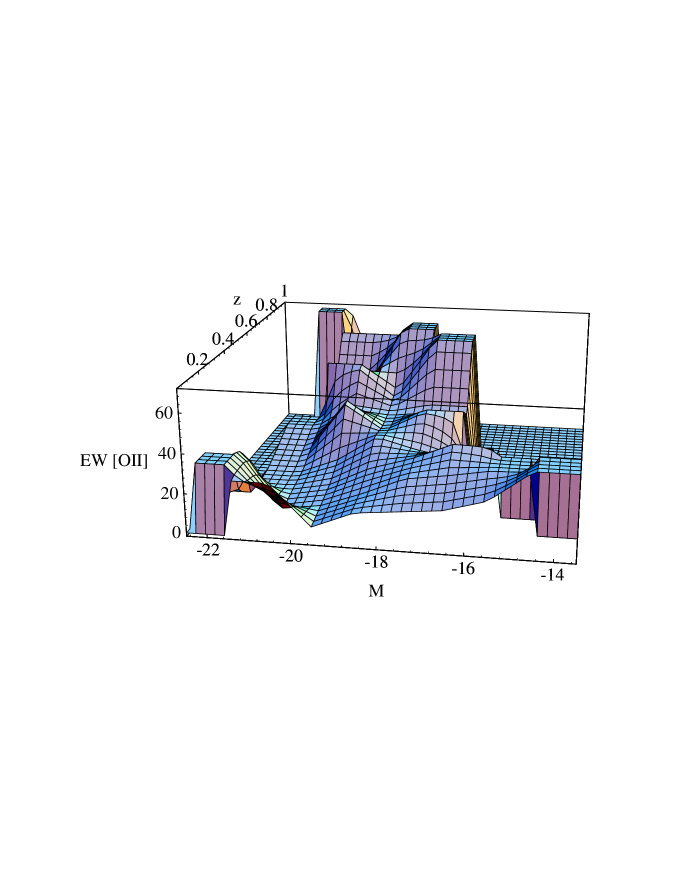
The broad magnitude range and faint limiting magnitude of the combined Autofib redshift survey gives unambiguous evidence for LF evolution with redshift. The faint end of the overall LF becomes progressively steeper with increasing lookback time (see Figure 10 of Ellis et al. 1996), so that by 0.5 there is a noticeable change in the LF around . A test rejects a non-evolving LF with a probability 10-20. Although evolution is clearly significant for , whether there is evolution at remains uncertain due to the uncertainties in the local LF. The change in the LF shape is due to the rapid evolution of star-forming galaxies with high [OII] equivalent widths. Figure 3 shows that the median equivalent width of [OII] amongst late-type spiral galaxies increases with redshift at fixed luminosity, implying higher rates of star-formation in all objects, with bright galaxies showing this increase at higher redshift than faint galaxies. The evolution of the LF for each spectral type (see Heyl et al. 1996) reflects this effect: the E/S0 LF shows no significant evolution out to at 0.7; the early-spiral LF shows a steepening of the faint-end slope, though the number of galaxies does not change by 0.5; the late-spiral LF evolves strongly, with even galaxies increasing in number by 0.5. We conclude that the evolution of the population to 0.5 is completely dominated by late types.
6 Cluster Redshift Surveys
Current redshift surveys in clusters are focussed on cluster structure and dynamics or the evolution of galaxies in clusters. There is a clear linkage between these topics, since the detailed dynamical analysis of cluster substructure can reveal the formation history of the cluster, and hence the environmental effects suffered by the individual galaxies. Another motivation for some recent cluster surveys (e.g. the CNOC survey; Carlberg et al. 1996) is to map the infall pattern of galaxies around clusters, which can be used to estimate .
Again, various types of survey are appropriate depending on the specific goals. Complete redshift surveys of single clusters to faint limits (103 galaxies) can yield the detailed formation history of the cluster and the dynamics of the galaxies as a function of type and luminosity. By contrast, surveys of 102 galaxies in each of 102 clusters allow one to study cluster dynamics and populations as function of richness/overdensity. They can also be used (as in the CNOC survey) to average over structures and obtain from infall patterns at large radii. Finally, deep surveys of distant clusters yield the evolution of populations and dynamics.
7 The Merger History of the Coma Cluster
By measuring 243 new redshifts in Coma to obtain a sample of of 465 cluster members with velocities, Colless & Dunn (1996) were able to recover the merger history of the cluster from kinematic evidence. The line-of-sight velocity distribution in Coma proves to be highly non-Gaussian, which a new test for localised velocity structure shows is caused by the existence of a dynamically distinct group around NGC 4839. A maximum likelihood mixture model yields a robust partition of the sample into a main cluster around NGC 4874 and this NGC 4839 group, which accounts for about 10% of the total mass. A linear two-body orbit model indicates that the two clusters are at 74∘ to the line of sight with a separation of 0.8 h-1 Mpc, and are approaching each other at 1700 km s-1. Velocity maps of the cluster core show that there is an ongoing merger between the main cluster and another group around NGC 4889.
Several lines of evidence, including the substructure revealed in velocity space, the distribution of X-ray gas and lack of a cooling flow, the diffuse radio halo, and the cD envelopes around NGC 4874 and NGC 4839 but not NGC 4889, together imply a self-consistent merger history for Coma. In this picture, the NGC 4839 group is falling into Coma along the Great Wall from the direction of A1367 and is just beginning to penetrate the main cluster. The NGC 4889 group is partially disrupted due to its ongoing merger with the main cluster and has ejected NGC 4889, once its dominant galaxy. NGC 4874 is the original dominant galaxy of the main Coma cluster, now slightly dislodged from the bottom of the potential well by its recent encounter with NGC 4889.
8 Large Scale Structure Redshift Surveys
Redshift surveys investigating large scale structure have as their main aims the characterisation of the structure (via the power spectrum or correlation function and measures of the Gaussianity, topology and morphology of the galaxy distribution) and the determination of the overall mass density and the biasing parameter for galaxies .
Specific goals in deriving the power spectrum (or, equivalently, the correlation function ) are to link the small-scale, 0 galaxy to the much larger-scale, high- obtained from the microwave background by COBE and other anisotropy experiments. Defining the shape of gives the initial mass fluctuation spectrum, yielding clues ot both the nature of the dark matter and the value of . Current surveys give to a precision of 20% at 30 h-1 Mpc, and to within a factor of 2 at 100 h-1 Mpc. The expected turnover in at somewhat larger scales is only hinted at. Determining accurately on these scales will require massive (105–106) galaxy surveys at 0.1, while establishing the evolution of at higher redshifts will require large (104–105) surveys of galaxies at 1 and of QSOs at 1.
A crucial question is whether the large-scale (linear-regime) galaxy distribution implies an underlying Gaussian distribution of mass fluctuations, as predicted in many inflationary cosmologies. If so, the large-scale distribution is fully described by its power spectrum. On smaller scales the question is whether the topology/morphology of the distribution is consistent with the formation of structure by gravitational instability within the framework of some model for the dark matter and the spectrum of initial fluctuations. This requires surveys of compact, densely-sampled volumes.
The mass density, , and bias parameter, , are tightly coupled in the galaxy distribution, and the directly measurable quantity in most cases (e.g. from the redshift-space distortions in the distribution) is . A sufficiently large survey with galaxy type information would be able to use such methods to establish the relative biasing of the different galaxy types, a powerful constraint on theories of galaxy formation and evolution.
9 The 2dF Galaxy Redshift Survey
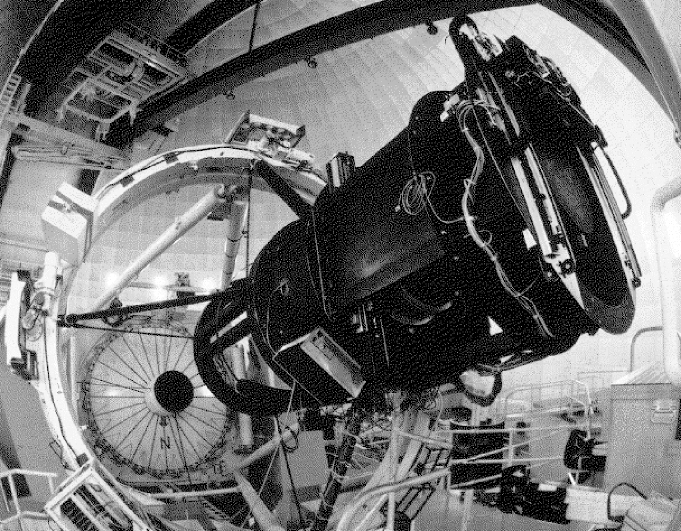
The main features of the 2dF spectrograph on the 3.9m Anglo-Australian Telescope (see Figure 4) are: (i) a 2-degree field of view with atmospheric dispersion compensation, resulting from a new 4-component prime focus corrector; (ii) 400 fibres of 2 arcsec diameter controlled by a fast robot positioner with 0.2 arcsec precision; (iii) focal plane imaging using a CCD camera to assist in field acquisition and guiding; (iv) offline configuration in 30 min, with two focal planes on a tumbler mechanism eliminating deadtime for exposures longer than this; (v) twin spectrographs each taking 200 fibres and giving resolutions of 1.7Å to 8.3Å over 3500–10000Å; (vi) pipeline reductions of data to return calibrated spectra to the observers in real-time. More details are given by Cannon (these proceedings).
Two major galaxy redshift surveys are being carried out with 2dF by a joint Anglo-Australian collaboration: a bright (19.5) survey of 250,000 galaxies and a faint (21) survey of 6000 galaxies. The overall goals of these surveys are to study large-scale structure and galaxy evolution, and especially the interrelation of structure and evolution. The bright survey limit of =19.5 (extinction-corrected) implies a mean depth for the sample of =0.1. The total area of the survey is 1700 sq.deg., comprising a contiguous 75∘12.5∘ strip in the south Galactic cap, a contiguous 65∘7.5∘ strip in the north Galactic cap, and 100 random 2dF fields over the area of the southern APM galaxy survey. The 250,000 galaxies will be sampled over this area with almost 100% completeness. The faint survey of 6000 galaxies will be carried out in override mode, taking advantage of the highest-quality observing conditons occurring 10% of the time at the AAT.
We estimate that the total time required for the survey will be 90 nights. The survey will begin towards the end of 1996, and we hope to complete it by the end of 1998. Compared to the LCRS, the 2dF survey has the same magnitude limit and redshift depth but 2.5 the area, 4 the sampling rate and 10 the total number of galaxies. The 2dF survey will be complementary to the northern SDSS redshift survey, which has a similar magnitude limit but is planned to cover a larger area and include up to 106 galaxies over it’s five-year nominal lifetime (Kron, these proceedings).
Future redshift surveys with 2dF will take advantage of having such a large multiplex advantage on a 4m-class telescope to carry out massive surveys of faint objects. For example, investing a similar amount of time in the faint survey as the bright survey would yield 50,000 redshifts for galaxies to =21, i.e. a survey twice as large as LCRS but with a mean redshift of 0.3, giving a direct view of the evolution of galaxy clustering over the last third of the history of the universe.
10 Beyond Redshift Surveys
Redshift surveys generally use R1000 and S/N10 in order to maximise the number of redshifts obtained per unit telescope time. However, large surveys with R3000 and S/N20 are needed: (i) to measure the internal motions of galaxies to the faintest possible limits; (ii) to measure star-formation rates from H flux for large, representative samples; (iii) to investigate the star-forming dwarf population (with narrow lines) at low to moderate redshift; (iv) to determine variations in the Fundamental Plane (FP) and Tully-Fisher (TF) relations as a function of luminosity, morphological type and environment; (v) to use the FP/TF relations to map peculiar motions in the local universe; and (vi) to explore the evolution of the TF/FP relations as a constraint on galaxy evolution.
Few such surveys have yet been carried out, but some first steps are already being taken towards the latter goal. Van Dokkum & Franx (1996) and Bender et al. (1996) have used the FP in clusters out to 0.5 to constrain the evolution of elliptical galaxies and obtain an estimate of , while Rix et al. (1996) and Simard & Pritchet (1996) have studied the evolution of the linewidth–luminosity relation for field galaxies in order to estimate the amount of luminosity evolution occurring in galaxies out to 0.5. At even higher redshifts, Vogt et al. (1996) have used the Keck telescope to measure rotation curves for a few galaxies out to 1. This exciting new probe of galaxy evolution is still being developed, and larger samples are clearly needed (at low redshift as well as high redshift) in order to fully understand the results hinted at in these first studies.
11 Future Prospects for Survey Spectroscopy
There are at least three main tracks for survey spectroscopy to take:
-
1.
4m-class aperture, very wide field (2∘), very large number of fibres ( several hundred): optimal for undertaking massive (106 objects) surveys of galaxies/QSOs to B23 and 1; this approach is currently exemplified by 2dF, with the future perhaps looking like LAMOST (Schmidt field, 4m aperture, 5000 fibres; see Chu, these proceedings).
-
2.
8m-class aperture, small (10′) field, low multiplex (100), ‘cheap’ spectroscopic survey telescopes: optimal for carrying out surveys of faint, low-density sources (e.g. QSOs, ALS, radio galaxies); this approach is exemplified by the Hobby Eberley Telescope (Sebring et al. 1995).
-
3.
8m-class aperture, moderate (10′) field, large (100) multiplex: optimal for massive surveys of very faint objects of high surface density such as high-redshift galaxies; exemplified by the DEIMOS optical multislit spectrograph proposed for the Keck telescope and by the optical/near-IR multi-object spectrographs proposed for the VLT (see below; also Le Fevre, these proceedings).
12 AUSTRALIS: a Multi-Object Spectrograph for the VLT
AUSTRALIS is one of two concept studies for a multi-object optical/near-infrared spectrograph optimised for high-redshift observations on ESO’s VLT (the alternate VIRMOS concept is discussed by Le Fevre, these proceedings). A near-IR spectrograph is essential because for 1 most of the familiar, strong and well-studied spectral features seen in the restframe visible have been shifted into the near-IR. A multi-object capability is likewise essential because sample size is critical for both population studies and structure surveys, and also in searching for rare objects. An 8m-class telescope is essential because normal galaxies at 1 are very faint (the median redshift of the galaxy population only reaches =1 for =21).
Features of the AUSTRALIS design include: (i) spectral range: 0.5–1.8 microns (V to H bands); (ii) field of view: 20 arcmin diameter (VLT Nasmyth); (iii) feed mode 1: up to 400 individual 1.5 arcsec fibres; (iv) feed mode 2: integral field unit, FoV 9–18 arcsec, resolution 0.25–0.5 arcsec; (v) resolving power: R4000, permitting digital OH sky-suppression; (vi) detectors: six Rockwell 10242 HgCdTe devices plus two 20482 CCDs.
A detailed performance model suggests that feasible projects for such a spectrograph on the VLT would include a redshift survey of 104 K21 galaxies (50% at 1) in 10 nights and a study of the evolution of the star-formation rate and Tully-Fisher relation via H fluxes and linewidths down to 100 km s-1 for 800 galaxies over =0.6–1.7 in 4 nights.
Such capabilities open up new horizons for studying the universe at high redshifts, and will ensure that wide-field, multi-object spectroscopy stays at the forefront of observational cosmology over the next decade and beyond.
References
Bellanger C., de Lapparent V., Arnouts S., et al., 1994, A&AS, 110, 159
Bender R., Ziegler B., Bruzual G., 1996, ApJ, accepted
Carlberg R., Yee H., Ellingson E., et al., 1996, ApJ, 462, 32
Colless M.M., Dunn A.M., 1996, ApJ, 458, 435
Cowie L.L., Songaila A., Hu E.M., Cohen J.G., 1996, ApJ, submitted
Efstathiou G., Ellis R.S., Peterson B.A., 1988, MNRAS, 232, 431
Ellis R.S., Colless M.M., Broadhurst T., Heyl J., Glazebrook K.,
1996, MNRAS, 280, 235
Heyl J.S., Colless M.M., Ellis R.S., Broadhurst T.J., 1996, MNRAS,
submitted
Lilly S.J., Tresse L., Hammer F., Crampton D., Le Fevre O., 1995, ApJ,
455, 108
Loveday J., Peterson B.A., Efstathiou G., Maddox S.J., 1992, ApJ, 390,
338
Rix H.-W., Guhathakurta P., Colless M.M., Ing K., 1996, MNRAS,
submitted
Santiago B.X., Strauss M.A., Lahav O., et al., ApJ, 446, 457
Shectman S.A., Landy S.D., Oemler A., et al., 1996, ApJ, accepted
Sebring T.A., Adams M., Ramsey L.W., 1995, BAAS, 187, #121.03
Simard L., Pritchet C.J., 1996, ApJL, submitted
Steidel C., Giavalisco M., Pettini M., Dickinson M., Adelburger
K., 1996, ApJ, 462, L17
van Dokkum P.G., Franx M., 1996, MNRAS, accepted
Vogt N.P., Forbes D.A., Phillips A.C., et al., 1996, ApJL, accepted