Mid-infrared imaging of AGB star envelopes.
II. Modelling of observed sources
Abstract
Radiative transfer modelling of AGB circumstellar envelopes is applied to a sample of AGB stars previously observed with the mid-IR imaging camera TIRCAM (Busso et al. 1996: Paper I). We present the results of our simulations, aimed at deriving the physical parameters of the envelope, such as the optical depth and the radial thermal structure, the mass loss and the dust-to-gas mass ratio. The chemical composition of the dust in the observed envelopes is discussed. The ability of different sets of dust opacities to fit the mid-infrared spectra is evaluated. The hypothesis of dust grain aging and annealing in O-rich envelopes is considered in order to explain an apparent inadequacy of the availabe opacities to describe the variety of observed spectra, as previously noted by other authors. Various possible origins of the discrepancies are discussed, together with their consequences on the dust grain formation processes. Keywords: Infrared: stars - Stars: circumstellar matter - Stars: AGB - Radiative transfer
SISSA Ref: 113/96/A (July 1996)
Submitted to Astronomy and Astrophysics
∗e-mail: marengo@sissa.it
1 Introduction
Asymptotic Giant Branch (AGB) stars are characterized by intense mass loss processes that play a central role in the star’s subsequent evolution and lead to the formation of a cold circumstellar envelope (CSE) of gas and dust. The envelope chemical composition is determined by the amount of carbon enrichment in the stellar atmosphere, due to mixing processes (the so called third dredge-up), induced by thermal pulses near the end of the AGB phase. C-rich envelopes (having [C]/[O]1 by number) mainly exist around carbon stars, while O-rich CSEs ([C]/[O]1) are associated to M giants. The transition from O-rich to C-rich envelopes is controlled by the extent of the third dredge-up, and it can occur only for AGB stars in a narrow mass range: indeed, stars with a core mass lower than 0.6 M⊙ (Straniero et al. 1995) will not undergo the third dredge-up, while H burning at the base of the convective envelope (Hot Bottom Burning) is expected to deplete carbon in the envelope of stars more massive than 5 M⊙ (Wood et al. 1983; Boothroyd et al. 1993; Frost & Lattanzio 1995), preventing them from becoming C-rich.
Despite the low dust-to-gas mass ratio (in the range 0.001-0.01), the optical properties of AGB CSEs are mainly determined by the dust grains: silicates in O-rich envelopes (Pégourié & Papoular 1985) and a mixture of Hydrogenated Amorphous Carbon (HAC, Jones et al. 1990; Duley 1993) with inclusions of SiC (Skinner & Whitmore 1988) and possibly Policyclic Aromatic Hydrocarbons (PAH, Puget & Léger, 1989; Cherchneff & Barker 1992) in C-rich CSEs. Both oxidic and carbonaceous star dust is characterized by vibrational bands positioned in the mid-IR window (at 9.7 and 18 m for silicates, at 11.3 m for SiC and at 3.3, 6.2, 7.7, 8.6 and 11.3 m for PAH); furthermore, most of the continous thermal radiation from the dusty optically opaque envelope is emitted in the same wavelenght range.
For these reasons a mid-IR search was carried out with the imaging camera TIRCAM (Busso et al. 1996, hereafter Paper I) for a sample of 16 sources, including both AGB (O-rich and C-rich) and post-AGB stars. In Paper I, photometry and colors were derived using 10% bandwidth filters at 8.8, 9.8, 11.7 and 12.5 m, and compared with the Low Resolution Spectra (LRS) from IRAS (1986), in order to establish suitable photometric criteria for discriminating between O-rich and C-rich sources and for estimating mass loss rates. The observations formed the basis for discussing the evolutionary status of the sources and their mass loss history. In Section 2 we discuss the general features of their spectra, from the point of view of the optical properties that can be inferred for dust.
Detailed numerical simulations of the CSE thermal structure is the subsequent step for a better determination of the physical parameters. One has to compute the source spectrum and the radial brightness distribution for a wide range of input parameters; comparison with observations will then allow us to estimate the optical depth of the envelopes, to derive mass loss rates, and to extract information on chemical abundances which are relevant to study the stellar nucleosynthesis (see e.g. Busso et al. 1995). With these aims in mind, we developed a numerical code for solving the problem of non-grey radiative transfer through a spherically symmetric dust shell around an evolved AGB star. We present our model in Section 3, with emphasis on the input model parameters and on the dust opacities used. In Section 4 the model results are shown for the sources observed in Paper I whose LRS is known, and a new estimate for the dust mass loss rates and the dust-to-gas mass ratio is obtained.
In Section 5 a more general discussion of the model spectra is carried on. We point out how available dust opacities seem not to be completely adequate for a detailed simulation of the mid-IR features of circumstellar dust, as previously suggested by different authors (Little-Marenin & Little 1990, hereafter LML90; Simpson 1991), and we test possible explanations. Our conclusions are summarized in Section 6.
2 Spectra of AGB Circumstellar Envelopes
The IRAS color-color diagram (van der Veen & Habing 1988) obtained by IR photometry at 12, 25 and 60 m, provides a first-order discrimination of AGB sources, according to their infrared excess, variability and C abundance. However, as shown in Paper I, such IRAS color-color diagram can lead to misclassification of AGB CSEs due to the large width of IRAS filters (this is true in particular for the one at 12 m, which cannot discriminate between silicates and carbonaceous features). Although narrow band filters allow a better discrimination (as in the case of TIRCAM photometric system), a detailed description of the dust emission/absorption features requires mid-IR spectra.
IRAS LRS (1986) provide spectral energy distributions in the wavelength range 7.7-22.6 m for about 4,000 AGB sources, which are classified with a two-digit code. The first digit (main class) is related to the spectral index of the continuum (assuming ), while the second indicates the strength of the main feature, in emission or absorption, present in the mid-IR window. In particular, spectra of O-rich sources are identified by the 9.7 m silicate feature, that is found in emission or absorption in the LRS classes 2 and 3, respectively. C-rich envelopes are mainly found in the 4 class, defined by the presence of the 11.3 m SiC feature in emission. Post-AGB objects of both types are in the main classes 6 and 7, characterized by very large infrared excess. Finally, both O-rich and C-rich sources may fall in classes 1 and 0 (featureless spectra), where a few LRS with self-absorbed SiC feature can be found (Omont et al. 1993).
Table 1 lists the spectral characteristics of the sources in Paper I with known LRS; the star AFGL 1822 was added to the TIRCAM sample in order to have an evolved O-rich envelope with the 9.7 m silicate feature in absorption. Post-AGB sources have not been included because their modelling involves very different physical conditions, dominated by the hot radiation emitted by the central star (B or A spectral type) on its way to become a white dwarf.
| # | IRAS name | Name | Type | SP type | LRS | LRS sub. |
|---|---|---|---|---|---|---|
| 1 | 02143+4404 | W And | S-star | S8,2e(M) | 22 | S |
| 2 | 08525+1725 | X CnC | C-rich | C5,4(SRb) | 42 | — |
| 3 | 09425+3444 | R LMi | O-rich | M7e(M) | 24 | Sil+ |
| 4 | 09452+1330 | CW Leo | C-rich | Ce(M) | 43 | — |
| 5 | 12427+4542 | Y CVn | C-rich | C5,5J(SRb) | 42 | — |
| 6 | 13001+0527 | RT Vir | O-rich | M8III(SRb) | 21 | — |
| 7 | 15193+3132 | S CrB | O-rich | M6,5e(M) | 24 | Sil+ |
| 8 | 15255+1944 | WX Ser | O-rich | M8e(M) | 29 | Sil |
| 9 | 16029-3041 | AFGL 1822 | O-rich | M | 32 | — |
| 10 | 16235+1900 | U Her | O-rich | M7IIIe(M) | 23 | Sil+ |
| 11 | 18040-0941 | FX Ser | C-rich | C(Lb) | 44 | — |
| 12 | 18397+1738 | NSV 11225 | C-rich | Ce | 43 | — |
Note that the LRS class 2 contains sources with different characteristics; a tentative classification is in the LML90 paper, where the silicate band profiles in optically thin O-rich envelopes are divided into seven subclasses, according to their shape and the presence of secondary peaks. The subclass for our O-rich sources, when given by LML90, is reported in Table 1; the S-star W And is tentatively attributed to the “S” feature subclass, characterized by a broad peak at 10.3 m. The other sources fall in subclass “Sil” (with a strong feature peaked at 9.8 m, typical of 2 LRS with ) and subclass “Sil+” (having a secondary “bump” at 11.3 m). LML90, and Simpson (1991) suggest that these differences be related to a kind of “mineralogical diversity” in the oxidic CSE dust, although this explanation is still controversial (see e.g. Ivezić & Elitzur 1995, hereafter IE95). We tried to model the shape of the silicate feature in our sources belonging to different subclasses using several sets of opacities and dust mixtures.
3 Our Model
Radiative transfer in circumstellar dust shells has been previously discussed by many authors (Rowan-Robinson 1980; Griffin 1990; Justtanont & Tielens 1992, Groenewegen, 1993 and, more recently, Hashimoto 1995; a detailed discussion of these models is given in Habing, 1996). A fully self-consistent modelling of envelopes around evolved late-type stars requires coupling of radiative transfer with the hydrodynamic equations of motion for the two interacting fluids (gas and dust) which constitute the stellar wind. Such an approach has been attempted by IE95: their treatment, in the hypothesis of a steady-state outflow due to constant dust-driven stellar wind, can successfully account for the observed mass loss rates and is able to reproduce the IRAS colors and visibility functions (see Ivezić and Elitzur 1996a, b) for a large sample of AGB objects in all LRS classes. More recently, models taking into account time dependent outflows have been developed to study the effect of sudden variations in the stellar parameters in connection with thermal pulses (Shönberner 1996). This analysis is necessary in order to follow the latest stages of AGB evolution, which lead to the formation of a planetary nebula; however, time variations of the mass loss rate, on a thermal pulse time scale, have negligible effects on the IR properties of at least 95% of late-type stars associated with IRAS sources (IE95).
In our model we totally neglect the dynamics of the envelope; rather, we concentrate our efforts on obtaining an accurate fit of the observed sources, paying special attention to the mid-IR interval, where the TIRCAM spectral bands are located (see Paper I). The model parameters are fixed by fitting the IRAS and TIRCAM data. For any dust mixture, the spectrum (and in particular the shape of the features) is used to estimate the optical depth of the envelope, proportional to the dust opacity and the mass loss rate. Near- and Mid-IR photometric data allow us to determine the stellar parameters , (the central star is assumed to radiate a black body spectrum at temperature ), and the inner CSE radius ; the outer radius is derived by fitting the IRAS far-IR photometry at 60 and 100 m. The source distance enters in the model only as a scale factor for the flux densities, and is determined by normalizing the spectra with the observed photometry. We first assumed the value estimated by Loup et al. (1993); then we computed our own value of , where is the total luminosity and the total flux (in L⊙, assuming a reference distance of 1 kpc) obtained by Loup et al. (1993) using IRAS fluxes.
The code computes iteratively a self-consistent thermal structure of the envelope; the emergent spectra is calculated taking into account the effect of non-isotropic scattering, absorption and thermal reemission by grains. The computation is performed on the hypotheses of: (i) spherical symmetry of the dust shell, with an density distribution, consistent with a steady outflow at constant velocity, (ii) balance between absorption and emission by the dust grains, and (iii) LTE dust radiation at the local temperature .
The dust grain composition is simulated adopting different sets of dust opacities ; the dust grain size is usually assumed to satisfy a size distribution with 0.01 m 0.25 m (Mathis, Rumpl and Nordsieck 1977, hereafter MRN; see e.g. Jura, 1996 for more recent data). The main effect of considering a grain size distribution is a broadening of the 9.8 m silicate feature (Simpson 1991), due to the non linear dependance of the opacity on ; this is however important only for and in the case of AGB CSE grains can be neglected. Hence we simply adopted for the grain size the average MRN value = 0.1 m.
3.1 Dust Opacities
Following a Chan & Kwok (1990) scaling theorem, the solution of the radiative transfer equation in spherical symmetry is scaled on the flux-averaged optical depth , where:
In equation 1, depends on frequency only through the opacity , which is thus the main parameter for modelling the spectra; for this reason, a great part of our preliminary work consisted in testing the various opacity profiles available in the literature. We now present the results of our analysis, separately for O-rich and C-rich dust.
It is well known that O-rich dust contains essentially silicate grains: they can be present as piroxens (Mg,Fe)SiO3, or as olivinæ ((Mg,Fe)2SiO4). Actually, the olivina opacity profile of Krätschmer & Huffmann (1979) is suitable for supergiants, but not for Miras like WX Serpentis (see Griffin 1993). In the case of circumstellar envelopes the silicate dust probably consist of piroxens only, with various types of impurities making them “dirty silicates”. We considered five opacity profiles for astronomical silicates.
The first is the one by Jones & Merril (1976); they introduced the concept of “dirty silicates”, though many details of their opacity profile were subsequently modified.
The second is by Draine & Lee (1984); despite its wide use and accuracy, this is not well suited for our needs, since it is based on observations of the interstellar medium, and not of the circumstellar one (see also Ossenkopf et al. 1992, hereafter OS92, and Griffin 1993).
The third is by Volk & Kwok (1988): it is based on the observed spectra of 467 AGB stars with good quality photometric data in all four IRAS bands; the spectrum obtained from this opacity is similar to the observed one, but the 9.8 m feature is slightly too much asymmetric and its peak is shifted towards redder wavelengths.
The fourth profile is the one by OS92: it is based on the previous but it is chemically and physically consistent, in the sense that computes the complex dielectric function for the dust using the Kramers-Krönig relations along with the Mie theory. Taking into account the possibility of dust annealing in the CSE, as illustrated by Stencel et al. (1990) and Nuth and Hecht (1990), the authors give the opacity in two versions, one for “warm” silicates (hereafter Oss1) and the other for “cold” ones (hereafter Oss2), depending on the physical conditions at their condensation.
The last and more recent is by David & Pégourié (1995), and is computed using Mie theory for a set of more than 300 IRAS sources with known LRS.
We obtained the best results when fitting our AGB O-rich sources with OS92 Oss1 and Oss2 opacities.
In the case of C-rich envelopes, the continuum in the spectra is usually ascribed to the presence of graphite or amourphous carbon, while the characteristic band at 11.3 m is commonly attributed to SiC, although the presence of PAH has been proposed as well. Graphite is now commonly ruled out, because of the absence in the observed spectra of its typical narrow band at 11.52 m (Draine 1984); moreover, the whole shape of the spectra obtained by using graphite (the most used opacities are by Draine & Lee 1984) does not fit the observed ones, as we tested directly. Therefore the main constituent of CSE carbonaceous dust seems to be amourphous carbon: due to the variability in its physical and optical properties, a comparison with observational data is fundamental. An accurate enough opacity profile, observationally tested for amorphous carbon is the one by Martin & Rogers (1987). More recently Rouleau & Martin (1991) presented a detailed study giving accurate sets of optical constants derived by Bussoletti et al. (1987): the set named AC1, in particular, is similar to the Martin & Rogers (1987) opacity, although more detailed; this is the opacity we used for our simulations.
Finally, in order to obtain spectra with the characteristic 11.3 m band, we admitted the presence of SiC mixed with the amorphous carbon: we choose the opacity set for -SiC (the exagonal rhomboedric cristalline form of SiC) from Pégourié (1988), which at the moment is the only accurate profile available in the literature; to obtain the optical properties for the mixture, we simply made a weighted average of the two species: we never found necessary to take a SiC percentage greater than 10%. This strongly depends on the opacity chosen for amorphous carbon; IE95, for example, used a more absorptive kind of amorphous carbon, together with Pégourié (1988) data for SiC, and found a SiC percentage up to 30%.
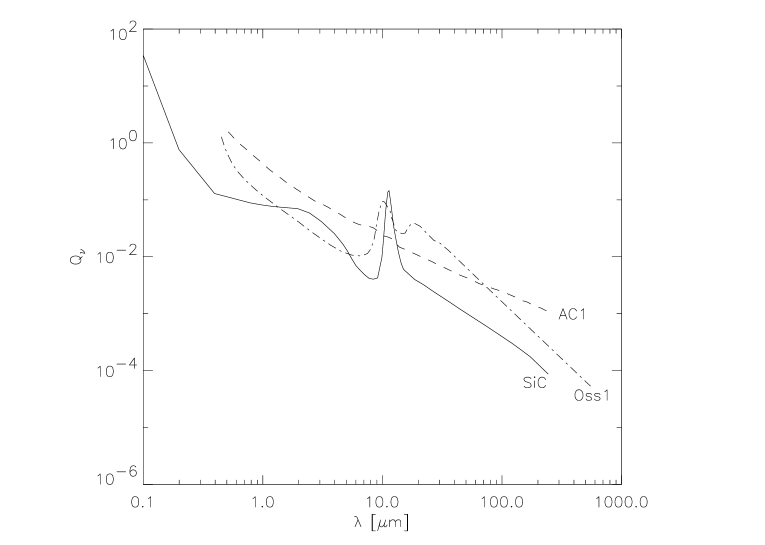
In Figure 1 we plot the final opacity profiles for silicates, amorphous carbon and SiC used in our simulations.
In our simulations we have not introduced Polycyclic Aromatic Hydrocarbons (PAH), because they are mainly excited by UV radiation, and their contribution to the dust heating and the final spectra is low for AGB stars, at least if a hot star companion is not present (Buss et al. 1991).
4 Model Results
In order to fit the IR spectra of the sources in our sample, for each set of dust opacities we computed a grid of models parameterized on the 10 m optical depth , which is proportional to the dust mass loss rate of the envelope:
where is the density of the dust grains (we assumed 3.0 g/cm3 for OS92 silicates, 1.85 g/cm3 for AC1 amorphous carbon and 2.5 g/cm3 for Pégourié 1988 SiC), is the opacity at 10 m, and is the outflow velocity of the dust. The models were computed assuming = 1 kpc, = cm, = 2500 K, = 2000 , = 4 if and = 5 if .
Figure 2 shows model spectra (in the wavelength interval 1-100 m) of O-rich envelopes for increasing , from to 1; in Figure 3 the sequence of C-rich models with from to 0 is plotted. In both cases greater optical depths cause larger infrared excesses, and the dust features (silicates 9.8 m and SiC 11.3 m) change from emission to absorption. We stopped the C-rich sequence at because this can be taken as a limit for this class of sources, considering that SiC features in absorption are rare in the LRS database (see Omont et al. 1993).


The van der Venn & Habing (1988) IRAS color-color diagram for the computed model sequences is shown in Fig. 4. The two curves are associated to increasing optical depth, and thus to increasing mass loss; note that they cross the appropriate regions of the diagram for the two classes of sources. The curves should not be considered as evolutionary tracks, because there is indication that mass loss rates do not increase monotonically during AGB evolution, rather they can have sudden variations in connection with thermal pulses (Vassiliadis & Wood 1993; see also Paper I).

4.1 Spectral Distribution
By means of our model we finally fitted the spectral distribution of the sources listed in Table 1 and we obtained some relevant physical parameters for the star (, ) and the envelope (, , ).
Moreover, we derived the dust mass loss (using Eq. 1, with from Loup et al. 1993) and the bolometric luminosity .
From Loup et al. (1993) we also obtained values (based on radio OH and HCN observations and IRAS data) for the total mass loss rate and the total emitted fluxes ; we thus estimated the dust to gas ratio (in mass fraction) and the distance for each source. Our results are summarized in Table 2.
| # | Name | ||||||||
|---|---|---|---|---|---|---|---|---|---|
| km/s | M⊙/yr | M⊙/yr | % | L⊙ | L⊙ | kpc | |||
| 1 | W And | 0.17 | 20. | 0.26 | 0.26 | ||||
| 2 | X CnC | 0.15 | 9.7 | 0.33 | 0.79 | ||||
| 3 | R LMi | 0.15 | 7.0 | 0.20 | 0.25 | ||||
| 4 | CW Leo | 1.30 | 15. | 0.10 | 0.26 | ||||
| 5 | Y CVn | 0.01 | 8.2 | 0.06 | 0.26 | ||||
| 6 | RT Vir | 0.15 | 9.3 | 0.33 | 0.67 | ||||
| 7 | S CrB | 0.15 | 6.3 | 0.14 | 0.45 | ||||
| 8 | WX Ser | 1.30 | 8.8 | 1.55 | 0.67 | ||||
| 9 | AFGL 1822 | 8.00 | 17. | 0.08 | 2.10 | ||||
| 10 | U Her | 0.15 | 13. | 0.42 | 0.06 | ||||
| 11 | FX Ser | 0.20 | 26. | 0.14 | 0.98 | ||||
| 12 | NSV 11225 | 0.02 | 14. | 0.12 | 0.65 |
Note that the dust to gas ratios are generally low (), with the exception of WX Ser. We would like however to stress that estimates of are affected by uncertainties in the grain average radius ; Eq. 2 shows that is proportional to (assuming a correct fitting of ), which is not, in this case, simply a normalization factor. The distances we obtained are all in accordance with estimates by other authors (see e.g. Loup et al. 1993).
Figure 5 shows the model spectra for a few sources reported in Table 1, superimposed to the IRAS LRS. All sources except those O-rich with less prominent silicate features (LML90’s “Sil+” and “S” subclasses) can be satisfactorily fitted by the available opacities. In the case of the S-star W And (“S” subclass), to fit the LRS spectra was necessary to use a mixture of silicate and carbonaceous dust in the proportion 1:4, being impossible to model the source using silicates dust only. The models for the sources with weak silicate features in subclass “Sil+” were obtained by fitting the continuum only; this allows us to produce reasonable values for the physical parameters listed in Table 2, but is not able to reproduce the correct profile of the dust feature. In our opinion, this is probably related to an inadequateness of the available silicate dust opacities for sources of LRS subclass “Sil+” and “S”, but we discuss other possibilities in Section 5.

4.2 Temperature Profiles
In spherical symmetry, the thermal structure of the model is expressed by a radial law giving the self-consistent dust radiative equilibrium temperature for the dust grains. The temperature profiles thus obtained depend on the dust chemical composition and on the optical depth. For large envelope radii they can be approximated by a power law , where is the asymptotic value for the logarithmic derivative of the temperature profile :
The inferred values are restricted to a limited range (see Table 3); however those for O-rich sources are systematically lower than those for C-rich ones (0.35 vs 0.40), while the case of the S-star modelled with a mixed dust composition is intermediate. This numerical result is in good agreement with the analitic formula derived by Harvey et al. (1991) for spherically symmetric dust shells having power-law opacity and density :
For Oss1 silicates in the mid- and far-IR wavelength range, while for AC1 Rouleau and Martin amorphous carbon is in the same spectral range; Eq. 4 would give for silicates and for amorphous carbon, similar to our results, appropriate for the outer parts of the envelopes, where the mid- and far-IR thermal radiation is emitted.
| Name | ||
|---|---|---|
| O-rich sources | ||
| R LMi | 0.15 | 0.348 |
| RT Vir | 0.15 | 0.349 |
| S CrB | 0.15 | 0.344 |
| U Her | 0.15 | 0.349 |
| WX Ser | 1.30 | 0.347 |
| AFGL 1822 | 8.00 | 0.332 |
| S source | ||
| W And | 0.17 | 0.385 |
| C-rich sources | ||
| Y CVn | 0.01 | 0.397 |
| X CnC | 0.15 | 0.400 |
| FX Ser | 0.20 | 0.404 |
| NSV 11225 | 0.20 | 0.404 |
| CW Leo | 1.30 | 0.404 |
5 Discussion
In order to account for the difficulties we found in modelling the O-rich envelopes of subclass “S” and “Sil+”, several possibilities can be considered: deviation from spherical symmetry, mixing between O-rich and C-rich dust and necessity of new opacities for silicates producing LRS other than “Sil” subclass.
Evidences for non-spherical symmetry of AGB CSEs arise from radio mapping, speckle interferometry, polarization studies and spectroscopic observations as well as from the shapes of planetary nebulae (Balick 1993). Departures from spherical symmetry should then be expected also for our sources (see e.g. Silvestro et al. 1996 for a photopolarimetric study of 5 sources in our sample), and may affect even the thermal IR emission, as shown in Paper I by the elongated shape of CW Leo. Axisymmetric models of AGB circumstellar envelopes have been recently developed by Collison & Fix (1991) and Lopez et al. (1995); here basically the optical depth depends on the orientation with respect to the line of sight. These models thus introduce a new free parameter that allows one to fit the dust feature strength; we notice however that the band intensity remains unchanged with the slope of the continuum, preventing the correct fitting of LRS spectra in our “S” and “Sil+” sources. Furthermore, it is not clear why deviations from spherical symmetry should be important only for these subclasses of envelopes. We conclude that, if a correct two-dimensional treatment of the system geometry is essential for the spatial description of the IR emissions, it does not significantly affect the spectra modelling.
In IE95 the IRAS colors of sources in the class are reproduced admitting mixtures of silicates (plus 20% cristalline olivine) and amourphous carbon (in the ratio 1:4). The possibility of such a mixing is controversial (dust formation in chemical equilibrium models predicts the depletion of the less abundant element between O and C, locked in CO molecules, see e.g. Salpeter 1974), but cannot be completely ruled out, since numerous O-rich stars display the SiC feature (see e.g. Willems & de Jong, 1986 and Le Van et al., 1992). Even though this hypothesis is unattractive, requiring the presence of mixtures only for sources of small optical depth, the others being well fitted by ordinary silicate opacities, we tested this prescription with our “S” and “Sil+” sources.
We have not obtained a real improvement in our “Sil+” model with mixed dust, because the introduction of a new fitting parameter (the silicate/carbon ratio) allowed only to reproduce the shape of the 9.8 m feature, but not the slope of the continuum, even in the LRS region. On the other hand, in the case of the “S” source, the injection of a large quantity of amorphous carbon dust in the envelope (80% of the total) reduced the strenght of the silicate feature making possible to fit the continuum in a large wavelengths range (even thought the result of the fitting for the continuum is not as good as in the case of silicates only). To understand this result, one should consider that the S-stars like W And are considered objects in transition between the O-rich and the C-rich class, and thus a contamination of silicate dust in a C-rich circumstellar envelope is not at all surprising.
A third possibility to have weak silicate bands in O-rich envelopes, as required in “S” and “Sil+” LRS, without the introduction of carbonaceous dust, is to assume annealing and aging of dust grains, as proposed by Nuth & Hecht (1990). Their grain condensation scheme starts with oxydation of SiO, AlO and OH in O-rich stellar winds, producing grains characterized by weaker features and secondary bands at 11-13 m; fully grown silicates with strong features condensate only later, and are thus present only in more evolved O-rich envelopes. This view is in agreement with the classification schemes of LML90, assuming that LRS subclasses are associated with dust of different ages. If the Nuth & Hecht (1990) sequence is correct, our O-rich sources with LRS subclass other than “Sil” should be associated with envelopes with less evolved dust. We have not tested LML90 predictions, because this would have required detailed dust opacities for each subclass, presently not available. Fully developed radiative transfer modelling is in fact necessary even to model optically thin envelopes as shown by IE95, and should be performed to extract dust opacities from astronomical data.
6 Conclusions
Radiative transfer modelling of circumstellar envelopes, based on simple assumptions as spherical symmetry and steady state outflows, allows detailed fitting of infrared data for single sources and the determination of system parameters as the distance, luminosity and total amount of dust ejected by the central star. The correlation with radio observations (giving informations of the total mass loss) will thus provide estimates of the dust to gas mass ratio for each modelled source. The accuracy of the fitting procedure depends mainly on the available opacities, expecially in the mid-IR range where the dust features are present; a good description of the mid-IR spectra is in fact essential for the determination of the envelope optical depth and chemical composition.
The necessity of accurate spectral modelling is becoming more and more important taking into account the better spectroscopic capabilities of ground based mid-IR cameras and ISO data.
Our models confirm that the shape of carbonaceous dust features are reproduced assuming a mixture of amorphous carbon, described by AC1 Rouleau & Martin (1991) opacity, and (10%, or less) Pégourié (1988) SiC. Minor components (as PAH) might be present, but the quality of IRAS LRS do not allow their detection.
Models for O-rich envelopes associated to M and S stars suggest the possibility of different varieties of silicate dust, even if mixing between oxidic and carbonaceous dust should be considered, at least in the case of transition objects as the S-stars. If the LML90 scheme is valid, we can recognize in the Ossenkopf 1 “dirty silicates” (OS92) the correct opacity for subclass “Sil” silicates, associated to LRS spectra and a mixture of Ossenkopf 1 “dirty silicates” (OS92) with a large amount of Rouleau & Martin (1991) AC1 amorphous carbon (in the ratio 1:4 for the subclass “S” sources). For the other subclasses accurate fits need opacities which at present are not available.
The dust-to-gas mass ratios we obtained are generally low (between 0.1 and 0.5 %), except in the case of the O-rich “Sil” source WX Ser (1.5%); there is a tendency for having lower dust-to-gas ratios for C-rich envelopes, but this result may be influenced by uncertaintes in the average grain radius (that can be different between oxidic and carbonaceous dust) and by the inaccurate fitting of the silicate features for O-rich sources other than “Sil” subclass. New models taking into account the global dynamics of the system and coupling the dusty component with the gaseous one will allow direct correlation between IR and radio data, and will increase the accuracy in the determination of the dust-to-gas ratio, giving better insight on the dust condensation processes responsible for the mass loss in AGB stars and the formation of circumstellar envelopes.
References
- [1] Balick, B. 1993, in: Planetary Nebulae, ed. R. Weinberger, A. Acker, Proc. IAU Symp. 155, Kluwer, Dordrecht, p. 131
- [2] Boothroyd, A.I., Sackmann, I.J., Ahern, S.C. 1993, ApJ 416, 762
- [3] Buss, R.H., Tielens, A.G.G.M., Snow, T.P. 1991, ApJ 372, 281
- [4] Busso, M., Lambert, D.L., Beglio, L. 1995, ApJ 446, 775
- [5] Busso, M., Origlia, L., Marengo, M., Persi, P., Ferrari-Toniolo, M., Silvestro, G., Corcione, L., Tapia, M., Bohigas, J. 1996, A&A ,, 311 253
- [6] Bussoletti, E., Colangeli, L., Borghesi, A., Orofino, V. 1987, A&AS 70, 257
- [7] Chan, S.J., Kwok, S. 1990, A&A 237, 354
- [8] Cherchneff, I., Barker, J.R. 1992, ApJ 416, 769
- [9] Collison, A.J., Fix, J.D. 1991, ApJ 368, 545
- [10] David, P., Pégourié 1995, A&A 293, 833
- [11] Draine, B.T. 1984, ApJ 227, L71
- [12] Draine, B.T., Lee, H.M. 1984 ApJ 285, 89
- [13] Duley, W.W. 1993, in: Interstellar Dust, ed. L.J. Allamandola, A.G.G.M. Tielens, Proc. IAU Symp. 135, Kluwer, Dordrecht, p.141
- [14] Frost, C.A., Lattanzio, J.C. 1996, in proc. “Stellar Evolution: What Should Be Done”; 32nd Liége Int. Astroph. Coll., 1995, in press
- [15] Griffin, I.P. 1990, MNRAS 247, 591
- [16] Griffin, I.P. 1993, MNRAS 260, 831
- [17] Groenewegen, M.A.T. 1993, Ph.D. thesis, Univ. of Amsterdam
- [18] Habing, H.J. 1996, A&AR 7, 97
- [19] Hashimoto, O. 1995, ApJ 442, 286
- [20] Harvey, P.M., Lester, D.F., Brock, D., Joy, M. 1991 ApJ 368, 558
- [21] IRAS Catalogues and Atlases, Atlas of Low Resolution Spectra 1986, Iras Science Team, A&AS 65, 607
- [22] Ivezić, Ž., Elitzur, M. 1995, ApJ 445, 415 (IE95)
- [23] Ivezić, Ž., Elitzur, M. 1996a,b, MNRAS in, press
- [24] Jones, A.P., Duley, W.W., Williams, D.A. 1990, QJRAS 31, 567
- [25] Jones, T.W., Merrill, K.M. 1976, ApJ 389, 400
- [26] Jura, M. 1996,ApJ in, press
- [27] Justtanont, K., Tielens, A.G.G.M. 1992, ApJ 389, 400
- [28] Käufl, H.U., Jouan, R., Lagage, P.O, Masse, P., Mestreau, P., Tarrius, A. 1992, The Messenger 70, 67
- [29] Krätschmer, W., Huffmann, D.R. 1978, A&SS 61, 195
- [30] Little-Marenin, I.R., Little, S.J. 1990, AJ 99, 1173 (LML90)
- [31] Le Van, P.D., Sloan, G.C., Little-Marenin, I.R., Grasdalen, G.L. 1992 ApJ 392, 702
- [32] Lopez, B., Mékarnia, D., Lefèvre, J. 1995 A&A 296, 752
- [33] Loup, C., Forveille, T., Omont, A., Paul, J.F. 1993, A&AS 99, 291
- [34] Martin, P.G., Rogers, C. 1987, ApJ 322, 374
- [35] Mathis, J.S., Rumpl, W., Nordsieck, K.H. 1977, ApJ 217, 425
- [36] Nuth, J.A.III, Hecht, J.H. 1990, A&SS 163, 79
- [37] Omont, A., Loup, C., Forveille, T., te Lintel Hekkert, P. Habing, H., Sivagnanam, P. 1993, A&A 267, 515
- [38] Ossenkopf, V., Henning, Th., Mathis, J.S. 1992 A&A 261, 567 (OS92)
- [39] Pégourié, B. 1988, A&A 194, 335
- [40] Pégourié, B., Papoular, R. 1985, A&A 142, 451
- [41] Puget, J.L., Léger, A. 1989, ARA&A 27, 261
- [42] Rouleau, F., Martin, P.G. 1991, ApJ 377, 526
- [43] Rowan-Robinson, M. 1980, ApJS 44, 403
- [44] Salpeter, E.E. 1974, ApJ 193, 579
- [45] Silvestro, G., Roseo, E., Marengo, M., Busso, B., Origlia, L., Scaltriti, F. 1996, in proc. I Torino Workshop: Evolution and Nucleosynthesis in AGB Stars and Their Descendants, ed. M. Busso and R. Gallino
- [46] Shönberner, D. 1996, comunication at the I Torino Workshop: Evolution and Nucleosynthesis in AGB Stars and Their Descendants
- [47] Simpson, J.P. 1991, ApJ 368, 570
- [48] Skinner, C.J., Whitmore, B. 1988, MNRAS 237, 79
- [49] Stencel, R.E., Nuth, J.A.III, Little-Marenin, I.R., Little, S.J. 1990 ApJ 350, L45
- [50] Straniero, O., Gallino, R., Busso, M. et al. 1995, ApJ 440, L85
- [51] van der Veen, W.E.C.J, Habing, H.J. 1988, A&A 194, 125
- [52] Vassiliadis, C., Wood, P.R. 1993, ApJ 413, 641
- [53] Volk, K., Kwok, S. 1988, ApJ 331, 435
- [54] Willems, F.J., de Jong, T. 1986, ApJ 309, L39
- [55] Wood, P.R., Bessel, M.S., Fox, M.W. 1983, ApJ 272, 99