11.09.4;11.17.1;11.17.4 Q0439-433;11.08.1
11institutetext: 1Institut d’Astrophysique de Paris - CNRS, 98bis Boulevard
Arago, F-75014 Paris, France
2UA CNRS 173- DAEC, Observatoire de Paris-Meudon, F-92195 Meudon
Principal Cedex, France
3 Servide d’Aéronomie du CNRS, BP 3, F-91371 Verrières-le-Buisson
Cedex, France
4 Kapteyn Astronomical Institute, Postbus 800, NL-9700 AV Groningen, The Netherlands
\offprintsP. Petitjean
A damped Ly candidate at 0.1 toward Q 0439–433 ††thanks: Based on observations collected at the European Southern Observatory, La Silla, Chile ††thanks: Based on observations obtained with the NASA/ESA Hubble Space Telescope by the Space Telescope Institute, which is operated by AURA, Inc., under NASA contract NAS 5-26555
Abstract
We report on the detection of a = 0.101 galaxy projected on the sky at 4.2 arcsec (or 5.2 kpc for = 0.5) from the quasar Q 0439–433 ( = 0.594). The HST spectrum of the quasar shows strong Mg ii, Fe ii, Si ii, Al ii and C iv absorption lines at the same redshift as the galaxy. The equivalent width ratios of the low ionization lines indicate that this system is probably damped with a neutral hydrogen column density of (H i) 1020 cm-2. The C iv doublet presents a complex structure, and in particular a satellite with a velocity = 1100 km s-1 relative to the galaxy. Additional HST and redshifted 21cm observations of this QSO-galaxy pair would offer an ideal opportunity to study the morphology of a damped absorber and the kinematics of the halo of a low-redshift galaxy.
keywords:
Galaxies: ISM, quasars:absorption lines, quasars:individual:Q 0439-433, Galaxies: halo,1 Introduction
QSO absorption line systems probe the baryonic matter over most of the history of the Universe (0 5). The so-called damped Ly (hereafter DLA) systems are characterized by a very large H i column density ((H i) 21020 cm-2), similar to the one usually seen in local spiral disks. Such systems at large redshift ( 2–3) are thought to be produced by proto-galactic disks. The main argument in favor of this conclusion is that the cosmological density of gas associated with these systems is of the same order of magnitude as the cosmological density of stars at present epochs (Wolfe 1996). Moreover they present a metallicity (Pettini et al. 1994), while strong metal line systems have been demonstrated to be associated with galaxies at low and intermediate (e.g. Bergeron & Boissé 1991). The detailed study of low- DLA systems is thus crucial as information can be gathered both on the absorbing gas via optical and UV spectroscopy (kinematics, ionization state) and the associated galaxy (impact parameter, morphology, star formation activity). However very few DLA systems are known at low- (Lanzetta et al. 1995, Rao et al. 1995). Moreover identifying the galaxy associated with low- DLA systems is not easy as it often lies very close to the quasar (Steidel et al. 1994). Indeed, using HST high spatial resolution images of the field of seven quasars whose spectra present DLA lines at intermediate redshifts (0.4 1), Le Brun et al. (1996) show that, in all cases, at least one galaxy candidate is present within 4 arcsec from the quasar, the closest being at 0.75 arcsec. There is no dominant morphological type in their sample: three candidates are spiral galaxies, three are compact objects and two are amorphous low surface brightness galaxies.
Here, we report on the detection of a galaxy projected at 4.2 arcsec (or 5.2 kpc for = 0.5 at = 0.101) from the quasar Q 0459–433. The galaxy has the same redshift as a strong Fe ii-Mg ii-C iv metal line system detected in HST-FOS spectra.
2 Observations
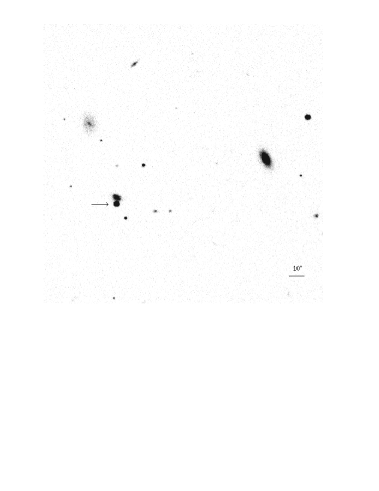
B, V, R and I broad-band images of the rich field around Q 0439–433 and spectra of the QSO and galaxy were obtained on 20 and 22 February 1996, with EMMI mounted on the NTT. Fig. 1 shows the B-band image after flat-fielding and flux-calibration. The scale is given by a tick mark of size 10 arcsec. The quasar is marked with an arrow; a galaxy is seen 4.2 arcsec north of it. B, V, R and I magnitudes for the quasar and the galaxy are 17.21, 16.84, 16.75, 16.44 and 18.76, 17.74, 17.24, 16.74 respectively with an error of 0.05 magnitude. The galaxy luminosity is thus . Its inclination measured on the R and I images is assuming this is a spiral galaxy.
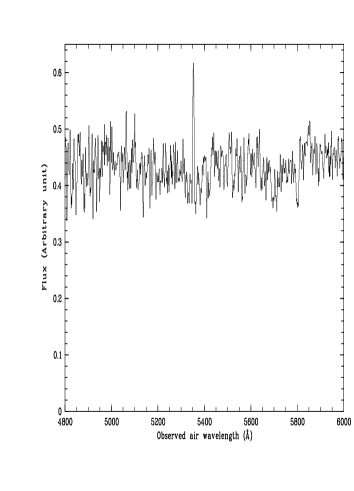
Mg ii2797, [Ne v]3426, [O ii]3727 and [Ne iii]3869 emission lines from the quasar are detected at a mean redshift of 0.594. The galaxy spectrum is displayed in Fig. 2. It presents a spatially resolved emission line with Å at 5353.08 (on top of a broad absorption feature), identified as H at = 0.1012; this value is confirmed by the presence of the Mg i absorption blend and the Ca + Fe E absorption band at 5700.3 and 5800.9 Å for a redshift of 0.1014 and 0.1009 respectively.
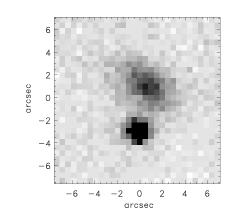
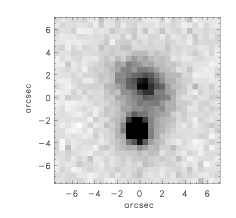
The infrared observations were carried out on 27-28 January 1995, with the ESO IRAC2B camera (Moorwood et al. 1992) mounted on the 2.2 m telescope. The detector is a 256256 NICMOS3 array. We used lens C in the K’ and J–bands with a resolution of 0.52 arcsec per pixel. The seeing was typically 1 arcsec or slightly better. Every 2 min, we moved the object on the array by about 10 arcsec. The image of the sky has then been obtained by median-filtering all the images. Each image has then been dark-subtracted and flat-fielded using the normalized sky-image. Accurate registration is obtained by determining the peak of the 2D correlation function between images. The total integration time is 100 min in K’ and 25 min in J. The final result is displayed in Fig. 3. The magnitudes of the quasar and the galaxy in J and K’ are 16.1, 14.5 and 16.2, 14.7 respectively.
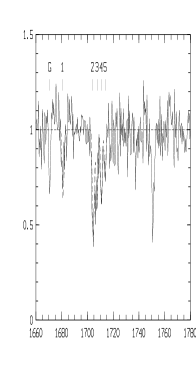
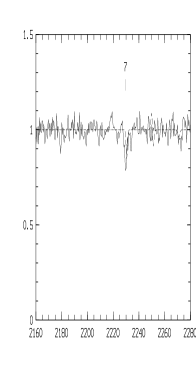
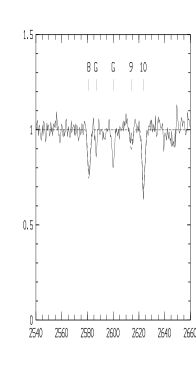
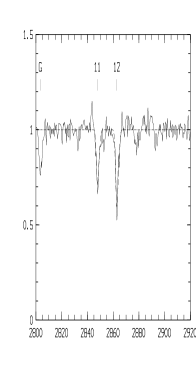
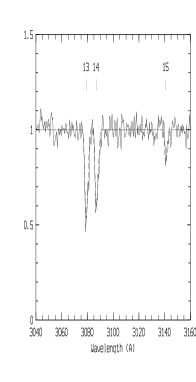
Spectroscopic observations of Q 0439–433, yet unpublished, were accessed from the HST archive. The observations were made using the Faint Object Spectrograph with the G190H grating (over the wavelength range 1600–2300 Å, for a resolution of 1.35 Å FWHM) and with the G270H grating (over the wavelength range 2250–3250 Å, for a resolution of 1.92 Å FWHM). The data were calibrated using the standard pipeline reduction techniques. The zero point of the wavelength scale was determined requiring that Galactic interstellar absorptions occur at rest. We concentrate on the = 0.101 system. Table 1 gives the characteristics of the lines detected in this system (observed wavelengths and equivalent widths, errors from the adjacent noise, identifications and corresponding redshifts). Fig. 4 shows portions of the spectrum with the lines of interest.
3 Results
3.1 A galaxy at = 0.3848
During the spectroscopic observation, the long-slit was oriented north-south and happened to intercept a faint object located 25.8 arcsec north of the quasar (see Fig. 1). The spectrum presents an emission line at 5161.3. The identification with [O ii]3727 gives a redshift of = 0.3848. There is no absorption line in the HST data at this redshift with a 3 observed equivalent width limit of 0.3 Å. The projected distance between the object and the line of sight to the quasar is 324 kpc ( = 0.5). This large distance is consistent with the idea that the metal line systems at intermediate redshift arise in galaxy halos with radius of the order of 35 kpc (e.g. Bergeron & Boissé 1991, Steidel 1993).

| N. | Identification | ||||
| Å | Å | Å | |||
| 1 | 1680.75 | 0.71 | 0.14 | SiII1526 | 0.10090 |
| 2 | 1704.91 | 1.40 | 0.14 | CIV1548 | 0.10122 |
| 3 | 1707.40 | 0.90 | 0.14 | CIV1550 | 0.10100 |
| 4 | 1710.85 | 0.70 | 0.14 | CIV1548 | 0.10506 |
| 5 | 1713.70 | 0.50 | 0.14 | CIV1550 | 0.10506 |
| 6 | 1838.77 | 1.25 | 0.12 | AlII1670 | b |
| 7 | 2229.60: | ZnII2026 | b | ||
| 8 | 2581.19 | 0.60 | 0.10 | FeII2344 | 0.10109 |
| 9 | 2614.05 | 0.22 | 0.10 | FeII2374 | 0.10090 |
| 10 | 2623.51 | 0.98 | 0.10 | FeII2382 | 0.10104 |
| 11 | 2847.89 | 0.94 | 0.10 | FeII2586 | 0.10099 |
| 12 | 2862.87 | 1.07 | 0.10 | FeII2600 | 0.10103 |
| 13 | 3078.92 | 1.64 | 0.10 | MgII2796 | 0.10105 |
| 14 | 3086.64 | 1.39 | 0.10 | MgII2803 | 0.10098 |
| 15 | 3140.89 | 0.29 | 0.10 | MgI2852 | 0.10105 |
| (NTT) | 4333.74: | 0.39 | 0.15 | CaII3934 | 0.10139 |
| a 1 detection limit | |||||
| b Blended | |||||
| Velocitya | C iv | Si ii | Fe ii | Mg ii | Mg i | Zn ii |
|---|---|---|---|---|---|---|
| -16 | 14.7 | 15.5: | 14.7 | 14.8 | 12.6 | 13.0: |
| 136 | 13.8 | 13.8 | 13.6 | 14.3 | 12.0 | 12.5 |
| 1100 | 14.4 | |||||
| a relative to = 0.1010 in km s-1 | ||||||
3.2 The absorption system and the associated galaxy at = 0.101
Strong Fe ii and Mg ii lines are present in the HST spectrum with very good redshift agreement. The mean redshift is = 0.1010. It is apparent from Fig. 4 that the lines are blends of several components. Given the limited resolution of the spectra, it is only possible to perform a rough decomposition. We obtain however a good overall fit with two components with Doppler parameters = 15 km s-1, separated by 150 km s-1. The derived column densities are given in Table 2.
The ratio (Fe ii2382)/(Mg ii2796) 0.6 indicates that the system is certainly of fairly high H i column density ((H i) 1019 cm-2, Bergeron & Stasińska 1986). The detection of a strong Mg i2852 absorption line (rest equivalent width = 0.26 Å) further supports this conclusion. Indeed the Fe ii, Mg ii and Mg i equivalent widths are very similar to those observed in the 21 cm absorber ((H i) cm-2) at = 0.395 towards Q 1229021 (Lanzetta & Bowen 1992). There is an absorption feature at 2229.6 which we would normally not attribute to Zn ii2026 at = 0.101 because the wavelength discrepancy (120 km s-1) is slighly larger than the resolution. However the feature has a red wing that could be due to Zn ii, in which case we find log (Zn ii) 13.3. There is an absorption feature at 4333.74 in the NTT spectrum that could be identified with Ca ii3934 at = 0.10139. The associated Ca ii3969 is below our detection limit of Å (1 ). The non-detection of Ca ii in a strong Mg ii system would not be surprising however. Bowen et al. (1991) have shown that the distribution of the calcium-absorbing gas is quite inhomogeneous in present-day galaxies even at very small impact parameters (kpc).
There is a strong C iv system coincident in redshift with the low ionization lines. The C iv and Mg ii doublets are spread over 150 km s-1. However the velocity distribution of the gas is different in C iv and Mg ii (Doppler parameters of 60 km s-1 were used to fit the C iv lines) as often observed in DLA systems where Mg ii and C iv are thought to probe galactic disks and haloes respectively (e.g. Turnshek et al. 1989). The low ionization lines have equivalent width typical of the absorption lines produced by the Milky Way gas in the spectra of extra-galactic objects (Savage et al. 1993). However the C iv lines are much stronger in the present system. Moreover there is an additional C iv system redshifted relative to the galaxy by about 1100 km s-1. Its origin is unclear but could be due to a companion. Several candidates are present in the field within 35 arcsec (or 45 kpc, see Fig. 1). High resolution imaging of the field with HST is needed to investigate the morphology of the galaxy. Indeed, although a faint spiral feature can be seen in the K’-band and optical images, the morphology of the galaxy is unclear. The colours however are indicative of a spiral galaxy.
4 Conclusion
It seems likely that the = 0.101 Mg ii-Fe ii-C iv absorption system detected in the spectrum of Q 0439-433 is a damped Ly system of moderate column density ((H i) 1020 cm-2). This conclusion is supported by the large (Fe ii)/(Mg ii) 0.6 equivalent width ratio, the presence of a strong Mg i absorption and strengths of the absorptions by low ionization species similar to what is observed for damped systems. The absorption in the X-ray spectrum of Q 0439-433 corresponds to (H i)cm-2 (Wilkes et al. 1992) with a Galactic contribution of cm-2 (Lockman & Savage 1995). This is consistent with the above estimate of the H i column density. Q 0439–433 is a flat-spectrum radio-source with a flux of 0.3 Jy at 2.7 GHz (Peterson & Bolton 1972): it is then possible to carry out a detailed study of the kinematics through the 21cm absorption line that is sensitive to gas with low spin temperature; on the other hand, HST+STIS spectra should provide an accurate determination of the total H i column density, and in turn may lead to evaluate the H i spin temperature. This QSO-galaxy pair is an ideal case to study the morphology of a damped absorber and the kinematics of the halo of a low-redshift galaxy.
Acknowledgements.
AS thanks financial support under grant no. 781-73-058 from ASTRON which is funded by the NWO.References
- [1] Bergeron J., Boissé, P., 1991, A&A 243, 344
- [2] Bergeron J., Stasińska G., 1986, A&A 169, 1
- [3] Bowen D.V., Pettini M., Penston M.V., Blades C., 1991, MNRAS 249, 145
- [4] Lanzetta K.M., Bowen D.V., 1992, ApJ 391, 48
- [5] Lanzetta K.M., Wolfe A.M., Turnshek D.A., 1995, ApJ 440, 435
- [6] Le Brun V., Bergeron J., Boissé P., Deharveng J.M., 1996, A&A (submitted)
- [7] Lockman F.J., Savage B.D. 1995, ApJS 97, 1
- [8] Moorwood A., Finger G., Biereichel P. et al., 1992, The Messenger 68, 61
- [9] Peterson B.A., Bolton J.G. 1972, Astrophys. Letters 10, 105
- [10] Pettini M., Smith L.J., Hunstead R.W., King D.L., 1994, ApJ 426, 79
- [11] Rao S.M., Turnshek D.A., Briggs F.H., 1995, ApJ 449, 488
- [12] Savage B.D., Lu L., Bahcall J.N., et al., 1993, ApJ 413, 116
- [13] Steidel C.C., 1993, J.M. Shull and H.A. Thronson Jr. (eds) Proc. of the Third Tetons Summer School, The Environment and Evolution of Galaxies, Kluwer, Dordrecht, p. 263
- [14] Steidel C.C., Pettini M., Dickinson M., Persson S.E., 1994, AJ 108, 2046
- [15] Turnshek D.A., Wolfe A.M., Lanzetta K.M., et al., 1989, ApJ 344, 567
- [16] Wilkes B.J., Elvis M., Fiore F., et al., 1992, ApJL 393, L1
- [17] Wolfe A.M., 1996, in ‘QSO absorption lines’, G. Meylan (Ed.), Springer, Garching, p.13