Physical Conditions in Low Ionization Regions of the Orion Nebula11affiliation: Based in part on observations made with the NASA/ESA Hubble Space Telescope, obtained at the Space Telescope Science Institute, which is operated by AURA, Inc., under NASA contract NAS5-26555
Abstract
We reexamine the spectroscopic underpinnings of recent suggestions that [O I] and [Fe II] lines from the Orion H II region are produced in gas where the iron-carrying grains have been destroyed and the electron density is surprisingly high. Our new observations show that previous detections of [O I] 5577 were dominated by telluric emission. Our limits are consistent with a moderate density ( cm-3) photoionized gas. We show that a previously proposed model of the Orion H II region reproduces the observed [O I] and [Fe II] spectrum. These lines are fully consistent with formation in a dusty region of moderate density.
Astrophysical Journal Letters, 1996, in press
1 Introduction
The Orion Nebula is the defining blister H II region (Zuckerman (1973); Balick, Gammon, & Hjellming (1974)). A star cluster ionizes the skin of the molecular cloud, causing an expansion away from the molecular cloud towards us. The H II region is in photoionization equilibrium with a density in concert with that of the background photodissociation region (Tielens & Hollenbach (1985)), and both regions are dusty with high depletions of the refractory elements (Rubin, Dufour, & Walter (1993)).
Bautista, Pradhan, & Osterbrock (1994; hereafter BPO), Bautista & Pradhan (1995; hereafter BP95), and Bautista, Peng, & Pradhan (1996; hereafter BPP) have recently suggested that [O I] and [Fe II] lines are produced by a warm ( K) region with very high electron density ( cm-3) and a solar iron abundance. This would be surprising for such a dusty environment, but would have important implications for grain destruction mechanisms. Here we use better spectroscopic data and new photoionization calculations to reexamine these claims.
2 The [O I] Spectrum
BP95’s claims were based in part on their analysis of the [O I] intensities reported by Osterbrock, Tran, & Veilleux (1992; hereafter OTV) and Baldwin et al. (1991; hereafter BFM). In these low-resolution spectra the Orion [O I] lines were completely blended with the telluric emission which varies with time and position on the sky. In the case of [O I] 5577, the telluric emission is much stronger than nebular emission, and no careful subtraction could yield an accurate measurement of this line. Both BFM and OTV assigned large uncertainties to their measurement of [O I] 6300, and did not claim any significant measurement of [O I] 5577.
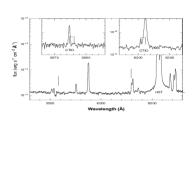
We have two sets of observations which dramatically improve on these measurements. First, we used the Faint Object Spectrograph on the Hubble Space Telescope (HST) with the 0.86″ circular aperture and the G570H grating on 1995 October 23/24 (UT). We made 225 s integrations at positions 1SW (, ) = (, –05o23′415) and x2 (, –05o23′575), roughly 30″ WSW and S, respectively, from Ori C. The summed spectrum is presented in Figure 1. Line strengths were measured with Gaussian fits to the profiles and are presented in Table 1 where they are given relative to He I 6678 and are uncorrected for interstellar extinction. We note that the HST spectra are not affected by telluric emission. The diode glitch between [Cl III] 5538 and [O I] 5577 in the flat fields does not impact our analysis.
Also, a spectrum was taken with the Cassegrain echelle spectrograph on the 4m Blanco Telescope at CTIO, on 12 January 1996. This provided an 11 km s-1 resolution spectrum at a time when the Earth’s motion split the nebular lines from the telluric emission. The spectra were extracted over a slit width of 1″ and length of 12.5″, centered on the BFM position 1 at 37″ W of Ori C. The line intensities are in Table 1 and parts of the spectra are shown in Figure 1.
Orion has a spectrum with a strong point to point variation (e.g., Peimbert & Torres-Peimbert (1977)) causing the differences in the two spectra. The CTIO spectrum at the BFM position has the higher ionization. The spectrum is similar to that reported by OTV for another position in the nebula. Table 2 gives reddening corrected intensities relative to H, using BFM’s extinction for the CTIO data; for our HST data, we adopt C(H from the composite H/H ratio. The CTIO data in Table 2 were renormalized using the He I 6678/H intensity ratio reported by BFM.
Limits to the [O I] ratio are needed to set for an assumed . In neither spectrum was [O I] 5577 detected, but we have obtained a much stricter upper limit. The observed limits are (CTIO) and (HST) and the reddening corrected ratios are and . The superior spectral resolution is the primary reason the CTIO spectrum has the more stringent limit. This limit is very different from the ratio of 22 adopted by BP95, and shows that warm dense gas does not contribute to the [O I] spectrum.
The CTIO [S II] 6716/6731 ratio (0.53) indicates a -insensitive density of cm-3 (Osterbrock (1989)). The [N II] 5755/6583 ratio (0.018) indicates of 10,100 K, fairly independent of in this range. The HST-derived properties are similar. Assuming K, the CTIO [O I] ratio limit sets the limit cm-3, consistent with the [S II] and much lower than the density deduced by BP95. Assuming [S II], we find that the [O I] ratio limit sets the limit K, consistent with the [N II] spectrum. These are all conventional Orion H II region numbers; we conclude that the [O I] spectrum is consistent with its formation in gas of moderate density ( cm-3). The photoionization calculations presented below predict the [O I] ratio to be .
3 The [Fe II] Spectrum
Table 3 shows the observed (extinction corrected) [Fe II] line ratios from OTV and Lowe et al. (1979) and some predictions. The claim by BPO that the [Fe II] lines come from a high-density region in Orion is based on a collisional model of the Fe II atom, which reproduces the observed optical to near-infrared line ratios at density cm-3. Table 3 shows the collisional model reproduced from Table 2 of BPP ( cm-3 and K, using new Fe II collision strengths described by Bautista & Pradhan 1996, hereafter BP96). The predictions of the collisional model are sensitive to the adopted collision strengths. Our model I recalculates the line ratios for the same collisional model, using the publicly available collisional data from Zhang & Pradhan (1995; hereafter ZP) also used in our photoionization models below. This shows that the lines 4815, 5159, 5262, and 5334 are stronger by a factor of two than in the BP96-based model in BPP because of different collision strengths. Also shown in Table 3 are line ratios we calculated for a density more typical of standard Orion models, cm-3 (model II). At this density, there is clearly a requirement for some mechanism other than simply collisions to populate the upper levels of the Fe II that produce the optical lines.
The alternative to collisional excitation, pumping of [Fe II] lines by the incident continuum, was considered by BPP (see also Lucy 1995). The equation used by BPP is correct in the optically thin limit. However, the ultraviolet lines dominating the pumping are usually optically thick and line self-shielding must be included if energy is to be conserved (Ferland 1992). The correct formulation of the constant temperature problem outlined in BPP should include the column density as an additional free parameter.
To model the production of the [Fe II] lines more realistically, we incorporated a 371 level Fe II model atom into Cloudy (Ferland et al. (1996), Verner et al. (1996)). Collision data for our model atom are from ZP, radiative data mainly from Quinet, Le Dourneuf, & Zeippen (1996) and Nahar (1995), and energy levels from Johansson (1994). A cloud is divided into zones, the ionization and are determined self-consistently, and the emission is determined for the local optical depths. We developed the code to model the broad line regions of quasars (Verner et al. 1995, 1996), incorporating the physics described by Wills, Netzer, & Wills (1985). We included pumping by line overlap from all emission lines included in Cloudy, by Fe II line overlap, and by the incident continuum. We verified that the Fe II atom goes to LTE in the high-density limit, and that in the low density limit each excitation is followed simply by radiative cascades. A simple limit of our Fe II model (one zone, constant temperature, constant density, no continuum radiation flux, no line pumping, no interactions with other species) corresponds to the BPO and BPP collisional model, and we can reproduce in this limit the Fe II line ratios presented in Figure 2 of BPO, using their atomic data. Note that Figure 2 of BPO erroneously compared the predicted ratio with the observed inverted ratio, although their caption for Figure 2 stated the ratio to be .
Tables 2 and 3 present results of our photoionization calculations. Model A is calculated with the parameters taken from BFM with improved gas-phase elemental abundances based on results from OTV and Rubin et al. (1991, 1992): H:He:C:N:O:Ne:Na:Mg:Al:Si:S:Cl:Ar:Ca:Fe , grains, ionization by the central star Ori C, and a hydrostatic blister. Results of model A differ from the original BFM model, since the underlying atomic database has been improved considerably. Model B has the same parameters as model A, but the incident continua from the other three Trapezium stars are included (an estimated 70% of the total flux at 2300 Å is due to Ori C). In models A and B, the gas pressure was kept constant. Model C is the same as model B, except that the total (gas and radiative) pressure is kept constant; this reveals some sensitivity of the predicted spectrum to the assumed pressure law.
Table 3 highlights the [Fe II] line ratios obtained from our photoionization models. A comparison with the observed line ratios and with the line ratios calculated within the collisional model at the same density cm-3 (model II) indicates that the upper levels of the Fe II atom, those that produce the optical lines, can be effectively populated by continuum pumping. The lower levels that produce the 8617, 8892, and 12567 lines are mostly populated by collisions in both photoionization and collisional models. Note therefore the sensitivity of the optical to near-infrared [Fe II] line ratios to the increased pumping from the other Trapezium stars (model B versus model A).
Further evidence against high electron densities in the [Fe II] emitting region in Orion comes from infrared observations by Lowe et al. (1979). They find that the 12567 line is the only Fe II line clearly detected in the infrared spectrum of Orion – it is actually the strongest [Fe II] line in the infrared and optical. Our models at cm-3 predict that the 12567 line is times stronger than the 8617 line, in good agreement with the observations. If the 12567 line were 2–3 times weaker than the 8617 line as predicted at cm-3, it would not have been detected at all.
Table 2 includes the relative strength of [Fe II] 8617 compared to lines of other species, information crucial to abundance analysis. Our photoionization models match the observations in Tables 2 & 3 quite well. The strongly depleted Fe/H in the gas phase, , is close to the value found from KAO observations of the ground state [Fe III] 22.9m line (Erickson et al. (1989) and in preparation). Even with solar abundances, iron is not a major coolant in Orion, and so the intensities of [Fe II] lines scale linearly with abundance. Therefore, if solar Fe/H (BPO, BP95) were used instead, the predicted [Fe II] lines would be 11 times stronger and very discrepant with observations.
BP95, using [Fe II]/[O I] line ratios, inferred that the Fe/O abundance in the proposed high-density region is close to solar. Based on our new upper limit on the [O I] 5577 strength, which is 3.2 times lower than one used by BP95, the Fe/O abundance would be higher than 3 times solar, if we adopt their high density. If iron were depleted, these numbers would be even larger.
Both photoionization and collisional models predict that the [Fe II] and [O I] emission line regions should be nearly coincident. Our upper limit on the density derived from the [O I] line ratio is consistent with the origin of [Fe II] lines in a region of moderate density, cm-3.
4 Summary
1. Previous measurements of [O I] 5577 were affected by telluric emission. Our limit to the line sets limits on the density and temperature consistent with the physical conditions inferred from the other emission lines.
2. The high-density collisional model for the formation of the [Fe II] lines is inconsistent with the strongest observed [Fe II] line at 12567 Å. In combination with the new upper limit on the [O I] 5577 line, the inferred Fe/O ratio in any putative high-density region would be at least 3 times solar, not solar as found by BP95.
3. Our photoionization models of the [Fe II] spectrum with parameters close to those found by BFM predict a spectrum in good overall agreement with observations. The infrared [Fe II] lines are produced by collisional excitation, and the optical [Fe II] lines by photon pumping by the ultraviolet continuum in a region of moderate density, cm-3. Fe/H must be depleted, , in agreement with independent determinations from KAO observations.
4. While dense condensations undoubtably exist within the Orion Nebula, these regions do not contribute significantly to the [Fe II] and [O I] spectra.
The photoionization models have several parameters which can affect the resulting [Fe II] spectrum, including the flux of the pumping continuum, turbulent velocity, and bulk motions in the gas. The shape of the ionizing continuum, the pressure law, and gas phase abundances are major parameters which affect the emission of the stronger CNO lines. Detailed fitting of the Orion Nebula spectra will be the subject of a future paper.
| Ion | Wavelength | CTIOaaNew CTIO echelle data at BFM position 1. Not dereddened. | bbHST observations. Not dereddened. |
|---|---|---|---|
| [Cl III] | 5518 | – | 0.106 |
| [Cl III] | 5538 | 0.13 | 0.119 |
| [O I] | 5577 | ||
| [O I] | 5577 sky | 0.044 | – |
| [NII] | 5755 | 0.17 | 0.322 |
| He I | 5876 | 3.22 | 3.44 |
| [O I] | 6300 | 0.19 | 0.313 |
| [O I] | 6300 sky | 0.0071 | – |
| [S III] | 6312 | 0.49 | 0.565 |
| Si II | 6347 | 0.042 | – |
| [O I] | 6364 | 0.063 | 0.113 |
| Si II | 6372 | 0.022 | – |
| [N II] | 6548 | 3.30 | 7.35 |
| H | 6563 | 76-113ccPoorly calibrated because of broad H absorption in standard star. | 85.2 |
| [N II] | 6583 | 11.4 | 21.0 |
| He I | 6678 | 1.00 | 1.00 |
| [S II] | 6716 | 0.52 | 0.865 |
| [S II] | 6731 | 0.98 | 1.75 |
| Photoionization modelscc cm-3. (A) Calculations for the parameters given by BFM, pumping by Ori C. (B) Pumping by all four Trapezium stars, gas pressure constant. (C) Pumping by all four Trapezium stars, total pressure constant. | ||||||
|---|---|---|---|---|---|---|
| Line | RefbbData references: 1 – new CTIO, 2 – table 7 of BFM, 3 – OTV. | Observations | A | B | C | |
| HeI | 5876 | 1 | 13.7 | 13.3 | 13.3 | 12.9 |
| [NII] | 5755 | 1 | 0.763 | 1.06 | 1.06 | 1.97 |
| [NII] | 6583 | 1 | 41.6 | 53.1 | 52.8 | 74.1 |
| [OI] | 5577 | 1 | 0.0044 | 0.0043 | 0.0095 | |
| [OI] | 6300 | 1 | 0.722 | 0.341 | 0.336 | 0.699 |
| [OII] | 3727 | 2 | 94 | 188 | 188 | 149 |
| [OIII] | 5007 | 2 | 343 | 465 | 460 | 379 |
| [SII] | 6716 | 1 | 1.85 | 1.63 | 1.62 | 1.67 |
| [SII] | 6731 | 1 | 3.47 | 3.19 | 3.17 | 3.57 |
| [SIII] | 9532 | 2 | 144.5 | 151 | 151 | 150 |
| [FeII] | 8617ddIntensities of other [FeII] lines scaled to are given in Table 3. | 3 | 0.0665 | 0.0572 | 0.0584 | 0.0979 |
| Collisional models | Photoionization modelsee(A), (B) and (C) models are the same as in Table 2. | ||||||||
|---|---|---|---|---|---|---|---|---|---|
| Line | ObservationsbbLowe et al. 1979 for 12567, OTV for all other lines. | BPPccCollisional model from BPP; K, cm-3. | IddCollisional model from the present work; K; I – cm-3, II – cm-3. | IIddCollisional model from the present work; K; I – cm-3, II – cm-3. | A | B | C | ||
| 4244+4245 | 0.87 | 0.96ffUnresolved blends at 4244 and 5159 are not included in the BPP model. | 1.3 | 0.23 | 2.1 | 2.4 | 1.3 | ||
| 4277 | 0.64 | 0.60 | 0.69 | 0.10 | 0.46 | 0.50 | 0.37 | ||
| 4815 | 0.94 | 0.44 | 0.96 | 0.21 | 1.1 | 1.2 | 0.71 | ||
| 5158+5159 | 1.3 | 1.0ffUnresolved blends at 4244 and 5159 are not included in the BPP model. | 2.7 | 0.62 | 1.7 | 1.9 | 1.1 | ||
| 5262 | 0.81 | 0.71 | 1.4 | 0.24 | 0.28 | 0.31 | 0.26 | ||
| 5334 | 0.33 | 0.53 | 0.95 | 0.11 | 0.22 | 0.24 | 0.21 | ||
| 8617 | 1.00 | 1.00 | 1.00 | 1.00 | 1.00 | 1.00 | 1.00 | ||
| 8892 | 0.19 | 0.40 | 0.40 | 0.34 | 0.31 | 0.31 | 0.36 | ||
| 12567 | 3.3 | 0.39 | 3.6 | 3.5 | 3.4 | 2.6 | |||
References
- Baldwin et al. (1991) Baldwin, J. A., Ferland, G. J., Martin, P. G., Corbin, M. R., Cota, S. A., Peterson, B. M., & Slettebak, A. 1991, ApJ, 374, 580 (BFM)
- Balick, Gammon, & Hjellming (1974) Balick, B., Gammon, R. H., & Hjellming, R. M. 1974, PASP, 86, 616
- Bautista et al. (1996) Bautista, M. A., Peng, J., & Pradhan, A. K. 1996, ApJ, 460, 372 (BPP)
- Bautista & Pradhan (1995) Bautista, M. A., & Pradhan, A. K. 1995, ApJ, 442, L65 (BP95)
- Bautista & Pradhan (1996) Bautista, M. A., & Pradhan, A. K. 1996, A&AS, 115, 551 (BP96)
- Bautista et al. (1994) Bautista, M. A., Pradhan, A. K., & Osterbrock, D. E. 1994, ApJ, 432, L135 (BPO)
- Erickson et al. (1989) Erickson, E. F., Rubin, R. H., Haas, M. R., Simpson, J. P., & Colgan, S. W. J. 1989, BAAS, 21, 1156
- Ferland (1992) Ferland, G. J. 1992, ApJ, 389, L63
- Ferland et al. (1996) Ferland, G. J., et al. 1996, PASP, to be submitted
- Johansson (1994) Johansson, S. 1994, private communication
- Lowe et al. (1979) Lowe, R. P., Moorehead, J. M., & Wehlau, W. H. 1979, ApJ, 228, 191
- Lucy (1995) Lucy, L. 1995, A&A, 294, 555
- Nahar (1995) Nahar, S. N. 1995, A&A, 293, 967
- Osterbrock (1989) Osterbrock, D. E. 1989, Astrophysics of Gaseous Nebulae and Active Galactic Nuclei (University Science Books: Mill Valley, California)
- Osterbrock et al. (1992) Osterbrock, D. E., Tran, H. D., & Veilleux, S. 1992, ApJ, 389, 305 (OTV)
- Peimbert & Torres-Peimbert (1977) Peimbert, M., & Torres-Peimbert, S. 1977, MNRAS, 179, 217
- Quinet et al. (1996) Quinet, P., Le Dourneuf, M. & Zeippen, C. J. 1996, A&AS, in press
- Rubin, Dufour, & Walter (1993) Rubin, R. H., Dufour, R. J., & Walter, D. K. 1993, ApJ, 413, 242
- Rubin et al. (1992) Rubin, R. H., Erickson, E. F., Haas, M. R., Colgan, S. W. J., Simpson, J. P., & Dufour, R. J. 1992, in The Astrochemistry of Cosmic Phenomena – IAU Symposium No. 150, ed. P. D. Singh (Kluwer), p. 281
- Rubin et al. (1991) Rubin, R. H., Simpson, J. P., Haas, M. R., & Erickson, E. F. 1991, ApJ, 374, 564
- Tielens & Hollenbach (1985) Tielens, A. G. G. M., & Hollenbach, D. 1985, ApJ, 291, 722
- Verner et al. (1995) Verner, E. M.,. Ferland, G. J., Korista, K. T., & Verner, D. A. 1995, BAAS 27, 840
- Verner et al. (1996) Verner, E. M., et al. 1996, in preparation
- Wills et al. (1985) Wills, B. J., Netzer, H., & Wills, D. 1985, ApJ, 288, 94
- Zhang & Pradhan (1995) Zhang, H. L., & Pradhan, A. K. 1995, A&A, 293, 953 (ZP)
- Zuckerman (1973) Zuckerman, B. 1973, ApJ, 183, 863