A 20 cm VLA SURVEY OF ABELL CLUSTERS OF GALAXIES
VI. RADIO/OPTICAL LUMINOSITY FUNCTIONS
Abstract
From a statistically complete sample of 188 radio galaxies in Abell clusters, we examine the radio/optical correlations, the FR I/II division, and the univariate and bivariate luminosity functions. As suggested by Owen (1993), the FR I/II division is shown to be a strong function of the optical luminosity of the host galaxy (). This dependence is also seen in the bivariate luminosity function, which suggests that the evolutionary tracks of radio sources and/or the initial conditions in the source are governed by the host galaxy properties. The probabilty for detecting radio emission increases with optical luminosity. The optical dependence is clearly separated in the integral luminosity functions which can be used as a constraint to models of FR I radio power evolution. Additionally, the source counts from the integrated univariate radio luminosity function (RLF) are consistent with our suggestion in paper V that radio sources may be a transient phenomenon which occurs in all elliptical galaxies at some time (or several times) over their lifetime. We find no statistically significant differences in the luminosity functions between rich cluster samples and radio sources not selected to reside in clusters. These results suggest that all radio galaxies live in similar environments in that the optical luminosity and the properties of the host galaxy are the most important parameters which affect radio source formation and evolution.
1 Introduction
This is the sixth paper devoted to the analysis of a VLA 20cm survey of over 500 Abell clusters of galaxies. In paper I-III (Zhao et al. 1989, Owen et al. 1992, Owen et al. 1993), the VLA C-Array survey was presented, including optical ID’s, radio maps, and source parameters. In paper IV (Ledlow and Owen, 1995a), the final statistical sample was assembled along with an analysis of the cluster properties and their effect on the radio source detection rates. In paper V (Ledlow and Owen, 1995b), R-Band CCD surface photometry for 265 radio galaxies was presented, and compared to the optical properties of a control sample of radio-quiet galaxies chosen from the same clusters. In this paper, we examine the relationship between radio and optical luminosity and compute the univarite radio and bivariate radio/optical luminosity functions for our statistical sample of 188 radio galaxies with . These functions are compared to other samples of objects not selected from rich-clusters to examine the effects of the environment on radio source populations.
Owen and Laing (1989) examined the optical properties of 47 or other non-rich cluster radio galaxies. Owen and White (1991) followed up this study with optical observations of 49 rich cluster radio galaxies. While no significant differences were found between the cluster/non-cluster objects, using the larger, combined data set, Owen and White suggested that the FR I/II sources were not only separated by a radio power division, but that this break appeared to depend on the optical luminosity of the host galaxy. Owen (1993) followed up this idea by combining optical magnitudes from several samples from the literature, including objects from a variety of environments and over a large-range in redshift (). Owen found that the separation between the FR I/II classes was very sharp and was strongly dependent on the optical luminosity (). He suggested that the sharpness of this break may indicate some relationship between the FR classes, possibly an evolutionary relation. Owen and Ledlow (1994) presented preliminary determinations of the bivariate luminosity functions from the statistically complete VLA sample (Ledlow and Owen, 1994a). They showed that the break in the luminosity functions corresponded exactly to the FR I/II division and had the same optical dependence. It is therefore apparent that the properties of the host galaxy must obviously influence the radio morphology.
In Paper V, using optical surface photometry of 265 cluster radio galaxies and 50 radio-quiet ellipticals from the same clusters, we determined that there is no significant difference in the optical properties between radio-loud (FR I) and quiet elliptical galaxies. This result is also consistent with Owen, Ledlow, and Keel (1995) from analysis of the optical spectra and comparison to the radio-quiet sample of Phillips et al. (1986). The optical luminosity is the fundamental parameter which describes elliptical galaxies as a class. All other optical measures (slope of the surface-brightness profile, ellipticity, size, etc.) can be factored by the total optical luminosity. These results suggest that there is not a unique population of ellipticals which form radio sources. However, from the optical dependence of the FR I/II break, the host galaxy properties must influence the morphology and observed properties of the radio source.
Several papers have addressed the univariate radio luminosity function for non-cluster objects (Cameron, 1971; Colla et al. 1975; Parma et al. 1986; de Ruiter et al. 1986; Fanti et al. 1986,1987). Most of these studies have used radio surveys such as the Bologna B2 survey or the Cambridge 3CR sample of powerful radio galaxies. These samples have been compared to observations of rich cluster radio galaxies by Jaffe and Perola (1976), Auriemma et al. (1977), Lari and Perola (1978), Fanti et al. (1982), and Fanti (1984). These studies found no difference in the univariate radio luminosity functions for those samples selected in and out of rich clusters (although the sample size of rich clusters was small). The conclusions are that the large-scale environment does not change the probability of detecting radio sources and does not affect radio source lifetimes. This has been a puzzling discovery given that the density of galaxies in and out of rich clusters can differ by an order of magnitude. Additionally, gas densities inferred from X-ray observations of clusters (Sarazin, 1986), infer possible differences of between poor clusters or the field and rich clusters. Thus, the aspects of the environment which which are important to the formation and evolution of radio sources is not well understood.
Very few studies have had sufficient data to calculate the bivariate radio/optical luminosity functions. Existing data has been limited to Zwicky magnitudes, which suffer fairly large systematic errors magnitudes (Colla et al. 1975). Auriemma et al. (1977) were the first to suggest that the probabilty for radio emission increased with optical luminosity. However, with such large errors in the optical magnitudes, the exact dependence on the optical luminosity was difficult to determine. Sadler et al. (1989) also calculated bivariate luminosity functions for a VLA survey of non-cluster radio galaxies. In this paper, we will compare our results to these two studies to examine how the optical luminosity and the environment affect radio source detection and properties. Preliminary results from the bivariate luminosity functions for our cluster sample were reported in Owen and Ledlow (1994).
In section 2, we discuss the relationship between radio and optical luminosity. In section 3, we outline the procedure for calculating and normalizing the luminosity functions. In section 4, we present the differential and integral univariate and bivariate luminosity functions for our cluster sample. We compare the luminosity functions from our cluster sample to other non-cluster samples and discuss the importance of the environment in section 5. We summarize our conclusions in section 6.
Throughout this paper we assume and .
2 Radio/Optical Properties
Radio galaxies can be coarsely grouped into two classifications : FR I and FR II’s. These classifications were defined by Fanaroff and Riley (1974). See Bridle (1984), Heckman et al. (1994), and Baum et al. (1995) for a more detailed description of FR I and FR II radio galaxies. Simply stated, the FR I’s are dominated by emission from the compact core and jets. The outer regions of the source consist of diffuse lobes which fade with distance. The FR II’s have the highest radio brightness far from the host galaxy. These hotspots are thought to be coincident with the location of the working surface of the beam, and the radio lobes are the swept-back material or backflow from the shocked region in the wake of the advance of the head of the jet. The one observed difference between these two classifications is the total radio power. Fanaroff and Riley noticed that the FR II’s occurred almost exclusively at radio powers . The FR I’s almost always have radio powers below this value. FR I’s are usually interpreted as subsonic or transonic entraining flows (on kpc scales). The FR II’s are thought to have supersonic jets. However, VLBI observations suggest that both FR I’s and FR II’s have similar relativistic flows on parsec scales (e.g. Pearson, 1996)
In this paper, we will divide our sample of radio galaxies into only these two divisions. Owen and Laing (1989) and Owen and White (1991) further divide the FR I class into Twin-Jets (TJ), Wide-Angle Tails (WAT), Narrow-Angle Tails (NAT), and Fat-Doubles (FD). There are, of course, many sources which are difficult to classify uniquely. For purposes of this paper, we identify sources as FR II only if they meet the strict definition of Fanaroff and Riley (1974). All other sources are put in the FR I class.
In paper V (Ledlow and Owen, 1995b), we found that cluster radio galaxies are not obviously different from normal cluster ellipticals. However, once a galaxy forms a radio source, how do the properties of the host galaxy affect the observed radio properties? The optical properties are each a measure of different physical parameters within the host galaxy. The optical luminosity is a measure of the mass of the system and thus may be related to the efficiency or fueling of the active nucleus. In addition, higher mass objects will have a deeper local gravitational potential. The interstellar gas density and pressure as well as the extent of the ISM, and possibly the mass and size of the gaseous halo surrounding the galaxy are also a function of the optical luminosity. We therefore might expect that the local dynamics which govern the conditions in the environment in which the radio jets propogate would influence the morphology or possibly the radio power output of the source.
The statistics from our VLA cluster survey are that 94% of the radio galaxies have FR I morphology. In the lower redshift group () there are only 3 FR II’s in the sample. FR II’s are found in rich clusters at higher redshifts however. They are also found in bright galaxies not located in rich clusters. Prestage and Peacock (1988) calculated the angular cross-correlation function for the two types, and found that FR I’s are found in much higher density groups. FR II’s seem to prefer approximately a factor of four lower galaxy density. One interpretation is that galaxies and the gaseous environment in rich clusters was different in the past. Alternatively, independent of the clustering environment, the scarcity of FR II’s may be a volume-effect. The most powerful radio galaxies are, by definition, the rarest objects because of the steep slope of the radio luminosity function. When the search volume is increased (by extending the surveys to higher redshifts), more of the powerful sources are found. It is unclear which effect (evolution in the cluster environment, galaxy density, or the search volume) is the dominant factor in FR II number counts.
The argument based on evolution with epoch is difficult to address from our low-redshift sample. Our sample was purposely chosen to examine a population of radio galaxies unaffected by cosmological evolution, but rather to observe a large number of radio galaxies in different stages of their individual evolution. More observations of high redshift cluster radio galaxies is necessary to sort out these effects.
We will first examine the radio/optical luminosity properties of the sample. This importance of this diagram was first discussed by Owen (1993). We have reproduced the radio/optical luminosity diagram from Owen (1993) which combines the samples from Owen and Laing (1989), Owen and White (1991), and several others from the literature. This diagram is shown in figure 1. The 1’s and 2’s refer to the FR classifications. The other data sets included in the diagram are from Lilly and Prestage (1987), Smith and Heckman (1989), Baum et al. (1988), Hill and Lilly (1991), and a portion of the data from our current radio galaxy sample (Owen et al. 1992). These data are not based on a complete sample, but rather were chosen to populate all regions in the diagram. These data includes objects both in and out of rich clusters as well as spanning a range in redshifts from to . All objects fit the observed relation nicely despite their very different selection. We see very clearly that the two FR classes populate this plane in different ways. The FR division also appears to have a non-zero slope in the diagram. An approximate interpolation between the two classes gives a slope of which corresponds to . The FR I/II division is quite sharp but appears to occur over a range in radio power from over the plotted range in optical luminosity. This is very interesting in that many FR I’s are seen at radio powers equivalent to FR II sources, but in galaxies one to two magnitudes brighter. This fact coupled with the sharpness of the division makes it seem unlikely that the two classes are totally unrelated without some connection (possibly evolutionary?). One would not expect two uncorrelated samples to exhibit a sharp division in their optical/radio properties. The optical dependence of this division is puzzling. It is not clear how the jet-producing AGN at the center of the galaxy can know about the total luminosity or mass. If the initial conditions in the jets are similar in FR I’s and FR II’s, however, the optical dependence may be related to environmental factors of the host galaxy ISM (Bicknell 1995). This would suggest a fundamental difference in the host galaxy properties at the same optical luminosity (see Baum, Zirbel, & O’Dea 1995 for related discussions on this topic).
In figure 2 is plotted an identical diagram for our entire cluster sample. This plot includes the higher redshift sample () (see Ledlow and Owen, 1995a). Also plotted is the approximate fit to the FR division from figure 1. We see that the FR division is much less clear in this plot. There is a fair amount of overlap across this line. All the FR II’s which are below the division may be somewhat unusual. Whereas most FR II’s are large, and extend well into the intracluster/intragroup medium, nearly all of these sources appear to be confined within the optical extent of the host-galaxy. These objects may be a class of FR II’s which have been missed in flux-limited surveys of high-power radio galaxies (such as the 3CR sample). Their lower powers and small size may indicate that they are young objects. If FR II’s are powered by supersonic flows, the amount of time spent in this state would be small. Therefore these objects may have been observed in a rather rare stage of their evolution. Alternatively, because all of these unusual FR II’s are located in bright galaxies at the centers of rich clusters, the higher density ISM/ICM may be more efficient at confining the radio source and limiting the size and total radio power.
The lack of any high-power FR II’s in the upper right portion of the diagram may be a selection effect. Because the radio luminosity function falls rapidly for powers above (see figure 6 and § 4), the number of objects in this radio power range is very small. Also, the optical luminosity function is very steep in this range (see figure 4). Thus at low redshift one would expect few objects in these optical/radio luminosity ranges because of the small search volume. At much higher redshifts (), the larger volume ( distance3) increases the probability of detecting these objects. It has often been cited in the literature that FR II sources are not found in rich cluster environments. While clearly they are a minority, they are not totally absent from the centers of rich clusters. The large majority of the objects are however FR I’s.
In figure 3, we plot the same diagram restricted to our statistically complete sample for . We see the same trend seen in the previous diagrams, but notice that the FR II’s are almost completely absent from this sample. If we examine the distribution in radio/optical luminosities from this figure, we see that for any given optical luminosity there is a large range in observed radio power. Depending on where the radio flux-limit is chosen, different results might be observed. For example, if one were to look only at the sources with powers , the distribution of the FR I’s in this plane would appear to correlate with optical power . As we see from the fit to the FR I/II division, this appears to simply be an artifact from selecting galaxies near the FR I/II break. When we include the lower radio power sources, the previously strong correlation disappears. So while it is suspected that the probability for a galaxy to be a radio source is an increasing function of optical luminosity, there is no strong correlation between individual radio and optical luminosities. However, because we are observing sources in all stages of their evolution, one might not expect to see a strong correlation. However, the fractional representation of sources of different ages is very model dependent (see below).
The sample plotted in figure 3 is complete for all Abell clusters within the volume to a limiting flux density of at within 0.3 Abell radii. Because of the size of the primary beam of the VLA ( at 20cm), we are only complete to a search radius of for sources brighter than . . This sets a lower-limit of for which we have uniformly surveyed all clusters out to 0.3 Abell radii ( for ). Within this restricted volume, the distribution of sources in both radio and optical luminosity reflects a probability function for radio emission in rich clusters. Over this redshift range, the shape of the distributions will be governed by individual source evolution and not by cosmological evolution in the radio source population (e.g. Meier et al. 1979). If we assume that the optical luminosity of the host galaxy does not change appreciably over the lifetime of the radio source, and that the radio power evolves in time as the sources grow larger in size, the density of points along the radio axis at a constant optical luminosity represents the amount of time radio sources spend in that state. We can therefore use these relationships to construct bivariate radio luminosity functions for this sample (see § 4.2)
3 Luminosity Functions and Normalization
The univariate radio and bivariate radio/optical luminosity functions will be derived from the complete sample of radio galaxies cataloged in Table 2 from Paper IV. The univariate radio luminosity function will be compared to that found by other investigators for non-cluster and field galaxies. If the dense environment of clusters influences radio source evolution or formation, these effects should be seen as differences in the shape of the radio luminosity function. The bivariate functions will be used to examine the importance of the optical luminosity of the host galaxy in determining the radio properties.
While several normalization schemes are commonly used, we have chosen to calculate the fractional or differential radio luminosity function (i.e. the fraction of galaxies emitting in some radio power range normalized to the total number of galaxies surveyed in each bin). For the bivariate case, this also involves the determination of the number of galaxies which could have been detected as a function of optical luminosity. As a first step, the bivariate luminosity functions were normalized to the number of clusters surveyed (taking into account completeness in radio power; see below). These functions were first reported in Owen and Ledlow (1994). To determine the number of galaxies which could have been detected, one must either count the number of elliptical galaxies in each cluster within the Abell radius limit which were surveyed or could have been detected on the radio maps and bin them according to their absolute magnitude (which is impractical), or assume some distribution in number and optical luminosity for the elliptical galaxies which can be scaled to the properties (richness) of each of the surveyed clusters. The differential bivariate luminosity function can then be calculated by computing the ratio :
| (1) |
where is the luminosity function as a function of radio power and optical absolute magnitude, is the number of galaxies detected in the radio power bin i and magnitude bin j. and is is the total number of galaxies which could have been detected in bins i and j (Auriemma et al. 1977). For the univariate case, one simply sums over all magnitudes in a given radio power bin. In the bivariate case, this ratio can be interpreted as the probability for a galaxy of magnitude to be radio emitting within a radio power . The univariate function gives the fraction of all galaxies which are radio emitting over the range in the radio power bin. The integrated luminosity functions are found by forming a cumulative sum in equation (1) of the ratio of all galaxies with radio power in each bin. The integrated luminosity functions can also be calculated seperately for each optical magnitude bin.
Because the sample is derived from a flux-limited survey, there will also be a completeness correction which is a function of radio power. Using our flux limit of and a redshift cutoff of , the survey is complete for . Below this power, radio galaxies could not have been detected out to the maximum redshift of . In the radio power bins below this value, the number of clusters which could have been detected at a minimum flux density of is found by solving for the redshift limit () at the midpoint of the bin. The number of clusters surveyed with redshifts is used to determine the number of galaxies surveyed, as described in the next few paragraphs.
The optical normalization function (or elliptical galaxy optical luminosity function for clusters) was determined using data from Dressler (1980). Using photographic plates, Dressler catologued the positions and morphological types for galaxies in 55 rich clusters. Thirty-eight of these were Abell clusters. For twenty-eight of the Abell clusters, he also included estimated V apparent magnitudes, bulge sizes, and ellipticities. We have used his data for 25 of these clusters to calculate the elliptical galaxy optical luminosity function for rich clusters (). The other 3 clusters (Abell 0548, 1631, and 1736) are confused by superpositions of two clusters, so were not included in the analysis. Using Dressler’s galaxy classifications, we have determined within a search radius of 0.3 corrected Abell radii. When Dressler has indicated an ambiguous Hubble type (i.e. S0/E, or Sa/0), we used the first classification given. The apparent V-magnitudes were transformed to R-Band colors using (Bessel, 1979), and converted to absolute magnitudes using our adopted cosmology. A K-correction was also applied to the absolute magnitudes with the approximation : .
For each cluster, the following procedure was taken : 1) determine the projected distance from the cluster center for each galaxy as a fraction of a corrected Abell radius, 2) reject all galaxies outside the nominal 0.3 Abell radii, 3) convert apparent V-magnitudes to absolute R-band magnitudes, 4) restrict galaxies to Hubble classifications of E, D, or cD, and 5) bin the galaxies in units of 0.75 magnitudes over the range to and output the results. Once these data were compiled for all 25 clusters, the number of galaxies in each magnitude bin were summed over all clusters and tabulated.
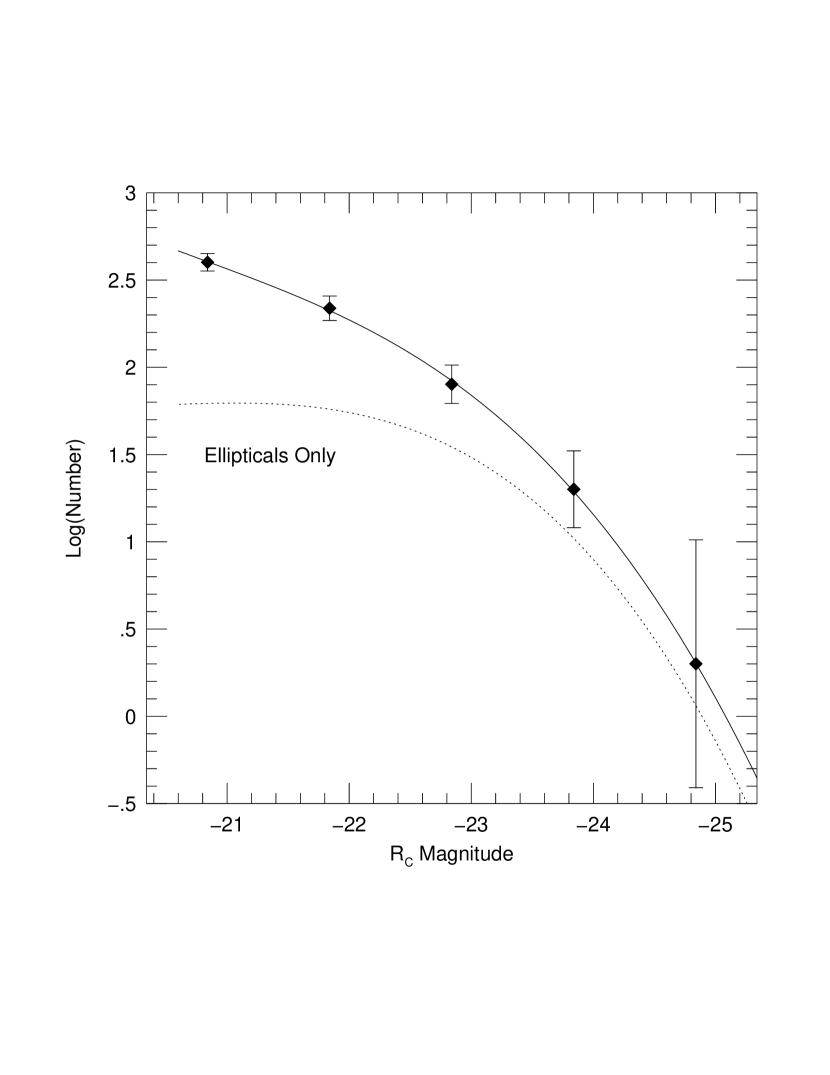
The procedure was to sum over the richness values for all clusters, and scale the total number of galaxies in each magnitude bin to this value. Our derived elliptical galaxy optical luminosity function is shown in figure 4. This function can be compared to the type-specific optical luminosity functions given in Binggeli et al. (1988) for the Virgo cluster. The magnitude scales can be compared by using a (includes a correction for the cosmology). We verify that the two functions have a similar shape. By interpolating values from the plot in figure 4 for the midpoint values of each magnitude bin, a smooth-continuous normalization function can be found. The result is the number of elliptical galaxies within the magnitude interval within Abell radii of the cluster centers, scaled by Abell’s galaxy counts. For the bivariate calculations, these percentages are then multiplied by the from the total number of clusters which could have been detected in each radio power bin (taking into account the radio-completeness correction). For the univariate case one simply sums the number of galaxies over all magnitudes in each radio power interval.
In most previous studies of radio galaxies, ellipticals and S0’s have been examined together. We have found very few () S0’s which were radio emitting above our flux limit, and have eliminated these to examine only the elliptical galaxy luminosity functions. Because of the very small percentage of radio emitting S0’s in our sample, normalizing to an E + S0 luminosity function will change the overall shape and the fraction of radio-loud galaxies in any given luminosity range. In order to compare our work to previous studies, however, it is necessary to normalize our sample to the combined E+S0 optical luminosity function. An identical procedure to that described above was performed using the data from Dressler, but including the S0’s. This function is shown in figure 5. We see, as expected, the function is similar for the brightest galaxies (most of which are ellipticals), but has a steeper faint-end slope when the S0’s are included.
4 Luminosity Functions for the Complete Cluster Sample
4.1 Univariate Radio Luminosity Function
The fractional univariate radio luminosity function (RLF) has been derived as discussed in the previous section for the complete sample with . The binned data in units of is listed in Table 1. The ratios are the fraction of galaxies over all magnitudes brighter than -20.5 which are radio emitting in the radio power range of each bin. This function is shown in figure 6. The error bars are calculated as sampling errors (percentage uncertainties).
We see that the function is relatively flat for radio powers up to the break power (), and falls off radidly with increasing . The slopes on each side of the break are : for and for . The fit above the break is obviously more uncertain with only three data points, the last one being an upper limit. As compared to Sadler et al. (1989), whose survey extends to (converted from to using ), our faint-end slope is consistent with a gradual rise in the fraction of detected galaxies with decreasing radio power. This is expected at lower radio powers as more and more galaxies are detected at small levels of radio activity and the contribution from spirals and S0’s begins to increase. de Ruiter et al. (1990), for a sample of B2 radio galaxies, found a faint-end slope of and above the break, . His normalization is different, however, as he was forced, by the definition of the sample, to normalize to galaxies per unit volume.
From examination of figure 3, we can determine the origin of the break power in the univariate luminosity function. The univariate function is found by summing over all optical luminosities. Thus, if one collapses the data in figure 3 along the x-axis, and were to examine the distribution of sources in bins of radio power, the sources above the break originate entirely from the group of higher-power sources at bright optical luminosities. Since the FR I/II division has a slope in this plane , the width of the break in the luminosity function is a result of projecting this sharp division onto a single axis, leaving radio power as the only variable. We should also notice that becuase of the very low number of FR II’s in the sample (3), all the objects above this break power are FR I’s from the highest radio power and optical luminosity bin. All the FR II’s show up in the bin. Therefore, the break in the univariate RLF corresponds only approximately to the FR I/II division.
As mentioned in § 2, our sample was selected to examine a sample of radio galaxies unaffected by cosmological evolution, but rather to examine a large number of radio sources in different stages of their individual evolution. A previous study by Meier et al. (1979) of the radio luminosity function of B2 and 3C objects, found no evidence of any difference in the luminosity functions for objects with redshifts . Thus the shape of the luminosity function is most dependent on initial conditions in the radio source and individual radio source evolution rather than any effects due to epoch. The break power, which is coincidently in the range where the transition from FR I to FR II morphology occurs, is most likely a result of the different lifetimes for sources as a function of radio power.
This last point is very important to our understanding of radio galaxy evolution. While the luminosity functions describe the existing population of radio sources at any given epoch and radio power, it is most useful as a constraint to models of radio source evolution. Meier et al. (1979) presented several models to explain the shape and position of the break in the RLF. As we will examine in the next few sections, the suggestion is that the RLF is not dependent on environment, and at least to redshifts , is not largely dependent on epoch. Therefore, the shape of the RLF must represent some intrinsic property of radio galaxies. If radio sources have very long lifetimes ( a Hubble time), the shape of the RLF must reflect the initial RLF at the time the sources were created. If radio sources have short lifetimes (in a continuous cycle of dying and new sources created) the RLF is dependent on the initial RLF and the lifetimes of the sources as a function of radio power. In this scenario, the amplitude of the function and the location of the break can evolve in time. It is therefore very interesting to determine if the break in the RLF corresponds to the FR I/II division from figure 3.
In paper V, we suggested that radio sources might be a transient phenomenon which occurs in all ellipticals at some time (or many times) over the course of their lifetime. We can use the univariate luminosity function listed in Table 1 as a constraint to test this idea. If we integrate the univariate RLF, we find that 14% of ellipticals with brighter than -20.5 are detected with within our search volume. Using an age of for a typical elliptical galaxy, if radio source lifetimes are , our RLF is consistent with the idea that all ellipticals may at some time have powerful radio sources. Typical lifetimes from spectral aging arguments, light-travel time calculations and models (Eilek and Shore, 1989) suggest that may be typical for radio sources. Thus, the suggestion that the parent population of radio sources includes all ellipticals may be consistent with the observed statistics.
4.2 Bivariate Radio/Optical Luminosity Function
In this section, we divide the detected sources into bins of both optical luminosity and radio power to investigate the dependence of the shape of the luminosity function on the optical luminosity of the host galaxy. A comparison will be made to samples of objects not chosen to reside in clusters to examine the effect of the global environment on the formation and evolution of radio galaxies.
In Table 2, we show the results of binning the data into magnitude intervals in and bins in . The normalization function is that derived in § 3 (figure 4) for only elliptical galaxies. The bivariate luminosity functions are shown in figures 7A-D. We note that 1) all of the functions are relatively flat for powers less than (except in the faintest magnitude bin), 2) the fraction of galaxies which were detected in bins of increases over the first two magnitude bins (,), but is about the same in the upper two bins (,). This point will be discussed in the next paragraph. A K-S test between successive magnitude bins (for ) suggests that the shape of the individual functions is not strongly dependent on optical luminosity. This supports the contention that the radio and optical luminosities of individual galaxies are not strongly correlated. However, the location of the break power does appear to shift by per magnitude interval. In the last bin (), the function is consistent with having not reached the break power up to . According to the fit from figure 1 for the FR I/II division, at this luminosity, the break might occur at a radio power of . We thus suggest that the break power in the bivariate RLF corresponds to the FR I/II division shown in figure 3, and is a function of optical luminosity. For the univariate function, averaging over all magnitudes, the break results from projecting the FR I/II division onto only one variable and only for the fainter galaxies does it correspond to the actual FR I/II division in radio power.
The integrated bivariate luminosity functions are plotted in figure 8. From these plots, we can directly measure the probability for a galaxy with absolute magnitude in the range to have a radio source with radio power . Objects with are three times more likely to have radio sources than objects 0.75 magnitudes fainter at nearly all radio powers. Galaxies brighter than are about 2.5 times more likely to be radio emitting. However, the brightest two bins are consistent with having equal probabilities. While the normalization is the most uncertain in this range of optical luminosity because the optical luminosity function is changing rapidly, the most likely effect from our normalization is that we slightly underestimated the number of galaxies in the last bin. The median magnitude of the objects in this bin is , which would change the normalization only slightly in the direction of a lower detection ratio (see figure 4), not increase it. The median magnitude in the bin is . The normalization is consistent with the actual mean values of the data within a few percent of the bin width.
Therefore, galaxies brighter than may be equally likely to have radio sources with radio powers . However, Burns (1990) found that cD galaxies typically have steeper radio spectral indices than typical of most radio sources. This result is particularly strong for cD’s with compact or amorphous radio emission possibly associated with a cooling flow. Therefore, individual objects in the brightest optical magnitude bin may have a large range in spectral index which may bias the average radio power level to lower values. However, on the log-log plot, it would require a large increase in 20cm flux-density for a majority of the sources to substantially separate the two curves. It seems likely that spectral-index variations may contribute to the observation, but it is far from clear that this alone accounts for the similarity in the amplitudes for the two magnitude bins. Thus the observed narrowing separation between the functions for increasing optical luminosity may be a real effect.
Also from figure 8, we see that the break power in the integral functions shifts with optical luminosity as well. This supports the idea that the radio power depends only weakly on optical luminosity, and that this dependence is directly related to the maximum power an FR I can take at any given optical luminosity. These effects would be difficult to see with larger magnitude bins. With larger bins, the numbers of sources in the brightest bins would cluster towards the faint end because of the shape of the optical luminosity function. This effect would skew the probabilities towards those of fainter magnitudes and smear out the distributions in figure 6.
Given the optical dependence of the FR I/II break and the optical dependence of the luminosity functions discussed above, it seems likely that the host galaxy properties directly affect both the initial conditions in the radio source as well as the subsequent evolution and lifetime of the sources. Following the analysis of Cavaliere et al. 1971, Eilek (1993) performed analytic calculations for the radio power and size evolution of FR I’s propogating through a constant density medium. The luminosity function can be represented as :
| (2) |
where N is the source counts as a function of total monochromatic radio power over a time-interval , is the change in monochromatic power with time (incorporating spectral aging), and is the source function for the number of sources created at power over a time . Solutions for show that the radio power increases up to a time (the synchrotron lifetime as a function of the energy of the radiating electrons and the magnetic field strength), and thereafter decreases as the source lobes come into pressure balance with the ambient medium and the electrons simply radiate on a timescale . This analysis nicely reproduces the slope in the univariate RLF below , but predicts a very slow decay in the source power. This would predict many more old steep-spectrum sources than is observed. Thus, the sources must fade on much shorter time scales (Eilek, 1993). In situ particle acceleration via either turbulance in the lobes or Fermi accleration does not significantly affect the time-decay of the radio power averaged over the entire source (Eilek and Shore, 1989) as these processes operate on small size scales.
This analysis implicitly assumes that the ambient atmosphere of all sources is the same, effectively ignoring possible dependencies on the host galaxy properties. From figures 7 and 8, it is clear that must also be a function of . However, Eilek (1993) found that the choice of ambient density or pressure had much less effect on the evolution as compared to the initial spread of intrinsic beam powers (). The source counts for the brightest galaxies may be consistent with a spread of initial beam powers which is skewed to higher values and an extensive ISM which allows the source to grow to a larger linear size (over a longer time span, assuming the jet velocity is similar for all FR I’s) before reaching a contact pressure discontinuity at the interface between the galaxy ISM and the ICM. For at a constant radio power, sources at may have lifetimes between 3 and 15 times longer than sources in galaxies a magnitude fainter. In another interpretation, if all radio galaxies have similar lifetimes, the difference between galaxies of different optical luminosities may be due to the spread in intrinsic beam powers plus a functional form for which depends on the properties of the galaxy ISM. Modification of equation (2) to include the dependence on and solutions for constrained by our observed luminosity functions should allow one to sort out the dependencies between , , and the luminosity and size of the host galaxy. Clearly these bivariate luminosity functions will provide an important constraint to understanding FR I evolution. Some of these ideas have already been incorporated into a model for the optical dependence of the FR I/II break by Bicknell (1995).
5 The Bivariate Luminosity Function in Different Environments
5.1 Comparison to data from Auriemma et al. (1977)
One of the first determinations of the local bivariate luminosity functions was made by Auriemma et al. (1977). Auriemma et al. constructed their sample from surveys of the B2 and 3CR samples (Colla et al. 1975), a survey of E and S0 galaxies not classified as cluster objects, and data from five rich clusters (Jaffe and Perola, 1976). The sample included objects not-selected to reside in clusters, and detections from rich clusters. Using the argument that the univariate RLF was not significantly different in and out of clusters, the samples were combined to produce a single luminosity function. Auriemma et al. does not rule out, however, that the fraction of radio galaxies might be different up to a factor of two between the two environments. Thus we should be able to compare our sample (of only rich cluster radio galaxies) to their combined group to examine what effect, if any, the local galaxy density has on the radio galaxies. The average density of galaxies in rich clusters is of the order as compared to in poor galaxy clusters or the field.
In order to construct the fractional luminosity functions, Auriemma normalized the binned values to an estimation of the optical luminosity function per unit volume. This function approximates the average density of galaxies of types E and S0 within the search volume. This correction only applied to the B2 and 3CR samples. For the rich-cluster observations, knowledge of the fractional functions were obtained directly. As they point out in their paper, their may be a bias introduced by choosing an unknown function for this purpose. In addition, their function does not have the expected shape based on our results in figure 4.
We have compared the normalization function from Auriemma et al. to a complete sample of galaxies chosen from the UGC catalog and surveyed at Arecibo by Dressel and Condon (1978). From this survey of over galaxies, the volume density of E and S0 type galaxies should be similar to that covered by the B2 and 3CR surveys. Franceschini et al. (1988) computed the optical luminosity function in bins of one magnitude intervals measured on the Zwicky magnitude system. A comparison of the Franceschini et al. and Auriemma et al. functions are shown in figure 9. We have corrected the cosmology of both data-sets (both magnitude and volume corrections) to . We see that for the faintest and brightest bins, the two functions are in reasonable agreement. For the magnitude range , however, Auriemma’s function predicts over a factor of two less objects in the search volume. Fransechini’s data is much closer to our derived function and exhibits the expected break in the optical luminosity function which is absent from Auriemma’s approximation. We have therefore renormalized the Auriemma et al. data to these revised galaxy counts in the two affected magnitude bins. Conversion to our system was made using (using from Auriemma et al. 1977; and ; Bessel, 1979) and have rebinned our data to match that of Auriemma et al. (one-magnitude bins centered on , and ).
Our bivariate functions and those from Auriemma et al. (renormalized for the two middle bins) are plotted in figures 10 A,B, & C. The scales are identical for each magnitude range to allow easy comparison over the range in optical luminosity. There are only detections in the interval, so this function was not plotted. In general, we see quite good agreement between the datasets. As before, the errorbars are uncertainties. In many cases, especially in the Auriemma et al. data, there were no detections in a bin. In these instances, upper limits are plotted with the value of one detection. For radio powers , visually the data agree very well. We have very few detections above this power in any of the bins, whereas Auriemma et al. supplemented their sample with the 3C objects which mostly fall above this power. We therefore will only compare our samples over the radio power range .
To compare the shapes of our functions to Auriemma’s, we have calculated linear-regression fits for . Auriemma chose this power cutoff as the approximate position of the break (), and calculated fits above and below for the slope. We follow an identical analysis, but keeping in mind that is actually a function of optical luminosity. In this radio power interval, the following fits were derived for the differential functions (of the form :
| (3a) | |||||
| (3b) | |||||
| (3c) | |||||
We therefore see that the functions below become flatter with increasing optical luminosity. Also, the functions are flat out to higher radio powers as increases. From figure 3, this is consistent with the position of the FR I/II division. In the lowest magnitude bin, the break occurs at . In the next magnitude bin, the division lies at . So by choosing a constant , as Auriemma and we have done in determining the slopes of the individual functions, the expected effect from figure 3 is that at bright magnitudes, there are still many sources with powers ; hence the nearly slope. In the magnitude bin, the number of sources is already dropping off very rapidly by , so the calculated slope over this range is much steeper. This fact confirms our suggestion that the position of the break is a function of optical luminosity and coincides with the FR I/II division. We have insufficient detections above powers of to determine the slope above . Auriemma found that the slope was independent of optical luminosity at higher radio powers.
In order to quantitatively determine whether the bivariate luminosity functions from our sample are consistent with those from Auriemma et al. we have performed several statistical tests. Because we are mostly interested in whether or not the fraction of radio galaxies detected (a measure of the probability for a galaxy to be radio emitting) is equivalent between samples from the different environments, tests which examine the mean values of the distributions are most appropriate. We have used two tests for this purpose; a parametric T-test and a non-parametric Wilcoxon rank test (WR). We also calculate the Spearman’s (SR) correlaton coefficient from the derived ranks. Spearman’s is a measure of the signficiance of the correlation between the two samples. For negative values, the samples are anti-correlated. Positive values indicate a correlation. See Conover (1980) for a more detailed description of these statistics.
The results of the statistical tests are summarized in Table 3. In all cases, the signficance levels are interpreted in the sense that small percentages indicate significant differences in the means. In none of the tests are the distributions different at levels higher than 3% (which is the value from the WR test for the magnitude bin). Also, no two tests on the same set of functions show significant evidence for differences in the parent populations. Within statistical uncertainties, the samples are consistent with having been drawn from the same parent distribution. Interestingly, this result was initially suggested by Fanti (1984) from a sample of clusters about one-fourth the size of our current sample.
Sources of additional errors in the determination of the luminosity functions were discussed by Auriemma et al. We have already corrected for the underestimation in the number density of galaxies in two magnitude intervals as discussed above. Most likely the largest source of error derives from the optical magnitudes from their sample. We estimate (see Ledlow and Owen, 1995b) that our isophotal magnitudes are accurate to . The Zwicky magnitudes measured for the B2 and 3CR samples, however, show systematic biases magnitudes (Colla et al. 1975; Giovanelli and Haynes, 1984). We also expect some error in transforming to our magnitude system.
Probably the most surprising observation from figure 10 is the offset in the detected fraction in the brightest magnitude bin. Because ellipticals brighter than are mostly found in clusters, we would expect that the detections in this bin are dominated by the cluster objects present in Auriemma’s sample. We would therefore expect that the functions in this bin would have the closest agreement. Of course, if the probability for radio emission does not change with environment, the fraction detected would simply scale with number of galaxies surveyed, as we have apparently observed (see also Ledlow and Owen, 1995a). A possible explanation for less-than-perfect agreement in the bin may be a result of the errors in the Zwicky magnitudes. If the magnitudes are uncertain to within , many more objects from the bin will be scattered into the range because of the shape of the optical luminosity function. From figure 5, there are approximately times as many galaxies in the bin than in the next brightest bin. Therefore, while the normalization function is constant, the number of detections will be artificially higher in the bin simply because of the error in the magnitudes and the number statistics. This would produce the observed higher detection rate seen in figure 10.
We have recalculated the integrated bivariate luminosity functions for our cluster sample. These functions are shown in figure 11. We see that, (as also found by Auriemma), the fraction of galaxies at all radio powers is greater for brighter galaxies. From figure 8, we found that brighter than , the probability for a galaxy to be radio emitting above this flux limit was constant. This fact can be understood simply by the effect of the bin width. As one increases the size of the magnitude bin, more and more galaxies of fainter luminosities are averaged because of the shape of the optical luminosity function. This will tend to lower the detection rate if the probability lowers with decreasing luminosity, as is observed. By reducing the magnitude bin size to smaller and smaller values, the resolution increases, thus enabling a more accurate representation of the optical dependence. It is because of our large sample size that we have been able to see the non-linear dependence between the number density of sources at a given radio power and the optical luminosity (which probably depends on the radio power evolution of the sources in different host galaxies).
These findings suggest that either the local galaxy density and large-scale environment in which the radio galaxy lives is not important to the formation and evolution of radio sources, or that the environments between these samples are not that different.
5.2 Comparison to the Sample from Sadler et al. (1989)
Sadler et al. (1989) observed a sample of elliptical and S0 galaxies selected from the southern ESO/Uppsala Catalogue and surveyed at and with the Parkes single dish telescope (Sadler, 1984a,b,c). All sources from this sample north of were reobserved with the VLA to map the extended structure and extend the detection limit to lower radio powers. None of these objects were selected to reside in clusters. Thus, this sample provides another good comparison with which to test the effect of environment. In addition, the flux limit of this survey extends two orders of magnitude lower than ours ( shifted to assuming , and ).
Sadler et al. discovered that nearly all ellipticals (and S0’s) with magnitudes brighter than are detected at radio powers . Galaxies fainter than are much weaker in the radio, and thermal emission from HII regions, or non-thermal radio emission from supernovae may be the origin of the emission. This is consistent with our results. From our original survey (Ledlow and Owen, 1995a) all galaxies with magnitudes fainter than -21 which were identified with radio sources were found to be background sources. Because of the slope of the FR I/II division in figure 3, the maximum power of an FR I with magnitude is a factor of smaller () than for the faintest galaxy in our sample. Since the probability for a radio galaxy to be radio emitting above is falling off rapidly in this optical luminosity range (figure 8), it is not surprising that we detect no sources in our sample at these optical luminosities. Sadler’s results suggest that all E galaxies are active at some radio power. Thus, the definition of “radio-quiet”is very dependent on the flux-limit of the survey. Ledlow and Owen (1995b) found that cluster radio galaxies could not be distinguished optically from randomally selected cluster galaxies. These observations suggest two possible interpretations; 1) all galaxies of this type have central radio sources at some power level, and it is the properties of the interstellar medium of the galaxy and the dynamics near the central engine which determine the power and size of the radio source; and 2) assuming the lifetime of radio sources is short compared to a Hubble time, or the lifetime of the parent galaxy, all elliptical galaxies have powerful radio galaxies at some time in their evolution (perhaps several times). These two ideas are not mutually exclusive. It seems likely that the properties of the interstellar medium (and the size of the galaxy) may be important in both cases. However, it is unclear whether some galaxies never have high power extended radio sources because of (1) or whether we are just observing these galaxies in a temporary quiescent state.
Sadler et al. calculated bivariate luminosity functions binned in magnitude intervals and dex wide in . All her observations are reported at . We transformed the powers to assuming . The magnitudes reported in her paper are in the system, and were transformed identically as done for the Auriemma et al. (1977) data. After these transformations, the radio power range of her sample ranges from at in magnitude bins centered on and . We have rebinned our cluster sample identically in order to allow a direct comparison. Our functions are overplotted with those of Sadler et al. in figure 12. Because the faintest galaxy in our sample is , the faintest bin is not shown. All of our objects would have fallen in the upper half of this bin where Sadler’s objects were more evenly distributed.
Because of the large bins in radio power, only two or three points along the function actually overlap our sample. Both functions are consistent within the errorbars in the overlapping regions. For lower radio powers, Sadler’s function continues to rise whereas ours remains flat in our last data point. However, we have very poor statistics in this bin (only one detection). Both functions are in agreement and consistent with near zero slope. A K-S test for both magnitude intervals rules out a significant deviation beyond the 10% level. We therefore conclude that there is no significant difference in the fraction of detected galaxies between the two samples. Elliptical galaxies in clusters appear to have equal probabilities of being detected as radio loud as compared to elliptical galaxies chosen from random samples. In addition, elliptical galaxies over the range in optical luminosities from our sample have equal, or even slighly higher, probabilities of containing radio sources nearly twenty times fainter, which we would have presumably detected given a lower flux limit. This confirms the trend from figures 2 & 3, that while bright galaxies are more likely to contain more powerful radio sources than fainter galaxies (because of the FR I/II break), they are nearly equally likely to have faint radio emission. Most ellipticals are radio emitting at some power level regardless of environment. Thus, the optical dependence of the FR I/II break appears to be consistent for objects in a variety of environments. Given the errors in the Zwicky magnitudes, and errors induced by transforming to our magnitude system, however, we cannot rule out that the slope and intercept of this relation may be different in and out of rich clusters. We will address this issue in a future paper.
All these results suggest that either the properties of the environment in the centers of rich clusters does not affect the radio source population and evolution or that the environment is not significantly different inside and outside catalogued rich clusters. The primary parameter which influences the radio properties and probability of detection is the optical luminosity of the host galaxy.
6 Conclusions
We have shown that the FR I/II division is a function of optical luminosity as well as radio luminosity. However, there is no strong correlation between the radio and optical luminosities of individual galaxies. Along a projection in the radio power plane for a constant optical luminosity the FR I galaxies can take on a large range in radio powers from the weakest detectable powers in our survey up to powers on the order of the FR I/II break luminosity. With increasing optical luminosity, the FR I/II break power increases as . There are, however, FR II sources below this break and FR I’s above the break. These features suggest that the two classes are not as distinct as once thought. It is hard to imagine from these diagrams that there is not some connection between the two classes.
The univariate RLF was calculated for our cluster sample and compared to published results from samples with very different selection criteria. Both the slope (shape) and the integrated fraction of galaxies as a function of radio power appear to be invariant quantities; not dependent on the environment in which the radio galaxies live. Therefore, while the morphology and global properties (i.e.size) of radio sources in and out of rich clusters may differ, the evolution in terms of the radio power and lifetime do not change with environment. The slope of the RLF below the break is a slowly rising function (slope = ) which continues to rise to at least two orders of magnitude fainter in radio power than our VLA cluster survey (Sadler et al. 1989). The position of the break in the univariate RLF only roughly corresponds to the FR I/II break. This results from averaging over optical luminosity and projecting a two-dimensional function onto a plane with a single variable.
The bivariate RLF was calculated in bins of magnitudes and in . It was found that the slope of the functions for are dependent on optical luminosity. With increasing optical luminosity the RLF flattens as more sources are detected at higher radio powers. All of these properties can be related to the optical dependence of the FR I/II break which coincides with the break in the bivariate luminosity functions. Therefore, is also a function of and has the relation : .
From the integral bivariate RLF’s, we have shown that the probability for a galaxy to have a radio source with increases with optical luminosity up to a magnitude . While there is a difference of magnitudes between and the brightest galaxy in the cluster, the probability of detection is essentially constant in this luminosity interval. Thus the evolutionary track of for FR I’s is a fairly strong function of the optical luminosity (or other properties which are related to it), however this dependence tends to weaken with increasing optical luminosity.
Statistical tests between our cluster luminosity functions and those derived from samples not selected to be in clusters indicate no significant dependence on the local galaxy density. This result is consistent with the invariance of the detected fraction of radio sources as a function of richness (Ledlow and Owen, 1995a). Both the shape of the luminosity functions as well as the total fraction of detected sources appear invariant with respect to the environment. This suggests that the luminosity function is representative of the intrinsic properties and evolution of radio galaxies as a class. The shape of the luminosity function is directly related to individual radio source lifetimes and is a function of both the radio power and the optical luminosity of the galaxy.
References
- (1)
- (2) Auriemma, C.G., Perola, G., Ekers, R., Fanti, R., Lari, C., Jaffe, W., & Ulrich, M. 1977, A&A, 57, 41
- (3)
- (4) Baum, S.A., Zirbel, E.L., & O’Dea, C.P. 1995, ApJ, 451, 88
- (5)
- (6) Baum, S.A., Heckman, T.M., Bridle, A.H., van Breugel, W.J.M, & Miley, G.K. 1988, ApJS, 68, 714
- (7)
- (8) Bessel, M.S. 1979, PASP, 91, 589
- (9)
- (10) Bicknell, G.V. 1995, ApJS, 101, 29
- (11)
- (12) Binggeli, B., Sandage, A., & Tammann G. 1988, ARA&A, 26, 509
- (13)
- (14) Bridle, A. 1984, AJ, 89, 979
- (15)
- (16) Cameron, M.J. 1971, MNRAS, 152, 429
- (17)
- (18) Colla, G., Fanti, C., Fanti, R., Gioia, I., & Lari, C. 1975, A&A, 38, 209
- (19)
- (20) Conover, W.J. 1980, Practical Nonparametric Statistics, John Wiley and Sons, New York.
- (21)
- (22) de Ruiter, H.R., Parma, P., Fanti, C., & Fanti, R. 1986, Astron. Astrophy. Suppl., 65, 111
- (23)
- (24) 1990, A&A, 227, 351
- (25)
- (26) Dressel, L.L. & Condon, J.J. 1978, ApJS, 36, 53
- (27)
- (28) Dressler, A. 1980, ApJS, 42, 565
- (29)
- (30) Eilek, J. & Shore, S. 1989, ApJ, 342, 18
- (31)
- (32) Eilek, J. 1993, in Jets and Extragalactic Radio Sources, (H.-J. Röser & K. Meisenheimer, eds.), Springer-Verlag, New York, p. 279
- (33)
- (34) Fanaroff, B.L. & Riley, J.M. 1974, MNRAS, 167, 31P
- (35)
- (36) Fanti, C., Fanti, R., Feretti, L, Ficarra, A., Gioia, I.M., Giovannini, G., Gregorini, L., Mantovani, F., Padrielli, L., Parma, P., Tomasi, P. & Vettolani, G. 1982, A&A, 105, 200
- (37)
- (38) Fanti, C., Fanti, R., de Ruiter, H.R., & Parma, P. 1986, Astron. Astrophy. Suppl., 65, 145
- (39)
- (40) 1987, Astron. Astrophy. Suppl., 69, 57
- (41)
- (42) Fanti, R. 1984, in Clusters and Groups of Galaxies (F. Mardirossian, G. Giuricin, & M. Mezzetti, eds.), D. Reidel, Dordrecht, p 185.
- (43)
- (44) Franceschini, A., Danese, L., De Zotti, G., & Toffolatti, L. 1988, MNRAS, 233, 157
- (45)
- (46) Giovanelli, R. & Haynes, M.P. 1984, AJ, 89, 1
- (47)
- (48) Heckman, T.M., O’Dea, C.P., Baum, S.A., & Laurikainen, E. 1994, ApJ, 428, 65
- (49)
- (50) Hill, G. & Lilly, S.J. 1991, ApJ, 376, 1
- (51)
- (52) Jaffe, W.J. & Perola, G.C. 1976, A&A, 46, 275
- (53)
- (54) Lari, C. & Perola, G.C., in The Large Scale Structure of the Universe; IAU Symposium #79, (Longair & Einasto, eds.), D. Reidel, Dordrecht, p. 137
- (55)
- (56) Ledlow, M.J. & Owen, F.N. 1995a, AJ, 109, 853 (Paper IV)
- (57)
- (58) Ledlow, M.J. & Owen, F.N. 1995b, AJ, 110, 1959 (Paper V)
- (59)
- (60) Lilly, S.J. & Prestage, R.M. 1987, MNRAS, 225, 531
- (61)
- (62) Meier, D.L., Ulrich, M.-H., Fanti, R., Gioia, I., & Lari, C. 1979, ApJ, 229, 25
- (63)
- (64) Owen, F.N. & Laing, R.A. 1989, MNRAS, 238, 357
- (65)
- (66) Owen, F.N. & White, R.A. 1991, MNRAS, 249, 164
- (67)
- (68) Owen, F.N., White, R.A., & Burns, J.O 1992, ApJS, 80, 501
- (69)
- (70) Owen, F.N., White, R.A., & Ge, J.-P. 1993, ApJS, 87, 135
- (71)
- (72) Owen, F.N. 1993, in Jets in Extragalactic Radio Sources, (H.-J. Röser & K. Meisenheimer, eds.), Springer-Verlag, New York, p. 273
- (73)
- (74) Owen, F.N., Ledlow, M.J., & Keel, W.C. 1995, AJ, 109, 14
- (75)
- (76) Owen, F.N. & Ledlow, M.J. 1994, in The First Stromlo Symposium: The Physics of Active Galaxies, (G.V. Bicknell, M.A. Dopita, & P.J. Quinn, eds.), San Francisco, PASP Conference Series: 54, 319
- (77)
- (78) Parma, P., de Ruiter, H.R., Fanti, C., & Fanti, R. 1986, Astron. Astrophy. Suppl., 64, 135
- (79)
- (80) Pearson, T.J. 1996, to appear in Energy Transport in Radio Galaxies and Quasars, (P. Hardee, A. Bridle, & A. Zensus, eds.), ASP Conference Series.
- (81)
- (82) Phillips, M.M., Jenkins, C.R., Dopita, M.A., Sadler, E.M., & Binette, L. 1986, AJ, 91, 1062
- (83)
- (84) Prestage, R.M. & Peacock, J.A. 1988, MNRAS, 230, 131
- (85)
- (86) Sadler, E.M. 1984a AJ, 89, 23
- (87)
- (88) , 1984b, AJ, 89, 34
- (89)
- (90) , 1984c, AJ, 89, 53
- (91)
- (92) Sadler, E.M., Jenkins, C.R., & Kotanyi, C.G. 1989, MNRAS, 240, 591
- (93)
- (94) Sarazin, C.L. 1986, Rev. Mod. Phys., 58, 1
- (95)
- (96) Smith, E.D. & Heckman, T.M. 1989, ApJS, 69, 494
- (97)
- (98) Zhao, J.-H., Burns, J.O., & Owen, F.N. 1989, AJ, 98, 64
- (99)
| Fraction | ||
|---|---|---|
| 22.028 | 22.428 | 2/59 |
| 22.428 | 22.828 | 7/334 |
| 22.828 | 23.228 | 26/1398 |
| 23.228 | 23.628 | 41/2210 |
| 23.628 | 24.028 | 29/2210 |
| 24.028 | 24.428 | 30/2210 |
| 24.428 | 24.828 | 31/2210 |
| 24.828 | 25.228 | 14/2210 |
| 25.228 | 25.628 | 4/2210 |
| 22.23 | 1/18 | 0/14 | 1/7 | 0/2 | |
| 22.63 | 1/104 | 1/79 | 5/41 | 0/14 | |
| 23.03 | 8/434 | 9/331 | 5/173 | 4/60 | |
| 23.43 | 11/686 | 12/523 | 12/274 | 6/95 | |
| 23.83 | 6/686 | 14/523 | 6/274 | 3/95 | |
| 24.23 | 4/686 | 14/523 | 11/274 | 1/95 | |
| 24.63 | 3/686 | 8/523 | 16/274 | 2/95 | |
| 25.03 | 0/686 | 2/523 | 5/274 | 6/95 | |
| 25.43 | 0/686 | 0/523 | 2/274 | 1/95 |
| T | Significance | Significance | WR Significance | ||
|---|---|---|---|---|---|
| -2.08 | 0.06 | 0.57 | 0.18 | 0.03 | |
| -0.61 | 0.55 | 0.70 | 0.04 | 0.49 | |
| 0.52 | 0.61 | 0.37 | 0.41 | 0.08 |