Distribution of galaxies at large redshift and cosmological parameters from the magnification bias in Cl0024+1654††thanks: Based on data obtained with the CFHT in Hawaï
Abstract
We analyse the surface density of very faint galaxies at the limit of the sky background noise in the field of the cluster of galaxies Cl0024+1654. The radial variation of their number density in the magnitude bins and displays an (anti)bias magnification effect similar to the one observed in A1689 by Broadhurst (1995) for . The study of this effect provides a determination of the radial distribution of critical lines of the gravitational lens from which we infer the redshift range of the populations seen in and .
The surface density of galaxies drops rapidly to a well-defined inner critical line near the large triple arc. The depletion extends from to and the shape of the curve can almost be reproduced with two redshift populations selected by the two filters. With our data of the -selected galaxies are between and while most of the remaining galaxies should be at a redshift close to .
The selected population observed with the lens has a similar but broader depletion with a minimum extending from the inner critical line to . Whatever the cosmological model, the very faint -selected galaxies spread up to a larger redshift with about 20% above . The fact that many faint selected galaxies are not detected in B also favour the existence of a more distant population with a redshift range between and .
Using a model for the gravitational potential derived from a study of the large triple arc seen around the cluster, the locations of the two extreme critical lines for the B and I selected galaxies favour -dominated flat universes with a cosmological constant ranging from 0.6 to 0.9. The result is confirmed by a preliminary investigation of the Broadhurst’s effect in A370.
However, ultra-deep detection of faint distant galaxies down to the noise level are technically very difficult. In this first paper we mainly discuss the method to search the so-called ”last critical line” and several possible effects which may bias the results on cosmological parameters. We conclude that the systematic measurement of this outer critical line of the faint selected galaxies population around many clusters with gravitational arcs of known (low) redshift may help to count the number of faint galaxies at very large redshifts beyond the possibility of any spectroscopic survey, and eventually to settle the issue of the existence of the cosmological constant.
Key words: dark matter - gravitational lensing - clusters of galaxies - clusters of galaxies: 0024+16; A370 -
1 Introduction
Broadhurst et al. (1995) and Broadhurst (1995) pointed out the interest of measuring the apparent variation of the surface density of background galaxies around massive clusters of galaxies. This variation is due to competing gravitational magnification and deviation effects. It depends on the slope of the galaxy counts as a function of magnitude and on the magnification factor of the lens which is responsible for a radial stretching of the field of view around the cluster. The effect can be used to map the region where the magnification factor is maximum (critical lines) and to evaluate the mass of the cluster. More generally, it provides a way to break the intrinsic degeneracy of the inversion methods in studies of gravitational weak shears (Schneider & Seitz 1995). Combined together, these tools provide a unique way to recover the total mass and the mass profile of gravitational systems.
The radial surface density of background galaxies up to a magnitude limit can be expressed as
| (1) |
where is the intrinsic count slope
| (2) |
is the magnification factor of the lens and the intrinsic counts in the absence of a lens, which is obtained from counts in a nearby empty field. It is clear from expression (1) that a radial magnification bias shows up only when the slope is different from the value 0.4; otherwise, the increasing number of magnified sources is exactly cancelled by the apparent field dilatation and there is no effect on . A radial amplification bias should not be observed behind a nearby cluster in since the slope is almost this critical value (Tyson 1988). It is only detected in the R or I bands for which the slopes are close to 0.3 (Smail et al. 1995).
When a decrease of the number of galaxies is expected in regions of magnification. The effect is strongest at the critical radius around the cluster corresponding to the most probable redshift of the background sources. Since the critical radius increases with redshift, two populations of different redshift will show two different radial depletion curves, with their minima deferring by an amount which depends on the redshift difference and the cosmological model. Therefore, from the study of the radial depletion, one can get information on the redshifts of the background galaxies. Alternatively, Broadhurst (1995) emphasised that this effect may be used to constrain the geometry of the Universe, provided we know the redshift of the two populations.
A difficulty comes from the fact that the critical radius writes and depends both from the redshift and cosmology ( and are respectively the angular distances from the lens to the sources and from the observer to the sources). In this paper we show that it is possible to disantangle the redshift distribution from the geometry of the universe provided the properties of the lens are known from the redshift of one critical line, such as the redshift of a giant arc. In the case of Cl0024+1654 we show that a population of faint blue galaxies exists that traces a reference critical line at low redshift.
There are only a few clusters for which the properties of the lens are known, around which deep B and I observations are available on a large field. An analysis of a set of rich lensing clusters is in progress (Mellier, Fort & Dantel-Fort 1996, hereafter paper II). In this paper, we present the results on Cl0024+1654 and some preliminary results on A370 in order to focus on the basic principles of the method.
In section 1 we show that we can actually detect in deep CFHT images very faint galaxies at the limit of the noise in the respective bins and and that the slope of count rates in both magnitude range are appropriate to produce an observable magnification bias. This approach has been motivated by the recent works done by van Waerbeke et al. (1996a) who used the pixel-to-pixel autocorelation function (ACF) of the sky background for measuring the shear field around lensing clusters. Though the ACF does not need object detection and cannot provide simply informations on the galaxy number counts, from the strong signal they measured in Cl0024+1654, we can predict that the number density of faint sources is high and could be useful for the magnification bias.
The second section discusses the depletion around Cl0024+1654 (z = 0.39). This cluster is ideal because giant multiple arcs have been observed which provide consistent lens modelling (Kassiola et al. 1992, hereafter KKF; Bonnet et al. 1994, Wallington et al. 1995).
The last section discusses the results including some results obtained on A370.
2 Deep galaxy counts at and
Deep observations of the cluster 0024+1654 (z = 0.39) and of a nearby reference field offset by about one degre from the cluster center were secured at the prime focus of the CFHT during the two nights in and with a constant seeing (0.7” in , 0.55” in ). The total exposure time are 10800 s for each filter. In the field of view is 4.15’3.1’ for the cluster fields and only 2.2’ 3.5’ for the blank field. In , the field of view is 7’7’ for the cluster and the blank field. The -blank field observation was contaminated by a strange meteoritic shower (Jenniskens et al. 1993) and the corresponding counts is not considered. The I count is instead extracted from the Hubble Deep Field study. A description of the observations, with a modelling of the large triple arc around the cluster, can be found in KKF. The ellipticity of the potential is small and we assume that it does not change appreciably within 30” to 60” from the cluster center.
We detected very faint galaxies by using the SExtractor software (Bertin and Arnouts 1995). The optimization of the input parameters necessary to detect extremely faint objects was performed from simulations and are available on request with a reference blank field in . The simulated galaxy counts parameters of the observations were chosen to be similar to those in our CFHT CCD images.

One of the main concerns is the significance of detection at faint magnitudes. Since a wrong estimate of the count slopes could change the estimate of the magnification, we performed additional simulations of a blank field, free from any objects (stars or galaxies), with only a pure poissonian sky background. We then optimised the parameters defining galaxies so that only a small fraction (%) of spurious events are detected. Indeed the detection depends on the noise amplitude and the method shall be used on images with good flat-fielding and stable noise statistic. Any area with an enhancement of the background like scattering of light around bright stars or bright galaxies will change the limit of detection locally and shall be masked on the image. Finally, the surface number density inferred from the galaxy counts in Cl0024+1654 fields has been corrected from the effect of sky occultation by bright cluster members.
Figure 1 shows the counts in the cluster field and the blank field. The counts have been done independently in the filter also. The detection limits are respectively in , and in . The number of expected spurious detections coming from simulations is also indicated. A plot of the recent Hubble Deep Field counts (Couch 96, private communication) is also given. The agreement between the HST counts and the CFHT counts for the blank field is excellent, giving confidence in our method. This is a good exemple of what can be done from the ground with good seeing.
We find slopes of and respectively for the counts in at and in at in the blank fields. These values are close from the HDF counts (Table 1) and the Tyson’s counts (1988) in , and compatible with the deep I band counts of Smail et al (1995). One can see on Figure 1 that at the contamination by faint cluster members is negligible.

3 The magnification bias in Cl0024+1654 and the redshifts of the blue and red background sources
Since the galaxy counts in both and have slopes below 0.25 we can expect a significant depletion of galaxies at some radii around the cluster field. The radial surface density obtained for and are given on figure 2 and 3 respectively. Both curves decrease with radius down to a minimum, and increase towards at large radius. The shows a steeper descent. Its minimum is pronounced at about 30 arcsec. and extends to 50 arcsec. from the cluster center. The curve shows a shallower broad dip ranging from 30” to about 60”. As the and count slopes are almost identical, the width of the depletion probe the relative redshift distribution of the two samples. The difference observed beyond 50 arcsec. already shows qualitatively that a fraction of the galaxies must be at a redshift significantly higher than the sample. Incidentlly we note that the behavior of the -selected galaxies not detected in is similar to the whole sample of galaxies.
The depletions of the curves given in figures 2 and 3 can be reproduced from a least square fit of the depletion generated by a population of galaxies located at various redshift:
| (3) |
where , and are respectively the number density of galaxies, the magnification and the slope of the galaxy counts of the population located at redshift . The free parameters are the slope of the galaxy counts, which at the starting point of the minimisation are assumed to be the slopes of the blank field, the redshift and the number density of the sources. Though we allow the redshift distribution of galaxies to be described with a maximum of 5 redshift bins (equivalent to 5 critical lines), we searched for solutions using a minimum of lens screen to describe the distribution of sources in redshift which are selected through our two filters. The coefficients in Table 1 correspond to the galaxy number density at redshift . It is important to note that since the apparent depletion of galaxies only lies in the innermost region of the lensing cluster, the choice of the analytical function representing the mass profile is not critical for radius in the range 25 to 150 arcseconds (Bonnet et al. 1994). Therefore, we fit the data by using the isothermal model of KKF with a core radius arcsec and a velocity dispersion of .
In the following the position of the two extreme critical lines are the important output of the fit rather than the relative redshift abundances of distant galaxies, a topic that would need more additional data on many clusters. Hence we have mostly explored the possible range of variation for the radius of the extreme critical lines in order to estimate a possible dependance on the cosmology.
| Cl0024+1654 | |||||||
| z | |||||||
| All | 40 | 6.13 | 0.0 | – | 0.17 | – | – |
| Bin | – | 2.60 | 0.0 | – | 0.20 | 0.90 | |
| All | – | 0.93 | 0.0 | – | 0.20 | 0.95 | |
| All | – | 2.60 | 0.0 | – | 0.20 | 3.00 | |
| Cl0024+1654 | |||||||
| All | 13 | 3.32 | 0.0 | – | 0.25 | – | – |
| Bin | – | 0.0 | 0.5 | – | 0.15 | ||
| Bin | – | 2.1 | 0.5 | – | 0.20 | ||
| Bin | – | 0.06 | 0.5 | – | 0.24 | ||
| Bin | – | 0.53 | 0.5 | – | 0.20 | ||
| Bin | – | 0.63 | 0.5 | – | 0.2 | ||
For the galaxies, the best fit of the depletion curve can be modelled by using only three (almost 2) redshift bins for the sources population, each of them corresponding to a slope in agreement with the slope derived from the blank field. The results of the fit is given in table 1 (reduced ). The inner critical radius is found at . This is a robust value which is well constrained by the steep shape of the depletion as the radius increases from the cluster center. If we allow the core radius to vary around the KKF value we find a very similar but marginally best fit () with a core radius of and . The uncertainties coming from a small residual error on the value of the core radius of the KKF model is negligible and in the following we keep the KKF value. But it is important to note that both the core radius and ellipticity of such an isothermal model could be determined from a mapping of the anti-bias magnification effect () over the whole CCD image (see paper II).
Whatever the cosmology the KKF model imposes that the nearest galaxies have a redshift between and . In fact this value was not unexpected. First, Mellier et al. (1991) obtained spectra of the images of the arcs whose postions are close to (see figure 2). They are blue objects and they should belong to the population. The presence of bright starburst spots clearly visible in the HST images of these arcs (Colley et al. 1995) is a strong argument that star formation is ongoing in this galaxy. Although a definite redshift cannot be given, the spectra provide compelling evidence that it could be close to one, in any case larger than 0.88: otherwise we should see a proheminent [OII]3727 emission line in the observed spectral range covered by the data. Second, with the shear profile in Cl0024+1654, Bonnet et al. (1994) infer that the galaxies responsible for the shear pattern should have an averaged redshift between 0.9 and 1.2. Third, the redshift survey of giant arcs (see Fort and Mellier 1994, Soucail 1995) and arclets (Bezecourt and Soucail 1996, Pello et al. 1996), and the lensing inversion in A370 and A2218 as well (Kneib et al 1994, 1996) provide a fairly large sample of blue-selected galaxies with magnitude ranging from 24.5 to 27, which all have a median redshift of 0.85. Most of them are between 0.65 and 1.10, but the lower redshifts of arclets have been found behind the lower redshift clusters () as expected from the properties of gravitational lensing. Besides, the average magnitude of these samples is about one magnitude brighter (26-27.5 instead of 24.5-27) so we can reasonnably expect that our faint galaxies should be somewhat more distant than , whatever the evolution model.
The depletion curve of the galaxies raises again at corresponding to a redshift of about well determined from the best fit. The redshift error is mainly dominated by the uncertainty on the redshift of the inner critical line. An important point is that the position at which the depletion curve starts to increase does not depend on the number of source screen (Table 1), but only depends on the largest redshift screen. Therefore, the depletion curves has the remarkable property to provide the spread of the redshift distribution, from the width of the depletion, and the highest redshift of the sample from the comparison of the radius of the upper critical line with a lower critical line. At this stage and before the detailed discussion of extreme redshift in paragraph 4 let’s assume that the blue population range from to , with a relatively well defined lower limit from the convergence of the lens.

For the faint galaxies the observed number density is depleted in a larger range of radii. The beginning of the dip for the galaxies is almost the same as for the galaxies, thus their averaged redshift is the same (Table 1). This is not surprising as this is the lowest redshift for which the gravitational magnification is substantial. The minimum of the depletion is broader than for the -selected sample but it has a bump between the two extreme radii. In figure 3, the best fit of the data uses the same lens model as for the galaxies, but needs a model distribution of galaxies with 4 discrete different corresponding to critical lines . The reduced is very good (0.57) if we substract to the data a uniformly distributed component corresponding to 14% of the count in the blank field. The origin of this small count excess and bump in the bottom of the depletion is not clearly understood so far (cf paragraph 5). If the bump and the relatively deep dip near the last critical line are real (Figure 3) they are not perfectly reproduced with the model (table 1). Instead the radius of the two extreme critical radii are robust and the best fit gives: and . From the modelling of the flat depletion curve we conclude that the redshifts of the galaxies are , but with a significant fraction at large redshift (table 1). According to the KKF model the most distant critical line corresponds to an abundance of galaxies of at . This is an extreme critical line where the effects of the cosmological parameters can be seen. In fact Cl0024+1654 is an ideal configuration where the role of the cosmology can be observed directly from the radius of an extreme critical line, though its effect is mixted with the redshift distribution of the sources. In the next section we consider in detail the possibility to obtain simultaneously the redshift distributions and the cosmological parameters from the positions of critical lines.
4 A tentative to constrain the cosmological parameters with Cl0024+1654
4.1 The relative scaling method
The beginning of the dip of the depletion and the radial position at which the number density of galaxies raises again define two extreme critical lines, and . Their ratio writes:
| (4) |
and provides an interesting observable parameter based on the two well-measured positions of the smaller and the larger critical radii. The dependence on is weak and is non-existent for a singular isothermal sphere. The dependence with is generally weak for simple potential since the cluster core radii are small with respect to the position of the external critical line (see Fort & Mellier for a review). However, it depends on , and the geometry of the universe defined by and .
It is possible to map the volume space () in order to find the solutions which gives a in agreement with the observations. The results are shown on figure 4 for flat universes, and on figure 5 for universes with a cosmological constant equal to zero. We have kept all the acceptable solutions, with extreme error bars (, ), which corresponds to , for an isothermal models with a core radius corresponding to the best fit parameters found by KKF. The plots only show models with and , because they are sufficient for the conclusions. Both figures show that we can find acceptable solutions for any cosmological models. However, there are clear trends for the redshifts of the sources. Whatever the acceptable models, they all imply that the clostest and the galaxies are at redshift lower than 1.0, and the most distant galaxies are at redshift higher than 2.5. A limit of the galaxies () is given by the filter itself which imposes that these galaxies have the break below 9000Å. A lower limit at is given by the spectroscopic informations from the giant arc.
The relative scaling method gives informations on the redshift distribution of galaxies that are almost independant from the lens modelling. But it does not constrain much the cosmology as far as the information on the exact radial location of the critical lines is not used. These positions depends on the lens model through the parameter . If is determined from the redshifts of arcs located at low redshifts, the location of the most distant critical line becomes a relevant observation for the cosmology.


4.2 Scaling the critical line with the lens modelling
From the last critical line which lies at a large distance from the cluster center it is possible to compute the angular distance ratio with the lens model. For simplicity, let us just express it for the case of an isothermal sphere with a core radius . The relation between and the position of the critical line is:
| (5) |
For a given , this ratio becomes significantly dependent on the cosmological model when the source redshift is large, as it is the case for the population. Hence we search in which redshift range and for which set of cosmological parameters, the ratio is equal to the observed value.

Figure 8 shows the relation to the redshift of the sources, for a lens at . The curves correspond to various cosmological models with a zero cosmological constant, or with a zero curvature. The horizontal line gives the observed ratio for the last critical line of the population in Cl0024+1654 (), computed with the best parameters of KKF (). We see immediately that many models are rejected. In particular there is no model with a null cosmological constant compatible with the data. This seems to rule out any open universe and a ()-universe as well. On the other hand, models with cosmological constant larger than 0.65 are acceptable. The upper limit for the cosmological constant is not provided by the lens, but some conservative upper bounds are given from the inferred by the CNOC dynamical analysis of rich clusters (Carlberg 1996) which give . For a flat universe, this gives . Furthermore, if we consider the robust upper limit of Kochanek (1996) coming from the statistic of gravitationally lensed QSOs, the possible range is apparently converging on an almost unique value: .
The redshift range permitted for the distant population is between 2.5 and 6.5, in agreement with the previous relative scaling method. The redshift of the population at the first critical line observed at the beginning of the dip is still found to be near as expected from the discussion in 3 and 4.1.
In this method, the determination of is the critical parameter. The uncertainties are dominated by the lens model, particularly by the error on the velocity dispersion. Assuming a redshift between to for the giant arc, the KKF’s best model gives between 1200 and 1400 km/sec, whereas Wallington et al. (1995) give 1100 to 1400 km/sec. This uncertainty will be suppressed as soon as the redshift of the triple arc will be well known (an observational priority). Both determinations are in good agreement with the galaxy velocity dispersion directly measured by Dressler et al. (1260 km/sec; 1985). In fact, it is remarkable that Bonnet et al. have already shown that the shear profile in Cl0024+1654 is compatible with a isothermal sphere with and . If the velocity dispersion we use from the lens modelling is correct, then the uncertainty only comes from the rather small redshift range we found for the population at which can be converted to an equivalent small error on the velocity dispersion. For , is as low as 50 km/sec. On figure 7 we have also plotted the observed ratio for km/sec and km/sec. One can see that the constrains are still reasonnable, but it clearly emphasises that the dependance on may be an important shortcoming.
Waiting for a precise redshift measurement of the large arc in Cl0024+1654 arc one have tentatively try to check the consistency of the results by searching the last critical line of the population on another cluster for which the redshift of large multiple arc is known: A370.
4.3 Scaling the last critical line in A370
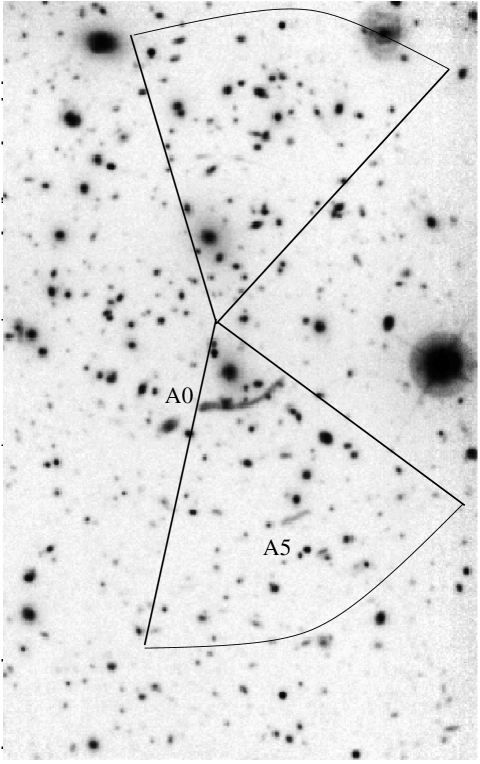
The redshift of the arc is 0.725 (Soucail et al. 1988) and the galaxy velocity dispersion is 1300 km/sec (Mellier et al. 1988). The cluster is at a redshift of 0.375, almost identical to Cl0024+1654. Unfortunately, A370 is not as regular as Cl0024+1654. Its bimodal structure is well established from the lens modelling (Kneib et al. 1993) and from the ROSAT X-ray map (Fort and Mellier 1994). Furthermore, the arclet distribution shows that there is probably another mass condensation to the east (Kneib et al 1994). We restrict our study to two -sectors along the axis passing through the center of the two cD galaxies which appear almost free of additional perturbations and are not crowded by bright foreground galaxies. They are shown on figure 9. Since we only have very deep images with very good seeing, we concentrate on this color only. A detailed analysis will be given in paper II and we just give here a preliminary analysis that uses the symmetry of the bi-modal potential.
The two clumps have a remarkable alignement and almost similar geometrical and dynamical parameters (Kneib et a. 1993). The depletion curves can be refered to the barycenter of the two clumps, though the bimodal shape of A370 makes the relation between the last critical line and the redshifts of sources less obvious than Cl0024+1654. Since we have selected two symmetric areas aligned with the main axis of A370, we expect the critical lines to be almost the same in the opposite North and South sector cones. The depletion curves are plotted on figure 10. They are very noisy because the number of detected galaxies is much lower than around Cl0024+1654. Indeed they do not display a broad minimum so clearly, though their shape reveals a depleted area similar to Cl0024+1654. We find the possible radius of the extreme critical line along the main axis to be at arcsec, surprisingly similar to the value obtained for Cl0024+1654. The vertical line on figure 10 indicates the position of the giant arc critical line along the main axis.
We applied the same method as in Cl0024+1654 to find the cosmologies compatible with the data. The two cD potentials are identical, with the same core radii and velocity dispersions . Hence, along the main axis, the potential well can be written:
| (6) | |||||
where is the ellipticity of the two clumps (identical), and gives their position with respect to the barycenter.
From one can derive the position of the tangential critical lines along the main axis. This gives a relation between the velocity dispersion, core radius and scaling coefficient
| (7) |
which can be solved numerically.
The term can be obtained directly by using equation (7) at the position and the redshift of the giant arc. With a simple model assuming that does not change with radius, equation (7) can be plotted in order to find acceptable solutions for the last critical radius observed in A370.
If it is true, we found similar constraints on the redshift of sources and on the cosmological parameters as in Cl0024+1654. The most distant galaxies corresponding to the last critical radius have whatever the cosmological model. More precisely, if is larger than 0.16 from the CNOC works (resp. 0.3 from weak lensing in clusters) then the galaxies are at a redshift lower than 6 (resp. lower than 4.7).
Models with zero cosmological constant and are incompatible with the data. However, we cannot rule out any values for , even those close to . A similar remark has been incidently made by Kneib et al. (1993) when trying to explain the large ellipticity of the arclet A5 in A370 with the lens modelling. The uncertainty probably comes from the general shape of the cluster which is not as regular as our analytical description. Fort & Mellier (1994) show the isoluminosity contours of the red cluster galaxies and the X-ray map. If light traces mass, then the discrepancy with respect to an regular elliptical potential is clear. In this case, it is more appropriate to map the magnification from the local depletion everywhere in the cluster field. This preliminary study of A370 confirms that the method of the last critical line gives reliable result only if it is used in conjonction with a self consistent modelling of the large arcs (paper II).


5 Discussion
The analysis of the magnification bias proposed by Broadhurst (1995) around rich lensing clusters can be used to infer the redshift distribution of faint galaxies. First tentatives in Cl0024 and A370 show that consistent informations were provided by these two clusters. The beginning of the dip at the first critical line corresponds to a redshift of for the and galaxies. The magnified galaxies spread over a larger redshift range from to probably in both Cl0024 and A370. From the study of Cl0024+1654 we suggest that about of the faint population is at redshifts above , and together with the knowledge of the lens model, namely the velocity dispersion, they give interesting information on the cosmology. It is surprising to find that both for the and selected galaxies the abondance of galaxies is not a uniformly decreasing function of redshift but rather corresponds to a bimodal distribution with few galaxies in the redshift bin . The shape of the distribution is remarkably similar to the photometric redshift distribution of the HDF population predicted by Stephen et al. 1996. Our sample cannot reproduce the shape below for obvious reasons, but we clearly have a peak below and a secondary broad peak between to . The apparent bump in the middle of the depletion curve in could be real bias magnification signature but it could also be related to the presence of an additionnal condensation of galaxies.
The use of the velocity dispersion obtained from the best lens modelling of Cl0024+1654 gives the position of the inner critical lines with a redshift consistent with our findings from the spectro-photometric observation of blue arc(let)s. The spectrum of the Cl0024+1654 arc is also a preliminary confirmation of the redshift prediction. For the most outer critical line the significant fraction of the red galaxies which are not detected in the -band suggests that the break lies beyond 5000Å, which also favors a redshift larger than 3. These galaxies might be the faint end of population detected with the Keck telescope by Steidel et al. (1996). From table 1 there number density is about /arcmin2.
For the cosmological test with the last critical line, a difficulty when using the magnification bias from galaxy number counts is the clustering of the background galaxies that may adulterated the curve . Highly clustered background sources may bias the depletion curves toward a well-defined peak at some radius. It seems this major difficulty has been mostly avoided by going to fainter background galaxies. An additionnal test of the surface brightness to select the most distant ones with less clustering (see section 3) is too difficult for objects close to the noise. The fact that the two curves obtained here fit well those expected from the lens modelling seems an a-posteriori confirmation that the method is efficient. Besides, a large condensation of blue galaxies just behind the cluster center is not visible as a bump in the galaxies count in the cluster field with respect to our blank field or to the HDF field. Figure 1 does not show any perturbation of the slope in the cluster field.
The constraints we obtained for the cosmological parameters are essentially based on the determination of the ”last” critical lines in . The possibility to materialize a critical line at very large redshift seems to provide a lower limit on the cosmogical constant since the deviation angle is larger than expected for an open universe. Some effects may affect the results. One is the fact that we are observing clusters with large arcs which could be sources associated with a large condensation of mass also. This mass might act as an additional deflector for most distant galaxies that would then be deflected twice when the light passes through the two consecutive lenses. This might be wrongly modelled as a single lens with a larger critical radius. With deeper exposure time with a VLT a test can be performed to detect such possible condensation of galaxies by using color index distribution of galaxies (Mellier et al. 1994). The frequent discovery of unexpected shear around foreground groups in the field of over-luminous quasars (Bonnet et al. 1993, Fort et al. 1996) is an indication that mass condensations are not rare. Similarly the ”elliptical crisis” that come from the too high occurence of four lensed quasars can be also explained if their field has an additional shear field. These additional deflectors are indeed particular cases of additional mass sheets which increase the angular scale of the gravitational bench as a cosmological constant would do. Such intervening matter could be difficult to observe since it does not modify the shear pattern (Schneider & Seitz 1995). A second possible bias is that the ellipticity of the cluster potential changes significantly between 30’ and 60” from the cluster center but this is not seen on the shape of the depleted area around Cl0024+1654. Although these two biases cannot be systematic for all cluster with large arcs they have to be kept in mind for Cl0024+1654 and A370 which display several bright blue arclets. With the lens model it is possible to infer their clustering properties in the source plan if we suppose they are all at the same redshift. This should be done in the future.
In conclusion, going close to the noise to search for an extreme critical line can provide information on the redshift distributions of the faintest galaxies and a direct test on the cosmology. It seems from this preliminary investigation that a flat universe with a cosmological constant near 0.65 could be a possibility. This value is still in agreement with the Kochanek’s (1995, 1996) upper value coming from the statistical analyses of lensed quasars, and from the tentative predictions of Mo and Fukugita (1996). It is also compatible with the parameter range inferred by van Waerbeke et al. (1996b) from the neo- statistics of quasars. As well, the result for a large abundance of high-redshift galaxies is compatible with the recent spectroscopic detection with the Keck telescope by Steidel et al (1996). An interesting consequence of the large radial distance of the last critical line is that red gravitational pairs candidates should be now searched for much larger radii than the large blue arcs. A few candidates are known around some clusters and their spectroscopy could give a confirmation of all the results presented here. It is also clear that it is absolutely necessary to use our method on a large numbers of clusters and to use very good modelling of large gravitational arcs systems before to expect strong constraints on the cosmological parameters. Such an observing programme is a typical one for 10-meters telescopes.
Acknowledgements. We thank James Lequeux, G. Mathez and Peter Schneider for useful discussion, their encouraging support and comments on the manuscript. W. Couch kindly proposed his HDF catalog and his own selection parameters for running SExtractor. We thank R. Pelló for providing the redshifts of arclets in A2218 prior to publication.
References
- 1 Bertin E., Arnouts S. 1996, A&AS in press
- 2 Bezecourt, J., Soucail, G. 1996, in press.
- 3 Bonnet, H., Fort, B., Kneib, J.-P., Mellier, Y., Soucail, G. 1993, A&A 280, L7.
- 4 Bonnet, H., Mellier, Y., Fort, B. 1994, ApJ 427, L83.
- 5 Broadhurst, T.J., Taylor, A.N., Peacock, J. A. 1995, ApJ, 438, 49.
- 6 Boadhurst, T.J. 1995, SISSA preprint astro-ph/9511150.
- 7 Colley, W. N., Tyson, A. J., Turner, E. L. 1995, SISSA preprint astro-ph/951218.
- 8 Dressler, A., Gunn, J. E., Schneider, D. P. 1985, ApJ 294, 70.
- 9 Fort, B., Mellier, Y. 1994, A&AR 5, 239.
- 10 Fort, B., Mellier, Y., Dantel-Fort, M., Bonnet, H., Kneib, J.-P. 1996, A&A in press.
- 11 Kassiola, A., Kovner, I., Fort, B. 1992, ApJ 400, 41 (KKF).
- 12 Kneib, J.-P., Mellier, Y., Fort, B., Mathez, G. 1993, A&A 273, 367.
- 13 Kneib, J.-P., Mathez, G., Fort, B., Mellier, Y., Soucail, G., Longaretti 1994, A&A 286, 701.
- 14 Kneib, J.-P., Ellis, R. S., Smail, I., Couch, W. J., Sharples, R. M. 1996, SISSA preprint astro-ph/9511015.
- 15 Kochanek, C. S. 1995, SISSA preprint astro-ph/9510077
- 16 Kochanek, C. S. 1996, CfA preprint 4283.
- 17 Mellier, Y., Soucail, G., Fort, B., Mathez, G. 1988, A&A 199, 13.
- 18 Mellier, Y., Fort, B., Soucail, G., Mathez, G., Cailloux, M. 1991, ApJ 380, 334.
- 19 Mellier, Y., Dantel-Fort, M., Fort, B., Bonnet, H. 1994, A&A 289, L15.
- 20 Mo, H. J., Fukugita, M. 1996, SISSA preprint astro-ph/9604034.
- 21 Smail, I., Hogg, D., Yan, L., Cohen, J. G. 1995, ApJ 449, L105.
- 22 Schneider, P., Seitz, S. 1995, A&A 297, 287.
- 23 Soucail, G., Mellier, Y., Fort, B., Mathez, G., Cailloux, M. 1988, A&A 191, L19.
- 24 Soucail, G. 1995
- 25 Steidel, C. C., Giavalisco, M., Pettini, M., Dickinson, M., Adelberger, K. L. 1996, SISSA preprint astro-ph/9602024
- 26 Tyson, A.J. 1998, AJ 96, 1.
- 27 Wallington, S., Kochanek, C. S., Koo, D. C. 1995, ApJ 441, 58.
- 28 van Waerbeke, L., Mellier, Y., Schneider, P., Fort, B., Mathez, G. 1996a, A&A in press. SISSA preprint astro-ph/9604137.
- 29 van Waerbeke, L., Mathez, G., Mellier, Y., Bonnet, H., Lachièze-Rey, M. 1996b, A&A in press. SISSA preprint astro-ph/9508026.