High-Dispersion Spectroscopy of Luminous, Young Star Clusters: Evidence for Present-Day Formation of Globular Clusters 111Based on observations obtained at the W. M. Keck Observatory.
Abstract
We present evidence that some of the compact, luminous, young star clusters recently discovered through images taken with the Hubble Space Telescope (HST) have masses comparable to those of old Galactic globular clusters. The “super star cluster” in the center of the nearby amorphous galaxy NGC 1705 has been observed with high dispersion at optical wavelengths using the HIRES echelle spectrograph on the Keck 10 m telescope. Numerous weak metal lines arising from the atmospheres of cool supergiants have been detected in the integrated spectrum, permitting a direct measurement of the line-of-sight stellar velocity dispersion through cross-correlation with a template star; the result is = 11.41.5 km s-1. Assuming that the system is gravitationally bound and using a cluster size measured from HST images, we apply the virial theorem to obtain the dynamical mass. Its derived mass [(8.22.1)104 M⊙], mass density (2.7104 M⊙ pc-3), and predicted mass-to-light ratio after aging by 10–15 Gyr [0.6–1.6 ()⊙] closely resemble those of the majority of evolved Galactic globular clusters. The central cluster in NGC 1705 appears to be very similar in nature to one of the bright clusters in NGC 1569, which was discussed earlier this year by Ho & Filippenko. We also observed the brightest cluster in the Magellanic irregular galaxy NGC 4214, but no lines suitable for measuring its velocity dispersion were detected, most likely because of the very young age of the cluster. Although these observations need to be extended to a much larger sample of objects before generalizations can be made concerning the nature of similar clusters observed in other galaxies, our preliminary results are tantalizing and strongly suggest that, at least in two cases, we are witnessing globular clusters in their extreme youth.
1 Introduction
Globular clusters are believed to be among the oldest relics in galaxies; as such, understanding the circumstances and physical mechanisms by which they formed may shed light on the process of galaxy formation itself (see contributions in Smith & Brodie 1993). A number of lines of evidence suggest that the stars within most globular clusters must have formed coevally over a short duration (Murray & Lin 1993). Whatever the exact conditions might have been, by all accounts such systems represent a highly extreme mode of star formation that is evidently unseen at the present epoch (Harris 1991), with the possible exception of a few of the young and intermediate-age populous clusters in the Magellanic Clouds (Mateo 1993).
Thus, there has been great excitement surrounding the discovery, from images taken with the Hubble Space Telescope (HST), of a class of luminous, compact, and apparently young star clusters in the cooling-flow/merger-remnant galaxy NGC 1275 (Holtzman et al. 1992), which was shortly thereafter followed by other similar examples found in the merging galaxies NGC 7252 (Whitmore et al. 1993) and NGC 4038/NGC 4039 (Whitmore & Schweizer 1995). The very high luminosities and small sizes of these objects, coupled with their relatively young ages, prompted suggestions that they may be young globular clusters. Numerous examples of such young clusters have surfaced from other HST imaging studies, both at optical and ultraviolet (UV) wavelengths (see Ho 1996 for a summary). Although some of the most spectacular cases have been found in interacting and merging systems, it now appears that these clusters can also form in more quiescent environments such as circumnuclear rings in relatively undisturbed galaxies (Benedict et al. 1993; Barth et al. 1995, 1996; Maoz et al. 1996). Evidently the central regions of certain dwarf irregular and amorphous galaxies are also conducive to forming compact, luminous clusters. Some, like NGC 1569 and NGC 1705 (O’Connell, Gallagher, & Hunter 1994), appear isolated, while others such as NGC 1140 (Hunter, O’Connell, & Gallagher 1994), M82 (O’Connell et al. 1995), and NGC 4214 (Leitherer et al. 1996) show obvious signs of ongoing interaction. Several seminal ground-based studies (O’Connell & Mangano 1978; Arp & Sandage 1985; Melnick, Moles, & Terlevich 1985; Lutz 1991) have adumbrated these findings, but it took the resolving power of HST to showcase the extraordinary properties of the clusters.
Despite the recent progress, many basic properties of the clusters remain unknown. At the moment, perhaps the most pertinent missing piece of information to test the young globular cluster hypothesis is the mass of the clusters. Although the masses of globular clusters in the Galaxy span a wide range, the average mass (2105 M⊙; Mandushev, Spassova, & Staneva 1991) greatly exceeds that of open clusters. For instance, even a fairly rich open cluster such as M11 has a mass of only 5000 M⊙ (Mathieu 1984). The mass of the central portion of the M35 cluster has been estimated to be 2000–3000 M⊙ (Leonard & Merritt 1989), while the Hyades contain no more than 400 M⊙ (Gunn et al. 1988). Thus, in general there should be no ambiguity between the masses of open and globular clusters. A more robust discriminant might be the mass density, since globular clusters tend to be much more compact than open clusters. A reliable estimate of both the size and mass of the young clusters should therefore clarify the nature of these objects. Although the accuracy of the published cluster sizes can certainly be improved, fairly stringent measurements or upper limits are already available from HST. By contrast, no direct, model-independent mass estimates exist. Masses quoted in the literature invariably rely on stellar population models, whose uniqueness and reliability are difficult to judge given their dependence on a large number of poorly constrained parameters.
From a practical viewpoint, the clusters found in the nearby dwarf galaxies offer us the best chance to study the phenomenon in detail. In particular, NGC 1569 hosts two dominant clusters (conventionally denoted “A” and “B”; see Arp & Sandage 1985), while NGC 1705 contains only one (Melnick et al. 1985a). Because of their proximity, these three clusters have been spatially resolved to a greater degree than any others studied with HST (O’Connell et al. 1994). The size of the central knot in NGC 4214 is somewhat less certain (Leitherer et al. 1996), but nevertheless better known than those in more distant galaxies. We take advantage of the well-determined sizes and the relative brightnesses and isolation of these clusters to try to obtain velocity dispersions and estimate their dynamical masses.
Using the Keck 10 m telescope on Mauna Kea, Hawaii, we acquired high-dispersion optical spectra of one of the two clusters in NGC 1569 (object “A,” hereafter NGC 1569-A), and of the single dominant cluster in NGC 1705 (hereafter NGC 1705-1) and in NGC 4214 (hereafter NGC 4214-1). This paper will primarily concentrate on NGC 1705-1 and NGC 4214-1; Ho & Filippenko (1996; hereafter Paper I) discuss the results on NGC 1569-A. Some observational and technical details not given in Paper I are described here.
2 Observations and Data Reduction
Object selection was guided primarily by sensitivity considerations and by the ability to spatially isolate the cluster using a narrow slit. In practice, we were thus limited to the most nearby systems. In order to facilitate background subtraction, preference was given to clusters with relatively uncomplicated surroundings, since the spectrograph used (see below) did not yet have an image rotator. Good data were taken for three clusters having 14.7–14.8 mag (see § 1 and Table 1); regrettably, time limitations did not permit observation of cluster B in NGC 1569, whose photometric properties appear very similar to those of NGC 1569-A (O’Connell et al. 1994). We also attempted to obtain spectra of the brightest cluster in NGC 1275 ( = 18.2 mag; Holtzman et al. 1992) for which Zepf et al. (1995) had recently acquired a low-resolution spectrum. The bright galaxy background in this case greatly complicated centering and guiding of the cluster on the slit, and our data turned out to be of poor quality; we will not further consider this object here.
The spectra were acquired on 9 January 1996 UT using the HIRES echelle spectrograph (Vogt et al. 1994) on the Keck 10 m telescope. The echelle and cross-disperser grating angles were carefully tuned to select the spectral regions of interest, since the CCD chip does not cover the full spectral range for 5100 Å. Two setups were designed for this experiment, both using the red collimator of HIRES. The “optical” setting extended from 3900 Å (to include Ca II H & K) to 6280 Å in 34 spectral orders; it was selected to sample as many metallic and molecular stellar absorption features as possible in the violet to red region. A KV380 order-blocking filter was used to cut off second-order blue light. The “near-infrared” (NIR) setting, on the other hand, was primarily intended to record the Ca II IR triplet (8498, 8542, 8662); the wavelength coverage extended from 6500 Å to 8800 Å in 16 orders, with significant gaps, and an OG530 order-blocking filter was used. NGC 1705-1 and NGC 4214-1 were observed in both settings, whereas NGC 1569-A was observed only in the optical setting.
The length of the slit for the optical setting was 7′′ (“C5” decker; Vogt 1994), and 14′′ for the NIR setting (“D1” decker). We chose these values to simultaneously maximize the amount of sky coverage while preventing significant overlap among the orders; in the case of the optical setting, however, the first 5 or 6 orders overlapped partially. The bulk of the observations were taken through a slit of width 115, yielding an effective spectral resolution, as determined from the profiles of the comparison lamp emission lines, of 38,000 ( = 3.4 km s-1). If the clusters indeed have masses comparable to those of most globular clusters (5104–5105 M⊙; Mandushev et al. 1991), we expect velocity dispersions along the line of sight to be 5–15 km s-1 (e.g., Illingworth 1976; Mandushev et al. 1991; Dubath, Mayor, & Meylan 1993), which will be detected comfortably with this resolution. On the other hand, we do not know a priori the masses of the clusters; to ensure sensitivity to masses as small as, say, 104 M⊙, the typical cluster radius of 2 pc implies that a velocity resolution of 3 km s-1 must be achieved. Thus, for NGC 1705-1, we also obtained limited data using a slit of width 057 (deckers “B2” and “B3” for the optical and NIR settings, respectively), with an effective resolution of 60,000 ( = 2.1 km s-1). Note that the chosen slits (especially the wide one) sample most of the light from the clusters in the absence of atmospheric seeing, provided that the objects are properly centered and the telescope guiding is stable, since the half-light diameters of 2–4 pc subtend only 01–03 on the sky.
We binned the Tektronix chip (2048 2048 square pixels) 1 2 (spectral spatial dimension) in order to decrease the effective readout noise; each binned pixel projected to 041 on the sky, with a readout noise of 5 electrons. Bias frames taken at the beginning and end of the night indicate that the chip is stable and has negligible dark current.
NGC 1569-A stood out prominently against the galaxy background in the acquisition/guiding camera; cluster B, of slightly lower brightness, is located approximately 8′′ away (O’Connell et al. 1994) and did not present a source of confusion. We integrated on the cluster for a total of 7200 s in the optical setting, split into 4 half-hour exposures to facilitate the removal of cosmic rays. Being by far the brightest object at visual wavelengths in NGC 1705, NGC 1705-1 was also readily identified and centered on the slit. According to Meurer et al. (1995), a second cluster (NGC 1705-2) is located 094 away; however, since it is fainter than the primary object by 3 magnitudes (in the UV), it is unlikely to contaminate significantly the signal of NGC 1705-1. The most useful data resulted from a total integration of 3600 s (split into 2 half-hour exposures) in the optical setting with the wide slit. We also took spectra in the higher resolution mode at both the optical (2 300 s) and NIR (2 600 s) settings, but the integration times were insufficient to yield useful results. Finally, NGC 4214-1 was observed for 5200 s (3 half-hour exposures) and 2400 s (2 1200-s exposures) in the optical and NIR settings, respectively. Line emission from H II regions contributes substantially to the optical flux of NGC 4214, especially in the immediate vicinity of the star cluster of interest (Sargent & Filippenko 1991). To minimize confusion in the identification of the object and subsequent guiding, we found it useful to introduce a (largely) line-free color filter in the light path of the acquisition/guiding camera.
To enable identification and removal of telluric lines in the spectra of the program objects, we observed the sdF5 stars HD 19445 and HD 84937 (Oke & Gunn 1983), whose spectra have relatively few features. In addition, we took short exposures of several bright template stars with known spectral types, selected from the Bright Star Catalog, for use in the cross-correlation method to derive velocity dispersions. As we are primarily interested in kinematic information, no effort was made to perform flux calibration. The program objects and standard stars were interleaved with exposures of thorium and argon hollow cathode comparison lamps to monitor shifts in the wavelength scale. The sky was approximately photometric throughout the night, although the seeing, as judged by the spatial profiles of stars, was mediocre (full width at half-maximum 12–18).
Data reduction — including bias subtraction, flatfield correction, removal of cosmic rays, extraction of one-dimensional spectra, and wavelength calibration — closely followed standard procedures for echelle spectroscopy, as described by Ho & Filippenko (1995), and will not be repeated. We mention here only a few noteworthy exceptions particular to this data set. (1) The short-wavelength orders of the optical setting have very little signal as a consequence of the low throughput of the red collimator and the decreasing sensitivity of the CCD at these wavelengths. To increase the counts in the flatfield frames at blue wavelengths without saturating the chip at the red end, a set of relatively long internal quartz lamp exposures were taken with the blue-sensitive BG12 filter. These frames were combined with the usual flatfields taken with the red-sensitive NG3 filter to create a “master” flatfield, which has relatively uniform counts in the entire spectral range. (2) In all cases, the spectra analyzed in this paper refer to a fixed effective aperture of 115 205. We experimented with the alternative optimal-extraction technique described by Horne (1986), but the improvement in signal-to-noise ratio (S/N) was not appreciable, and so we chose to retain the fixed-aperture spectra. (3) The relatively short length of the slit, the presence of extended, nonuniform nebular emission surrounding each cluster, and the variation of the background as the slit rotates during each exposure render “sky subtraction” very difficult in the vicinity of bright emission lines. In almost all cases, the background under the object of interest differs appreciably from that of the neighboring pixels. In fact, all three star clusters sit in local minima in the distribution of ionized gas (NGC 1569-A, Waller 1991; NGC 1705-1, Meurer et al. 1992; NGC 4214-1, Sargent & Filippenko 1991), and background subtraction introduces spurious negative features in the object spectra. Although the stellar absorption features of primary interest to us do not have emission-line counterparts, and thus are not affected by this problem, we decided not to perform sky subtraction for the regions of the spectra containing prominent emission lines. The exact pixel ranges to flag were determined by careful visual examination of each echelle order in the two-dimensional data frame. This allows us, for instance, to obtain a more reliable representation of the combined absorption plus emission profiles of the main emission lines. For the remaining portions of the spectrum, the background spectrum was extracted by averaging two nearby regions ( = 16 to 25 from the cluster centroid) on opposite sides of the object. (4) The dispersion in the wavelength solution of the present data is 0.006 and 0.007 Å (1) for the optical and NIR settings, respectively, somewhat worse than that obtained by Ho & Filippenko (1995).
At the time of the observations, HIRES was not yet equipped with an image rotator or an atmospheric dispersion compensator. Since the position angle of the spectrograph slit was generally not at the parallactic angle, light losses from atmospheric dispersion are expected to affect observations acquired at high airmasses, especially for short wavelengths (Filippenko 1982). Specifically, an object centered on the slit as viewed on the television screen in fact is progressively offset from the center of the slit for wavelengths far from the peak of the bandpass sensitivity (5000–6500 Å) of the camera. For large airmasses, therefore, portions of the spectrum much bluer or redder than the peak cannot be trusted, especially if there are other sources of light in the vicinity of the object. At a declination of +65∘, the airmass during the observation of NGC 1569-A remained moderately high (1.5–1.9). NGC 1705-1 (declination –53∘) was affected most severely, since the airmass never decreased much below 3.5. NGC 4214-1, on the other hand, should be hardly affected (airmass 1.2).
3 Results and Analysis
3.1 The Spectrum of NGC 1705-1
A number of different photometric indicators, summarized by Marlowe et al. (1995), suggest that the age of NGC 1705-1 is on the order of 10–20 Myr. Population synthesis models (e.g., Charlot & Bruzual 1991; Bruzual & Charlot 1993) for a cluster of this age predict that the integrated light blueward of the band is still dominated by stars on the main sequence, mainly of early-B spectral type, whereas the flux at and redward of the band comes largely from supergiants, the majority of which should be of late type (O’Connell 1996). These predictions appear to be in accord with the observed spectral properties of the cluster. According to Melnick et al. (1985a), the low-resolution optical spectrum of NGC 1705-1 at wavelengths shorter than 6000 Å is dominated by stars of spectral type B3 V; they mention the possible detection of some metal lines from later spectral types, but this was difficult to discern with certainty given the quality of their data. Meurer et al. (1992) also published a low-resolution optical spectrum, but it yielded no new information because neither the wavelength coverage nor the S/N was better than that of the Melnick et al. data. Lamb et al. (1985) interpreted the Si IV and C IV absorption lines seen in the UV spectrum as signatures of early B stars (but see York et al. 1990). A sizable population of red supergiants has been invoked to explain the near-IR colors of the cluster (Melnick, Moles, & Terlevich 1985; Meurer et al. 1992; Quillen et al. 1995); this seems justified given the presence of the Ca II triplet absorption lines in its near-IR spectrum (Heckman 1996). Melnick et al. (1985b) also detected the 2.2 m CO absorption band head, a signature of a substantial population of red supergiants.
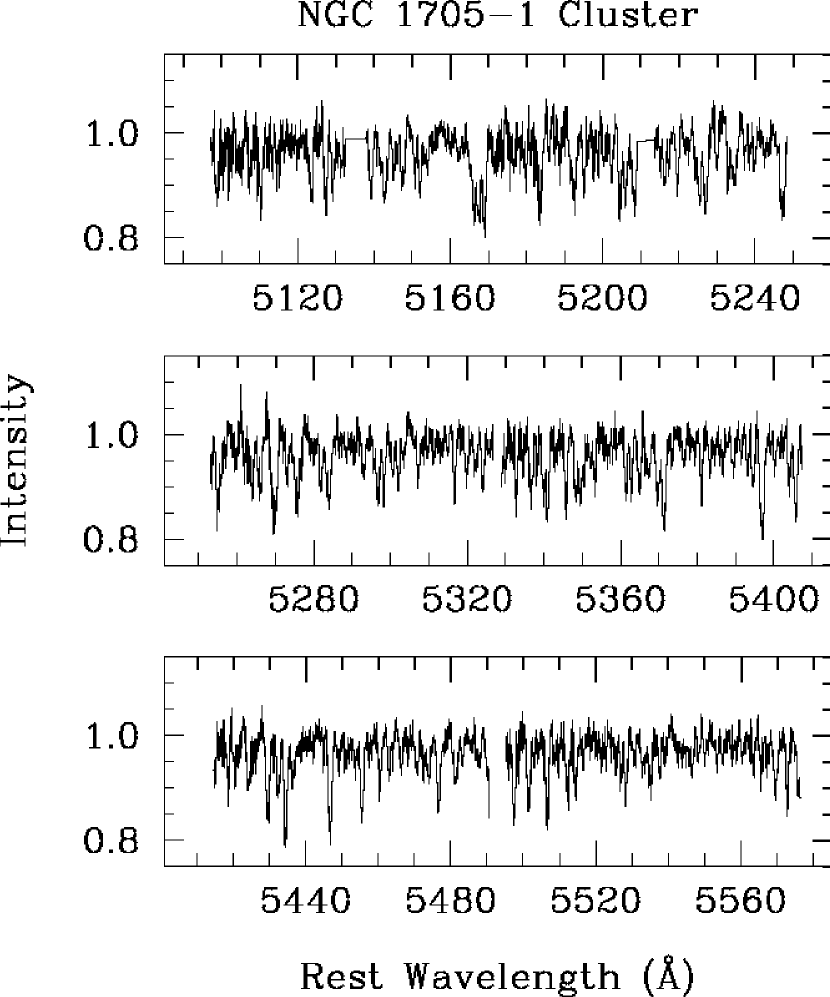
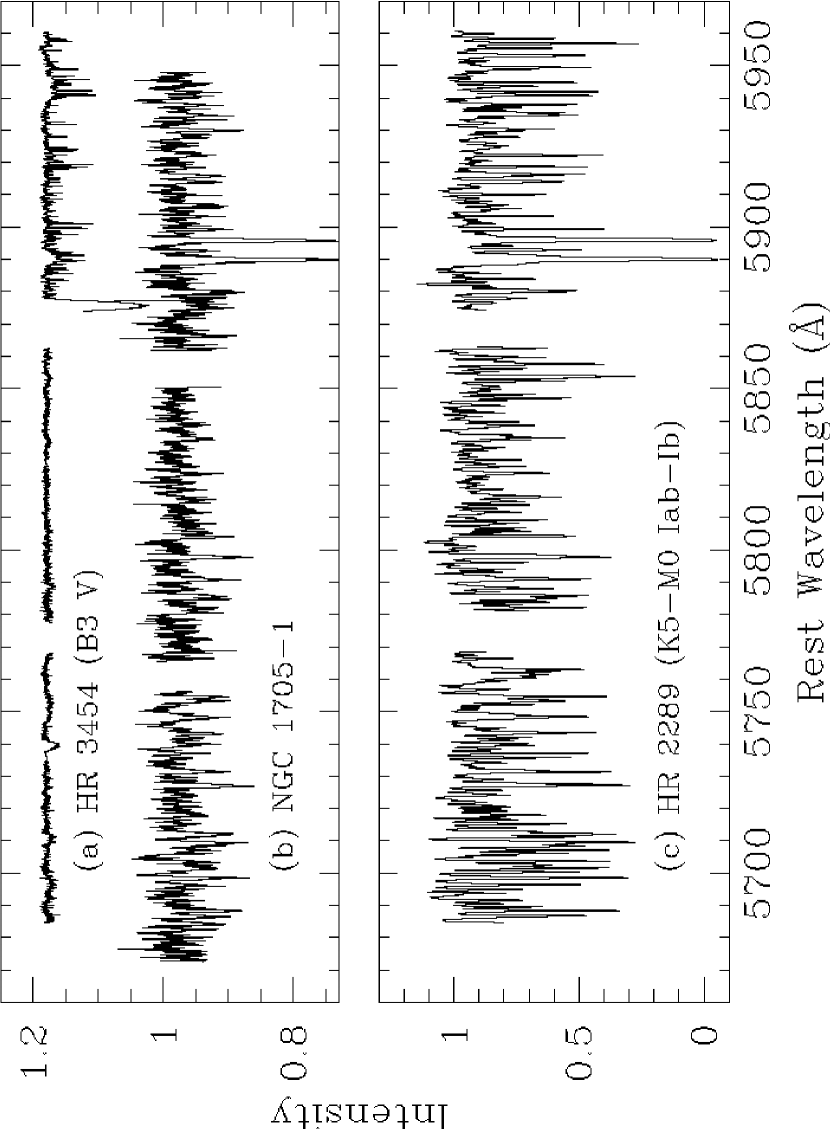
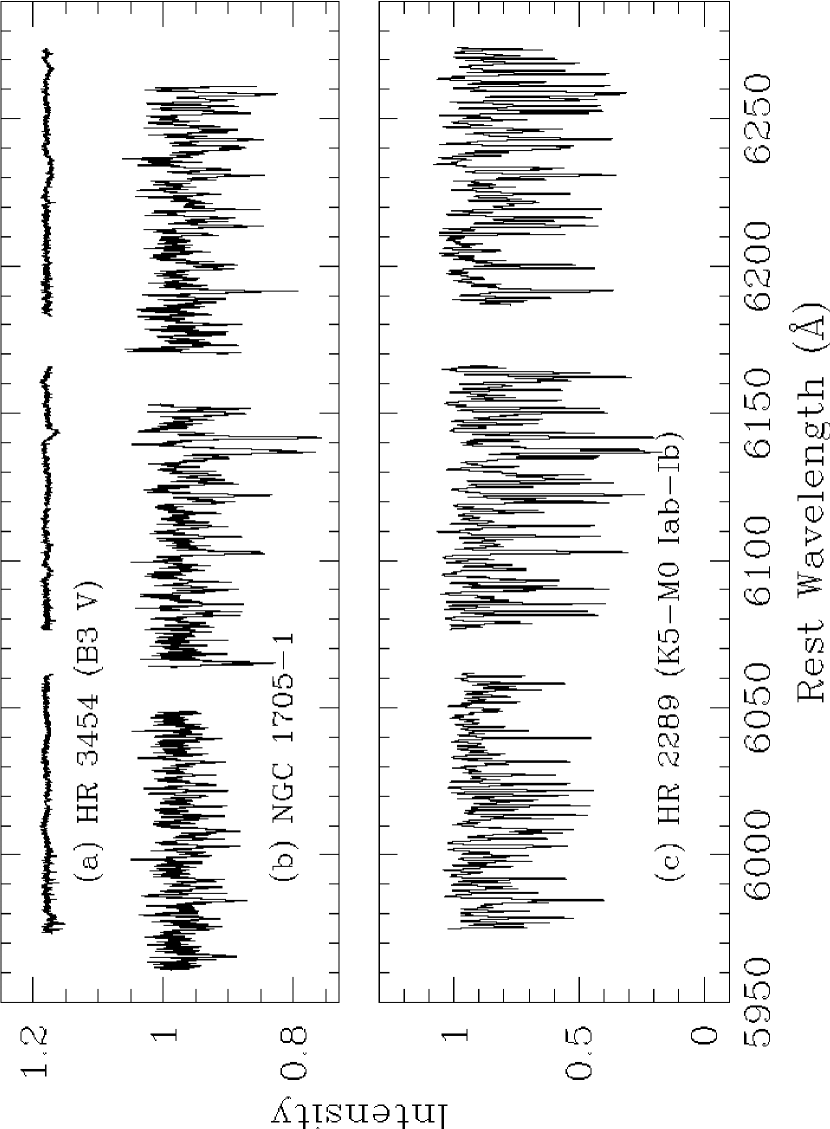
The composite nature of the NGC 1705-1 spectrum also becomes quite clear in our high-dispersion data. The short-wavelength orders, despite having very low counts as a result of light losses caused by atmospheric dispersion (§ 2), show extremely broad Balmer and He I absorption lines arising from B-type main sequence stars, as discussed by Melnick et al. (1985a). By contrast, a plethora of weak metal and molecular lines litter the spectrum at wavelengths longward of 4800 Å; a few representative orders are shown in Figure 1. Figures 2 and 3 display several additional orders of the cluster spectrum, juxtaposing it with the spectrum of a B3 V star (HR 3454) and a K5–M0 Iab-Ib star (HR 2289, or 46 Aur). The B dwarf is essentially featureless at these wavelengths, while the red supergiant matches the cluster spectrum very closely. The most obvious difference with the red supergiant spectrum is that the equivalent widths of the absorption lines in the cluster are much smaller, as would be expected from dilution by the continuum of the hotter stars.
The weakness of the absorption lines in the spectrum of NGC 1705-1 might give concern that the features attributed to the cluster may be an artifact of imperfect background subtraction. Such an error could occur, for instance, if there is a strong gradient in the intensity of the underlying light and/or the stellar population, so that the “sky” spectrum subtracted from the “object” spectrum is a poor representation of the background within the extraction aperture. This, however, is unlikely to be a serious effect in the present case. First, the region chosen to represent the background is located 2′′ away from the cluster (§ 2), which corresponds to just 50 pc at a distance of 5 Mpc (O’Connell et al. 1994); neither the luminosity distribution nor the stellar population should change significantly on such a small scale. Second, the background level within the extraction aperture is on average about 3 times fainter than the cluster itself, and the equivalent widths of the absorption lines in the background spectrum are even smaller than those of the cluster spectrum (bottom of Fig. 4)222For completeness, we also illustrate the background spectrum of NGC 1569-A (top of Fig. 4), which was not included in Paper I..
3.2 Velocity Dispersion and Dynamical Mass of NGC 1705-1
It is not our immediate goal to study in quantitative terms the stellar content of NGC 1705-1; rather, we merely wish to establish the feasibility of measuring the velocity dispersion given its probable composition. In the past, standard techniques for calculating velocity dispersions from spatially integrated spectra have been applied almost exclusively to relatively old ( 1 Gyr) stellar systems, where red giants can generally serve as velocity templates. The integrated visual light of a stellar population as young as 10–20 Myr, on the other hand, arises from a combination of hot main-sequence stars and supergiants of both high and low effective temperatures (§ 3.1). As we argued in relation to NGC 1569-A (Paper I), it is still possible to obtain velocity dispersions so long as one restricts the analysis to portions of the spectrum whose metal absorption lines originate from cool supergiants. The absorption lines from main-sequence stars and hot supergiants cannot be used to measure velocity dispersions because their line profiles are substantially broadened by a variety of mechanisms (pressure, rotation, microturbulence, macroturbulence). Although the atmospheres of cool supergiants are still affected by a non-negligible amount of macroturbulence, it appears that their intrinsic line widths () have a fairly small spread (1.5 km s-1) about a mean of 9 km s-1 and rarely exceed 10 km s-1 (for types F5–K5; Gray & Toner 1987). In principle, therefore, it should be possible to use cool supergiant stars as templates to recover velocity dispersions that are larger than the spread of intrinsic widths.
As in Paper I, we measured the velocity dispersion of NGC 1705-1 using the cross-correlation technique of Tonry & Davis (1979), as implemented in the Smithsonian Astrophysical Observatory’s version of the IRAF333IRAF is distributed by the National Optical Astronomy Observatories, which are operated by the Association of Universities for Research in Astronomy, Inc., under cooperative agreement with the National Science Foundation. task XCOR. The Tonry & Davis method assumes that the cluster spectrum can be represented as the convolution of a star spectrum (a template whose spectral type roughly matches the effective stellar population of the cluster) with a line-broadening function (taken to be a Gaussian) describing the line-of-sight velocity dispersion of the stars in the cluster. The cross-correlation function between the cluster and template spectrum peaks at the relative radial velocity of the two objects, and the width of the main velocity peak is related to the velocity dispersion of the cluster. The correspondence between the width of the peak and the actual velocity dispersion is determined empirically by artificially broadening the template spectra with Gaussians of various dispersions and subsequently remeasuring them using the cross-correlation algorithm.
We restricted our analysis to the region between 5000 and 6280 Å for three reasons: (1) it has the highest S/N, (2) it is unaffected by centering problems due to atmospheric dispersion (§ 2), and (3) the absorption lines come mainly from cool supergiants and are thus suitable for measuring velocity dispersions (see above). There are 14 echelle orders in this spectral region, and they were processed independently using 3 template stars: HR 3422 (G8 IV), HR 4517 (M1 III), and HR 2289 (K5–M0 Iab-Ib). Although the K5–M0 supergiant visually seems to provide an excellent match to NGC 1705-1 (Fig. 2 and 3), we tried the other two stars both as a consistency check and to evaluate the procedure adopted in Paper I for NGC 1569-A. In the case of NGC 1569-A, the cluster spectrum matches better with the G8 subgiant HR 3422 than it does with the K5–M0 supergiant, and the subgiant was used as the template; an a posteriori correction had to be applied to the cluster’s velocity dispersion to account for the broadening contribution due to supergiants.
Two of the orders are illustrated in Figure 5; the top panels show the NGC 1705-1 spectrum, the middle panels show the adopted K5–M0 supergiant template, and the resulting cross-correlation functions are given on the bottom. All 14 orders yielded consistent values for the radial velocity (with respect to the template stars) and velocity dispersion, but the three stars gave systematically different results that are worth noting. The velocity dispersion obtained from the K5–M0 supergiant, which we assume to be the most faithful representation of the actual stellar content of the cluster, is = 11.41.5 km s-1, where the uncertainty denotes the standard deviation of the 14 values about the mean. The corresponding results for the M1 III and G8 IV templates are = 14.31.9 and 14.71.9 km s-1, respectively; not surprisingly, they are larger than the dispersion derived using the supergiant, and by approximately the correct amount. For instance, cross correlating HR 2289 with HR 4517 reveals that the supergiant is broadened by 7.5 km s-1 with respect to the giant, which is roughly the difference (subtracted in quadrature) between the cluster dispersions obtained with the two stars. In the subsequent discussion, we will assume that NGC 1705-1 has a line-of-sight velocity dispersion of = 11.41.5 km s-1.
The conventional method of calculating dynamical masses of globular clusters (e.g., Illingworth 1976) makes use of parameters obtained from surface photometry and the core velocity dispersion. Unfortunately, detailed surface photometry of our distant clusters is not yet available, and so we resort to a cruder estimate of the mass using the virial theorem. For a spherically symmetric, gravitationally bound system of stars having equal masses and an isotropic velocity distribution [(total) = 3], the dynamical mass is given by , where is the effective gravitational radius. The condition of spherical symmetry probably holds, since NGC 1705-1 does not exhibit any obvious substructure and appears essentially pointlike (O’Connell et al. 1994). We take = , the half-light radius. In the context of other probable sources of uncertainties contained in our simplistic application of the virial theorem, the observationally straightforward half-light radius suffices for the present purposes. O’Connell et al. (1994) find 3.4 pc for NGC 1705-1, assuming a (poorly known) galaxy distance of 5 Mpc. Meurer et al. (1995) reexamined the HST images of O’Connell et al. using a different method of analysis, and they found a substantially smaller size of = 0.90.2 pc (adjusted to the distance adopted by O’Connell et al.). Using Meurer et al.’s revised size, we derive a mass of (8.22.1)104 M⊙ from the virial equation. The implied mass density of the cluster is 2.7104 M⊙ pc-3.
As discussed in Paper I, relaxing some of the assumptions made in our application of the virial equation most likely will increase the final mass. It would be completely inappropriate to apply the virial theorem, of course, if the cluster were not bound; nevertheless, it is difficult to imagine how this could be. Because of the small size of the cluster, any conceivable form of perturbation that might disperse the stars will traverse the cluster on a timescale shorter than 1 Myr, whereas the age of the cluster is much longer, on the order of 10–20 Myr. Although difficult to prove, a similar heuristic argument has been made by others (Whitmore et al. 1993; Whitmore & Schweizer 1995; Maoz et al. 1996). On the other hand, it is unlikely that such a young cluster, if it truly has a mass comparable to that of globular clusters, has had time to completely come to virial equilibrium. A typical globular cluster takes about 109 yr to relax dynamically (Binney & Tremaine 1987). Since the final velocity dispersion of a virialized cluster will be higher than its present value, our derived mass probably has been underestimated. The probable presence of mass segregation also potentially biases the velocity dispersion to lower values. Mass segregation for the more massive stars appears to have taken place even for a cluster as young as R136 (3–4 Myr; Hunter et al. 1996) in the center of 30 Doradus (Brandl et al. 1996; but see Hunter et al. 1996); thus, it seems plausible that older clusters such as NGC 1569-A and NGC 1705-1 should be similarly affected. The integrated spectrum predominantly samples the most luminous, massive stars; if mass segregation has set in, these stars will have sunk toward the center of the cluster, and their velocity dispersion will be lower than that of the entire system. The quoted mass for NGC 1705-1, therefore, can be regarded as a fairly safe lower limit, and the true mass can certainly be as high as 105 M⊙ or more. Not knowing the distance to NGC 1705 with better accuracy certainly propagates additional uncertainty into the mass estimate, but note that the physical size (computed from the angular size and the distance) only enters linearly into the virial equation.
Since our approach for estimating the dynamical mass is more primitive than the conventional method, it is worth considering how large an error we could have made. The compilation of Mandushev et al. (1991) conveniently tabulates globular cluster masses derived using Illingworth’s (1976) method, as well as core velocity dispersions and half-light radii. Given that the total (spatially integrated) velocity dispersion is not much smaller than the core velocity dispersion (Illingworth finds a difference of only a few percent between the two), we can compute the masses using our adopted formula and compare them to the values in Mandushev et al. We find that in general there is fairly close agreement between the masses obtained from the two methods. The discrepancies rarely exceed a factor of two, and this level of uncertainty does not change our overall conclusions.
Several previous studies have attempted to estimate the stellar mass in NGC 1705-1 using stellar population models. However, since most of the observed properties of the cluster sample only the massive stars, obtaining the total cluster mass using these models necessarily must extrapolate a poorly constrained stellar initial mass function (IMF) to lower, unobserved stellar masses. Masses obtained by such indirect, model-dependent methods are notoriously difficult to assess. The dynamical mass we have derived is in substantial disagreement with the mass given by Melnick et al. (1985a); even after accounting for the larger distance they adopted (8.7 Mpc), their quoted mass of 7106 M⊙ still exceeds ours by about a factor of 50. Similarly, Meurer et al. (1992) used a different set of models and derived = 1.5106 M⊙, close to the value of Melnick et al. after adjusting to a common distance (Meurer et al. assumed 4.7 Mpc). The most recent estimate comes from the HST UV imaging study of Meurer et al. (1995), who, from the luminosity at 2200 Å (assuming a distance of 6 Mpc), deduced = 2.5105 M⊙; this is in acceptable agreement with our dynamical measurement, especially considering that our value may be an underestimate.
3.3 The Spectrum of NGC 4214-1
The HIRES spectrum of NGC 4214-1 is dominated by a featureless continuum from hot stars on which are imprinted broad Balmer (H to H) and He I (4026, 4121, 4144, 4388, 4472, 4713, and 4922) absorption lines. Ca II H & K and Na I D absorption are present (Fig. 6a), but these lines arise from the interstellar medium of the Galaxy and of NGC 4214. Unfortunately, very few metal lines from stars are seen. The few that can be tentatively identified include a blend of Si IV 4088.9 and O II 4089.3, N III 4200, Mg II 4481, and a complex near 4650 Å possibly due to C II, C III, and O II. These lines probably come from a mixture of B dwarfs and supergiants (e.g., Kilian, Montenbruck, & Nissen 1991; Lennon, Dufton, & Fitzsimmons 1992), and cannot be used to determine velocity dispersions (§ 3.2). Given that the age of the cluster is only 4–5 Myr (Leitherer et al. 1996), the absence of stars of later spectral types is not surprising, if all the stars formed in a single burst.
The emission lines included in our extraction aperture show complex velocity structure (Fig. 6b). Nearly all the strong lines exhibit a double-peaked profile, with a very weak third peak visible in some cases. The radial velocity of the stronger of the two components agrees closely with the systemic velocity of the galaxy (291 km s-1; de Vaucouleurs et al. 1991), while the secondary peak is redshifted by approximately 75–80 km s-1. Both components have broad, extended bases and cannot be fitted adequately with a single Gaussian function. The H line, in particular, contains obvious broad wings with a full width near zero intensity (FWZI) of 760 km s-1;444Sargent & Filippenko (1991) and Marlowe et al. (1995) also noted the presence of broad H in NGC 4214; Marlowe et al. estimated FWZI 600 km s-1.similarly, He I 5876 (Fig. 6a) has broad wings with FWZI 600 km s-1.
4 Implications for the Formation of Globular Clusters
The large mass and mass density of NGC 1705-1 lend credence to the popular idea that some compact, luminous, young clusters may be recently formed globular clusters. The total stellar mass of NGC 1705-1 (8.2104 M⊙) coincides with the median mass of evolved, Galactic globular clusters (8.1104 M⊙; Mandushev et al. 1991). The cluster half-light radius (0.9 pc), if anything, is even smaller than that of typical globular clusters; the median = 2.6 and 4.1 pc in the samples of van den Bergh, Morbey, & Pazder (1991) and Mandushev et al. (1991), respectively. Dynamical evolution of the cluster will cause it to expand slightly as it ages (Elson 1992), however, and the final cluster radius may turn out to be normal. O’Connell et al. (1994) determined an integrated absolute visual magnitude of –14.0 for NGC 1705-1. Since a 10–20 Myr old cluster is expected to dim by 6 to 7 mag in the band after 10–15 Gyr (e.g., Bruzual & Charlot 1993), NGC 1705-1 will fade to –7 to –8 mag in its maturity, in excellent agreement with the peak of the nearly universal luminosity function of globular cluster systems ( –7.3 mag; Harris 1991). Moreover, if mass loss during advanced stages of stellar evolution does not significantly reduce the mass of the cluster, NGC 1705-1 will attain a mass-to-light ratio of 0.7–1.6 ()⊙, again fully consistent with the observed, narrow range for Galactic globular clusters [0.7–2.9 ()⊙; Mandushev et al. 1991].
The properties of NGC 1705-1 agree remarkably well with those of NGC 1569-A (see Table 1). NGC 1569-A has a comparable age (10–20 Myr), is just as luminous ( = –14.1 mag), and is only slightly less compact ( = 1.9 pc). Ho & Filippenko (1996) measured a velocity dispersion of = 15.71.5 km s-1, from which they derived a cluster mass of (3.30.5)105 M⊙, a mass density of 1.1104 M⊙ pc-3, and a predicted mass-to-light ratio of 2.5–6.3 ()⊙ after 10–15 Gyr. Again, all of these properties strongly resemble those of the majority of evolved globular clusters in the Galaxy.
It would be premature to conclude that the above results apply to all of the compact, super star clusters discovered with HST; such an extrapolation, based on just two objects, would require a sizable leap of faith. Furthermore, the environments of the two clusters studied here are quite different from those of the other galaxies in which super star clusters have been found. Both NGC 1569 and NGC 1705 are amorphous galaxies (Sandage & Brucato 1979), distinguished by their relatively smooth, centrally-concentrated light distribution that resembles that of elliptical and S0 galaxies, while at the same time sharing many of the global characteristics (e.g., metallicity, average colors, star-formation rate) of Magellanic irregular galaxies (Gallagher & Hunter 1987). NGC 1569 has two luminous clusters, and NGC 1705 just one, both centrally located and far brighter than the other clusters known to be present in the same galaxies. Nevertheless, the mere fact that we are witnessing the recent birth of 105 solar masses of stars packed into a volume 3–30 pc3 is notable, and although the exact details of the formation of these young clusters may differ in some respects from those of globular clusters born during the era of galaxy formation, studying them should still prove to be illuminating. For instance, clusters such as NGC 1569-A and NGC 1705-1 evidently can form from an environment far more metal rich than that which produced the first generation of globular clusters: [O/H] = –0.6 for NGC 1569-A (Heckman et al. 1995), and [O/H] = –0.35 for NGC 1705-1 (Marlowe et al. 1995), whereas the metallicity distribution of globular clusters in the Galactic halo peaks at –1.6 (Armandroff & Zinn 1988). Models of globular cluster formation relying principally on the physical conditions of extremely metal-poor gas (e.g., Murray & Lin 1989, 1993; Richtler 1993) evidently do not apply to these young clusters. Perhaps they are more closely related to the population of metal-rich disk globular clusters, whose –0.5 (Armandroff & Zinn 1988).
In the spirit of the Searle & Zinn (1978) picture for the formation of the Galactic halo in which the halo is assembled from the merging of a number of protogalactic fragments, it has been suggested that the halo globular clusters perhaps represent the “nuclei” of accreted, stripped dwarf satellites (Zinnecker et al. 1988; Larson 1990, and references therein). Our finding that the central star clusters in NGC 1569 and NGC 1705 appear to be young globular clusters lends some observational support for this scenario.
As revealed by recent high-resolution observations from HST (see § 1 and additional references in Ho 1996), cluster formation appears to be a very common, if not the dominant, mode of star formation in a wide range of starburst environments. The brightest members of the cluster population in these systems closely resemble NGC 1569-A and NGC 1705-1 in terms of physical dimension and luminosity (and presumably mass). The inner few hundred parsecs of the famous starburst galaxy M82, for instance, harbor a swarm of over 100 such clusters (O’Connell et al. 1995), and undoubtedly many more remain hidden by dust from direct view. Super star clusters, therefore, may constitute the basic building blocks or “cells” of star formation in starbursts, and intensive observational dissection of clusters such as NGC 1569-A and NGC 1705-1 should prove to be a valuable tool for understanding the starburst phenomenon in general.
As an illustration of the potential application of these clusters, consider two simple examples. First, the apparent similarity between the stellar content of super star clusters and globular clusters, as implied by the mass-to-light ratios we deduced, may have important consequences for the IMF of starbursts. Since we have shown that at least some super star clusters seem to be genuine, young globular clusters, and the latter are known to contain many low-mass stars, the implication is that low-mass stars are also formed in starburst regions. In the well-known case of the center of M82, it has been suggested that the IMF is biased toward high-mass stars (Rieke et al. 1980, 1993). This result, while provocative, remains controversial (e.g., Scalo 1986, 1987; Zinnecker 1996), and determination of the dynamical masses for a larger sample of clusters may have a strong bearing on this issue.
Second, the existence of massive, bound star clusters puts some constraints on the physical state of the dense interstellar medium from which they formed. The efficiency of star formation (rate of conversion from gas to stars) in the disk of the Galaxy is fairly low; Myers et al. (1986) estimate it to be on the order of only a few percent, with large variations from region to region. For newly formed star clusters to be gravitationally bound, however, the efficiency of star formation must be much higher, perhaps 20%–50% (Hills 1980; Elmegreen 1983; Lada, Margulis, & Dearborn 1984). A sufficiently large amount of gas needs to be converted into stars in order for the cluster to acquire enough gravitational binding energy. If super star clusters typically attain masses of 105 M⊙, their progenitor molecular clouds must have masses ranging from 2105 to 5105 M⊙; considering the compactness of the clusters, the “protocluster cores” must also be fairly dense, denser than typical giant molecular clouds. Such a population of clouds may indeed be present in the starburst region of M82. Both Brouillet & Schilke (1993) and Shen & Lo (1995) have published mm-wave interferometric maps of the dense molecular gas tracer HCN, and they find a large number of massive clouds located in the central few hundred parsecs of the galaxy. The median cloud listed in Table 2 of Brouillet & Schilke, for example, has a radius of 50 pc and a mass of 106 M⊙. It is tempting to identify these massive, dense clouds as the progenitors of the super star clusters in M82.
5 Summary
Together with the results reported in Paper I, we have measured the stellar velocity dispersion of two luminous, compact star clusters (NGC 1569-A and NGC 1705-1) by analyzing high-dispersion optical spectra of their integrated light. The clusters are relatively young, with ages of 10–20 Myr. Both clusters were recently imaged with HST by O’Connell et al. (1994), and hence their sizes are known. If they are gravitationally bound, application of the virial theorem implies that the clusters in NGC 1569 and NGC 1705 have stellar masses of (3.30.5)105 and (8.22.1)104 M⊙, and mass densities of 1.1104 M⊙ pc-3 and 2.7104 M⊙ pc-3, respectively. The masses, mass densities, and the predicted mass-to-light ratios (after aging by 10–15 Gyr) of these objects are very similar to those of evolved globular clusters in the Galaxy. NGC 1569-A and NGC 1705-1, therefore, appear to be genuine, young globular clusters. Since the most luminous members in other cluster systems discovered with HST have photometric properties resembling those of the two clusters studied here, we suggest that they too may be similar in nature. The gas clouds from which the clusters formed must also have been very massive and compact, and we tentatively identify the dense molecular clouds recently found in the center of M82 as possible progenitors.
References
Armandroff, T. E., & Zinn, R. 1988, AJ, 96, 92
Arp, H., & Sandage, A. 1985, AJ, 90, 1163
Barth, A. J., Ho, L. C., Filippenko, A. V., Gorjian, V., Malkan, M., & Sargent, W. L. W. 1996, in IAU Colloq. 157, Barred Galaxies, ed. R. Buta, B. G. Elmegreen, & D. A. Crocker (San Francisco: ASP), 94
Barth, A. J., Ho, L. C., Filippenko, A. V., & Sargent, W. L. W. 1995, AJ, 110, 1009
Benedict, G. F., et al. 1993, AJ, 105, 1369
Binney, J., & Tremaine, S. 1987, Galactic Dynamics (Princeton: Princeton Univ. Press)
Brandl, B., Sams, B., Bertoldi, F., Eckart, A., Genzel, R., Drapatz, S., Hofmann, R., Loewe, M., & Quirrenbach, A. 1996, ApJ, in press
Brouillet, N., & Schilke, P. 1993, A&A, 277, 381
Bruzual A., G., & Charlot, S. 1993, ApJ, 405, 538
Charlot, S., & Bruzual A., G. 1991, ApJ, 367, 126
de Vaucouleurs, G., de Vaucouleurs, A., Corwin, H. G., Jr., Buta, R. J., Paturel, G., & Fouqué, R. 1991, Third Reference Catalogue of Bright Galaxies (New York: Springer)
Dubath, P., Mayor, M., & Meylan, G. 1993, in The Globular Cluster-Galaxy Connection, ed. G. H. Smith & J. P. Brodie (San Francisco: ASP), 557
Elmegreen, B. G. 1983, MNRAS, 203, 1011
Elson, R. A. W. 1992, MNRAS, 256, 515
Filippenko, A. V. 1982, PASP, 94, 71
Gallagher, J. S., & Hunter, D. A. 1987, AJ, 94, 43
Gray, D. F., & Toner, C. G. 1987, ApJ, 322, 360
Gunn, J. E., Griffin, R. F., Griffin, R. E. M., & Zimmerman, B. A. 1988, AJ, 96, 198
Harris, W. E. 1991, ARA&A, 29, 543
Heckman, T. M. 1996, private communication
Heckman, T. M., Dahlem, M., Lehnert, M. D., Fabbiano, G., Gilmore, D., & Waller, W. H. 1995, ApJ, 448, 98
Hills, J. G. 1980, ApJ, 225, 986
Ho, L. C. 1996, Rev. Mex. Astr. Astrofis., in press
Ho, L. C., & Filippenko, A. V. 1995, ApJ, 444, 165 (Erratum: 1996, ApJ, June 1 issue)
Ho, L. C., & Filippenko, A. V. 1996, ApJ, in press (Paper I)
Holtzman, J. A., et al. 1992, AJ, 103, 691
Horne, K. 1986, PASP, 98, 609
Hunter, D. A., O’Connell, R. W., & Gallagher, III, J. S. 1994, AJ, 108, 84
Hunter, D. A., O’Neil, E. J., Lynds, R., Shaya, E. J., Groth, E. J., & Holtzman, J. A. 1996, ApJ, 459, L27
Illingworth, G. 1976, ApJ, 204, 73
Kilian, J., Montenbruck, O., & Nissen, P. E. 1991, A&AS, 88, 101
Lada, C. J., Margulis, M., & Dearborn, D. 1984, ApJ, 285, 141
Lamb, S. A., Gallagher, J. S., Hjellming, M. S., & Hunter, D. A. 1985, ApJ, 291, 63
Larson, R. B. 1990, PASP, 102, 709
Leitherer, C., Vacca, W. D., Conti, P. S., Filippenko, A. V., Robert, C., & Sargent, W. L. W. 1996, ApJ, in press
Lennon, D. J., Dufton, P. L., & Fitzsimmons, A. 1992, A&AS, 94, 569
Leonard, P. J. T., & Merritt, D. 1989, ApJ, 339, 195
Lutz, D. 1991, A&A, 245, 31
Mandushev, G., Spassova, N., & Staneva, A. 1991, A&A, 252, 94
Maoz, D., Barth, A. J., Sternberg, A., Filippenko, A. V., Ho, L. C., Macchetto, F. D., Rix, H.-W., & Schneider, D. P. 1996, AJ, in press
Marlowe, A. T., Heckman, T. M., Wyse, R. F. G., & Schommer, R. 1995, ApJ, 438, 563
Mateo, M. 1993, in The Globular Cluster-Galaxy Connection, ed. G. H. Smith & J. P. Brodie (San Francisco: ASP), 387
Mathieu, R. D. 1984, ApJ, 284, 643
Melnick, J., Moles, M., & Terlevich, R. 1985a, A&A, 149, L24
Melnick, J., Terlevich, R., & Moles, M. 1985b, Rev. Mex. Astr. Astrofis., 11, 91
Meurer, G. R., Freeman, K. C., Dopita, M. A., & Cacciari, C. 1992, AJ, 103, 60
Meurer, G. R., Heckman, T. M., Leitherer, C., Kinney, A., Robert, C., & Garnett, D. R. 1995, AJ, 110, 2665
Murray, S. D., & Lin, D. N. C. 1989, ApJ, 339, 933
Murray, S. D., & Lin, D. N. C. 1993, in The Globular Cluster-Galaxy Connection, ed. G. H. Smith & J. P. Brodie (San Francisco: ASP), 738
Myers, P. C., Dame, T. M., Thaddeus, P., Cohen, R. S., Silverberg, R. F., Dwek, E., & Hauser, M. G. 1986, ApJ, 301, 398
O’Connell, R. W. 1996, private communication
O’Connell, R. W., Gallagher, J. S., & Hunter, D. A. 1994, ApJ, 433, 65
O’Connell, R. W., Gallagher, J. S., Hunter, D. A., & Colley, W. N. 1995, ApJ, 446, L1
O’Connell, R. W., & Mangano, J. J. 1978, ApJ, 221, 62
Oke, J. B., & Gunn, J. E. 1983, ApJ, 266, 713
Quillen, A. C., de Zeeuw, P. T., Phinney, E. S., & Phillips, T. G. 1992, ApJ, 391, 121
Richtler, T. 1993, in The Globular Cluster-Galaxy Connection, ed. G. H. Smith & J. P. Brodie (San Francisco: ASP), 375
Rieke, G. H., Lebofsky, M. J., Thompson, R. I., Low, F. J., & Tokunaga, A. T. 1980, ApJ, 238, 24
Rieke, G. H., Loken, K., Rieke, M. J., & Tamblyn, P. 1993, ApJ, 412, 99
Sandage, A. R., & Brucato, R. 1979, AJ, 84, 472
Sargent, W. L. W., & Filippenko, A. V. 1991, AJ, 102, 107
Scalo, J. M. 1986, Fundam. Cosm. Phys., 11, 1
Scalo, J. M. 1987, in Starbursts and Galaxy Evolution, ed. T. X. Thuan, T. Montmerle, & J. T. T. Van (Guf sur Yvette: Editions Frontiéres), 445
Searle, L., & Zinn, R. 1978, ApJ, 225, 357
Shen, J., & Lo, K.-Y. 1995, ApJ, 445, L99
Smith, G. H., & Brodie, J. P. (eds.) 1993, The Globular Cluster-Galaxy Connection (San Francisco: ASP)
Tonry, J., & Davis, M. 1979, AJ, 84, 1511
van den Bergh, S., Morbey, C., & Pazder, J. 1991, ApJ, 375, 594
Vogt, S. S. 1994, UCO/Lick Observatory Technical Report No. 67
Vogt, S. S., et al. 1994, Proc. SPIE, 2198, 362
Waller, W. H. 1991, ApJ, 370, 144
Whitmore, B. C., & Schweizer, F. 1995, AJ, 109, 960
Whitmore, B. C., Schweizer, F., Leitherer, C., Borne, K., & Robert, C. 1993, AJ, 106, 1354
York, D. G., Caulet, A., Rybski, P., Gallagher, J., Blades, J. C., Morton, D. C., & Wamsteker, W. 1990, ApJ, 351, 412
Zepf, S. E., Carter, D., Sharples, R. M., & Ashman, K. M. 1995, ApJ, 445, L19
Zinnecker, H. 1996, in The Interplay Between Massive Star Formation, the ISM and Galaxy Evolution, ed. D. Kunth et al. (Paris: Editions Frontiéres), in press
Zinnecker, H., Keable, C. J., Dunlop, J. S., Cannon, R. D., & Griffiths, W. K. 1988, in The Harlow-Shapley Symposium on Globular Cluster Systems in Galaxies, ed. J. E. Grindlay & A. G. D. Philip (Kluwer), 603
![[Uncaptioned image]](/html/astro-ph/9606031/assets/x1.png)
Figure Captions
Fig. 1. — Illustration of a portion of the HIRES spectrum of NGC 1705-1 (5100–5580 Å). The data were smoothed with a boxcar function of 3 pixels (6.4 km s-1) in order to slightly improve the S/N for the sake of presentation, and the continuum was normalized to unity. Numerous metal and molecular lines due to late-type stars are detected. Two regions in the top panel (denoted by horizontal lines) were corrupted by a cosmetic flaw on the CCD. The small gap in the spectrum in the middle and bottom panels occurs where the CCD was insufficiently large to entirely span an order.
Fig. 2. — Illustration of additional orders of the HIRES spectrum of NGC 1705-1 (5660–5970 Å). The cluster data (b) have been slightly smoothed (see Fig. 1). Shown for comparison in the same panel is the spectrum of the B3 V star HR 3454 (a), offset in the ordinate by an arbitrary amount for clarity. The narrow features in the last order are due to telluric absorption, and the incomplete broad absorption line is He I 5876. The template star, HR 2289 (K5–M0 Iab-Ib), is shown in the bottom panel (c). The two strongest absorption lines in the spectra shown of NGC 1705-1 and HR 2289 are Na I D 5890, 5896. Gaps in the spectrum occur where the CCD was insufficiently large to entirely span an order. The continuum level was normalized to unity and the wavelength scale shifted to the rest frame of the objects.
Fig. 3. — Illustration of additional orders of the HIRES spectrum of NGC 1705-1 (5950–6290 Å). Same as in Figure 2.
Fig. 4. — Comparison of a typical extraction of the cluster spectra with the corresponding background (“sky”) spectra. In the case of NGC 1569-A (top half) and NGC 1705-1 (bottom half), the background spectra were scaled by factors of 5.1 and 2.6, respectively. The continuum level of all the spectra were normalized to unity, and the individual spectra were lightly smoothed (see Fig. 1) and offset in the ordinate by an arbitrary amount for clarity. Note that the cluster spectra in this figure have lower S/N than those in others because only a single exposure is shown.
Fig. 5. — (a) Example of the cross-correlation technique applied to one of the orders (5330–5410 Å). The top panel shows the spectrum of NGC 1705-1 and the middle panel the template star HR 2289 (K5–M0 Iab-Ib), both normalized to unity and shifted to their rest frame. The cluster spectrum has been slightly smoothed (see Fig. 1). The bottom panel plots the cross-correlation function (CCF) between the cluster and the star. The width of the main velocity peak of the CCF is related to the velocity dispersion of the object. In this order, the S/N per pixel of the continuum in the cluster (before smoothing) ranges from 33 at the blue end to 55 at the red end. The corresponding values for the template star are S/N = 300 to 500. (b) Same as (a), but for another order (6065–6155 Å). The S/N is 38–53 for NGC 1705-1 and 450–700 for the template.
Fig. 6. — Sample spectra of NGC 4214-1. The spectra were lightly smoothed (see Fig. 1), shifted to the rest frame of the galaxy, and normalized so that the continuum level is unity. Portions of two orders from the optical setting are shown in (a). The top panel displays the Ca II H & K interstellar absorption lines arising from the Galaxy and from NGC 4214. The Ca II H line from NGC 4214 is partially contaminated by [Ne III] 3968 emission and H emission and absorption. The bottom panel shows the region containing the Na I D2 (5890) and D1 (5896) interstellar absorption lines; the components arising from the Galaxy and NGC 4214 are indicated. [Note that the apparently anomalous radial velocities of the Galactic components of the interstellar lines result from shifting the spectra to the rest frame of NGC 4214, whose systemic (heliocentric) velocity is assumed to be 291 km s-1 (de Vaucouleurs et al. 1991).] The double-peaked emission line is He I 5876, superposed on a broad base (FWZI 600 km s-1). Portions of some orders containing strong emission lines are plotted in (b); the spectra in the two left panels were taken with the optical setting, and the ones in the right panels with the NIR setting. All the lines contain at least two clear emission peaks. The slight depression in the continuum surrounding the H emission line is caused by H absorption. The H emission line has broad H wings with FWZI 760 km s-1.