The G Dwarf Problem Exists in Other Galaxies
Abstract
Stellar population models with abundance distributions determined from the analytic Simple model of chemical evolution fail to match observations of the nuclei of bulge-dominated galaxies in three respects. First, the spectral energy distribution in the mid-ultraviolet range exceeds observation by mag. Most of that excess is due to metal-poor main sequence stars. Second, the models do not reproduce metal-sensitive optical absorption features that arise mainly from red giant stars. Third, the strength of a Ca II index sensitive to hot stars does not jibe with the predicted number of A-type horizontal branch stars. The number of metal poor stars in galaxies is at least a factor of two less than predicted by the Simple model, exactly similar to the “G Dwarf problem” in the solar cylinder. Observations at larger radii in local group galaxies indicate that the paucity of metal poor stars applies globally, rather than only in the nuclei.
Because of the dominance of metal rich stars, primordial galaxies will have a plentiful dust supply early in their star formation history, and thus will probably have weak Ly emission, as is apparently observed. We confirm that early-type galaxies cannot have been formed exclusively from mergers of small all-stellar subsystems, a result already established by dynamical simulations. The constraint of peaked abundance distributions will limit future chemical evolution models. It will also make age estimates for the stellar populations in early type galaxies and bulges more secure.
1 Introduction
When forming a stellar system out of gas, supernovae explosions, planetary nebulae, and quieter mass-loss enrich the remaining gas so that succeeding generations of stars are more metal-rich than their ancestors. Uncomplicated analytic models are helpful for exploring the basics of the chemical evolution problem, and the most uncomplicated of them all is termed the “Simple” model, with capitalization intact (Schmidt (1963); Searle & Sargent (1972); Pagel & Patchett (1975); capitalization as preferred by Pagel, e.g. Pagel (1989)). The Simple model assumes (1) that the galaxy is represented by one zone, initially full of metal-free gas, eventually full of stars, (2) that it is a closed box with no inflow or outflow, (3) that enrichment occurs immediately upon forming new stars (the Instantaneous Recycling Approximation), and (4) that the stars produce a constant yield () of heavy elements returned to the interstellar medium. The metallicity of currently forming stars is set solely by the gas to total mass fraction by (Talbot & Arnett (1971); equation 16.15 in Cowley (1995)). In a completely stellar system, goes to zero, and the distribution of stellar metal abundances is set by the yield 111Although this formula gives at in practice this does not introduce a problem since the number of extreme-abundance stars involved is small..
Data from the solar vicinity has been compared to analytic models, and the Simple model in particular (cf. Rana (1991) and references therein). Even after correcting the purely local data to include stars at high in the solar cylinder, the Galactic data still displays a paucity of metal-poor stars compared to the Simple model (Rana (1991), Cowley (1995)). This is referred to as the “G Dwarf problem” after the unevolved tracer stars used for the abundance determinations. The G Dwarf problem can be alleviated in a variety of ways, including gas infall, gas outflow, prompt initial enrichment, consideration of a spatially inhomogeneous metal abundance pattern (Malinie et al. (1993)), or of a variable stellar yield. In addition, many modelers now consider many-zone models, many track individual elements (as opposed to one overall heavy-element enhancement), and many drop the Instantaneous Recycling Approximation (e.g. the models compared by Tosi (1996)).
In addition to the classical G dwarf problem, which is mostly considered to apply to stars in the [Fe/H] to range, there is “the flagrant scandal that we so rarely mention in public: where is the First Generation?” (King (1977)). Nearly primordial stars with very small metal content ([Fe/H] ) are difficult to find (Beers, Preston, & Schectman (1992)), and a good question is whether they are present in the numbers predicted by the Simple model.
Until recently, the solar vicinity was the only region in which chemical evolution models could be applied. The metal-poor dwarf spheroidals have small spreads in metallicity based on the width of the red giant branch (RGB) much like Galactic globulars, the vast majority of which are tightly constrained to a single metallicity throughout (Stetson (1992)). Rich (1988) observed 88 K giants in the Galactic bulge and derived a distribution of metal abundances that he compared with the Simple model. In 1988 the distribution appeared to match the Simple model fairly well, but subsequent recalibration of the metallicity scale (McWilliam & Rich (1994)) narrows the distribution somewhat by pushing the very metal rich stars back toward solar metallicity. Adjustments both for differences of RGB lifetime with [Fe/H] and for the fact that metal-rich K giants are underrepresented because they become M giants further narrow the abundance distribution. Recently, other galaxies have begun to be studied. A relatively deep HST color-magnitude diagram of individual stars at in local group elliptical M32 (Grillmair et al. (1996)) has been decomposed into a metallicity distribution that is significantly more peaked than the solar neighborhood, along with a field in the outer disk of M31 which shows a distribution almost as narrow. Rich, Mighell, & Neill (1996) have analysed HST images in the halo of M31, finding an unexpectedly metal-rich environment poor in metal-deficient stars compared to our own halo.
What about other places in the universe? For distant galaxies and dense regions like the nuclei of M31 and M32, integrated starlight gives the only clues to the chemical composition currently available. Here, we compare the integrated light of E/S0 galaxies and spiral galaxy bulges, thought to contain old ( Gyr) passively evolving stellar populations, with models, both empirical and theoretical. We show evidence for metallicity distributions in such systems that are more strongly peaked than the Simple model allows in §2, and discuss these findings in §3.
2 Mid-UV Spectrum and Optical Absorption Features
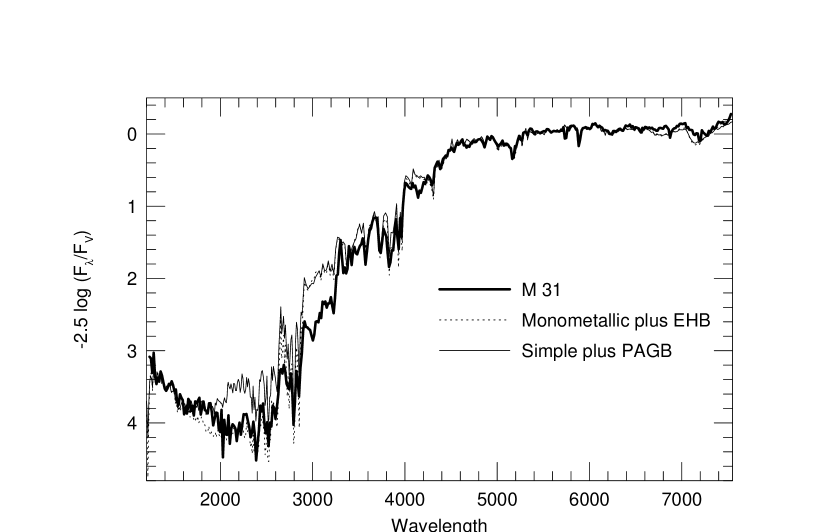
Bressan, Chiosi, & Fagotto (1994) and Chiosi (1996) have made population models of different metallicities and noted that the addition of substantial ( 10% by mass) portions of metal poor stars to an otherwise metal rich population causes a discrepancy between theory and observation in the ultraviolet spectrum. The problem is illustrated in Figure 1 for the nucleus of M31 using two different models, one with a single metallicity and one with a Simple model spread of metallicities. The Simple model spectrum shows a mismatch around 2100Å. There are two leading potential contributors to the flux in this region (Burstein et al. (1988); Dorman, O’Connell & Rood (1995); Dorman & O’Connell 1996a ): (a) the hotter horizontal branch (HB) stars that are often seen in Galactic globular clusters; and (b) the flux from the metal-poor main-sequence (MS) turnoffs, which affects the spectral energy distribution (SED) at progressively shorter wavelengths at lower metallicity. Metal-poor Galactic globular clusters often contain HB stars hotter than K in large numbers, and these emit copiously in the mid-UV. They would thus most likely be present if the composition distribution matched the Simple model prediction. However, the process by which the HB stars’ location on the HR diagram is determined (mass loss on the red-giant branch) is not at all understood, and thus conclusions arising from the assumed behavior of the HB morphology with metallicity or age are inherently unreliable. However, by subtracting the maximum expected contribution of hot HB star light from the models, we confirm that it is the MS turnoff light that is mostly responsible for the mismatch of the SED.
More quantitatively note that, in a 10-Gyr population with [Fe/H] and an entirely blue HB, the turnoff light contributes about 50% of the flux at 2500 Å (Dorman, O’Connell & Rood (1995); Dorman & O’Connell 1996b ). At this metallicity the main sequence contribution to the mid-UV flux is about 2 mag brighter than that of solar metallicity. An upper bound the effect of the blue HB can be derived from the case of a bimodal-metallicity population with metal-poor contribution similar to that of the Simple model. Using these rough estimates, and assuming the metal-poor component only produces blue HB stars, a population with 10% of the stars with [Fe/H] will have a blue HB contribution mag, whereas the discrepancy is mag. Estimates using the actual Simple model abundance distribution for a solar yield and the Worthey models confirm this: only about ⅓ of the 2500 Å flux is from blue HB stars, the rest from the MS turnoff.
Figure 1 shows the UV/Optical spectrum of M31 (D. Calzetti 1995, private communication), normalized to the band. The UV spectrum ( ) is from IUE (Burstein et al. (1988)), while the optical spectrum was taken with the IRS instrument at the Kitt Peak 0.9m (McQuade, Calzetti, & Kinney (1995)). The two models plotted are as follows: The dotted line represents a model of a single metallicity ([Fe/H] ), and age (12 Gyr), while the solid line is a Simple model, at age 17 Gyr and stellar yield . The model metallicity distribution was cut off above +0.5. Note that this model is at the red extreme of what the Worthey (1994) models are capable of producing. The difficulty of finding a model red enough is another (albeit weaker) argument that the Simple model distribution is not appropriate for real galaxies. This model has additional contribution from a very hot PAGB component fitted to the 1500Å continuum: we chose to add this type of hot component to supply the observed far-UV flux as it has the smallest possible contribution around 2500 Å. Both theoretical spectra match the observation throughout the optical, with stronger deviations toward the IR and UV. Some of this is undoubtedly due to inaccurate line opacity in spectral ranges not yet adequately charted. Both the single metallicity model and the Simple model fail in the spectral region , where the models appear too bright by mag. The reason for this discrepancy is unclear, but it also occurs in other galaxy spectra (see Dorman & O’Connell 1996a ). If it is astrophysical, rather than due to miscalibration of the IUE LWR spectra, then it may contain important information about either stellar populations or model stellar atmospheres. The other notable feature is in the range : the single-metallicity model is a fairly good match, but the multiple-metallicity model predicts mag too much flux. This factor of 1.7 is a minimum given the conservative assumptions of the spectral fit. Other reasonable models will have worse mismatches.
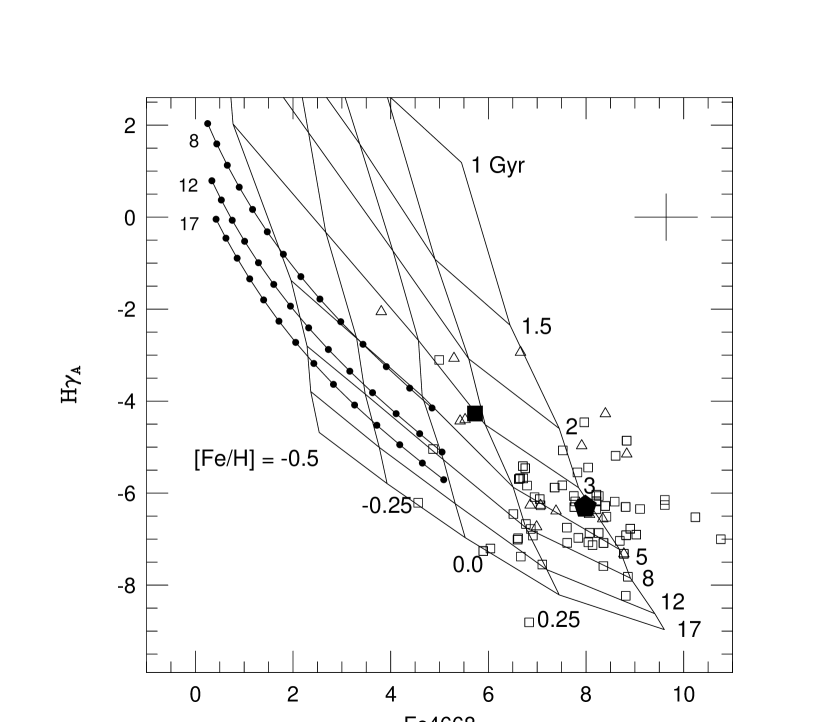
It was difficult to find a Simple model red enough to match M31’s spectrum in Figure 1. Attempting to match a metallic absorption feature that is particularly metallicity sensitive makes it impossible to fit such a model, no matter how old or metal-rich. Figure 2 shows the relatively age-sensitive H index against abundance-sensitive Fe4668 (Worthey et al. (1994); Jones & Worthey (1995)) for early-type galaxies, with single-metallicity models and multi-metallicity models that follow the Simple model abundance distribution for different yields. The Simple models lie at weak Fe4668, with yields running from at the weak end to with dots at 0.1 dex intervals. The galaxy line strengths are seen to be well in excess of those predicted by the Simple models, whereas the single-metallicity models (solid grid lines) are able more easily to reproduce the galaxies’ line indices with abundance assumptions closer to expectation. Shifting to a Simple model distribution adds a burden of +0.3 dex of extra metal enhancement that the stars must have in order to match the line strengths of single-metallicity models. To match the galaxies clustered at [Fe/H] , the yield would have to be (), and we doubt that this is astrophysical.
The difficulty applies equally to E and S0 galaxies that span the range in size and cluster/field environment, and to M31 as well. The result is independent of which index or index combination one chooses, as long as the more metal-sensitive features are used. The result is also independent of which sets of isochrones we use. The amount of metal-poor stars needs to be reduced by at least a factor of two from the Simple model amount in order for model metallic absorption features to match real galaxies, but a factor of two reduction still requires uncomfortably large metallicities (+0.5 to +0.7) for the bulk of the populations. A factor of 4 reduction in metal poor stars gives more reasonable metallicities, and is more consistent with the (Grillmair et al. (1996)) abundance distribution for M32.

Finally, Figure 3 shows three compact elliptical galaxies (velocity dispersion less than 100 km s-1) from Jones (1996) in a diagram diagnostic of A stars (Rose (1994)). There are no synthesis models in this diagram, but plausible “galaxies” are constructed by combining observed giant and dwarf stellar spectra at the appropriate metallicity. Hot stars lie at very low values of CaII, and the arrows attached to M32 show how the index shifts if small amounts of blue horizontal branch (BHB) light is subtracted. The vectors for the other galaxies are similar to those illustrated for M32. A Simple model with yield chosen to match the colors of these galaxies () predicts 11% by mass of the population is in stars of [Fe/H] = –1 or less; populations that should display BHBs if they are old. The implied fraction of light around 4000Å (via Worthey models) that should come from blue HB stars is about 6%. The observed metal-poor A star light is 2% for M32 and NGC 3605 and 3% for NGC 4489, about ⅓ to ½ that predicted by the Simple model. In a nutshell, the observed value of the Ca ii index in the galaxies is too large for them to contain as many blue HB stars as the Simple model implies.
3 Discussion
The previous section presented arguments for a stronger-peaked distribution for S0 and Elliptical galaxies of all sizes and environments and the central regions of spiral M31. Studies of individual stars in local group galaxies M31, M32, and the Milky Way can extend this result to large radii. Considering first the Galaxy, we are mainly interested in assessing if the whole Galaxy, integrated over every star, still fails to match the simple model. The reason for this peculiar viewpoint is that standard dynamical collapse models that include chemical evolution (e.g. Larson (1974)) predict that gas enriches as it collapses, so that metal poor stars are stored primarily at large radii, and the nuclei have high abundances with few metal poor stars present. Abundance gradients, more metal poor outwards, are a general feature of observed disks and spheroids. Is there enough metal-poor material in the outskirts of galaxies to approach the Simple model distribution if every star is included? For our Galaxy, apparently not. Looking at stars of low abundance, [Fe/H] , the solar neighborhood has virtually zero (Rana (1991); Pagel (1989)), and none have been found in the Bulge to date, either (Rich 1988). The halo at the solar radius has a plentiful supply (Ryan & Norris (1991)) but the metal-poor halo weighs only about (e.g. Freeman (1996)) compared to about for the total mass of stars in the Galaxy, and therefore, via the Ryan & Norris (1991) halo star abundance distribution, about 1% of the total mass in the Galaxy is composed of stars of [Fe/H] . This is compared to about 3% expected from the Simple model of solar yield.
Interestingly, we can perform a similar back-of-the-envelope calculation for stars between [Fe/H] and by normalizing the numbers of such very metal poor stars from Beers et al. (1992) to the Ryan & Norris (1991) distribution between [Fe/H] and . We arrive at the conclusion that the Galaxy ought to have about of very metal poor stars, as compared to about for the Simple model. This good agreement with a global solar-yield Simple model means that the number of extreme stars is in excess of the number predicted by the modified Simple model used in Ryan & Norris. We would suggest that further work on the abundance distribution of extremely metal poor stars might be extremely interesting.
The situation in M31 shows signs of being even more extreme than our own Galaxy in terms of lack of metal poor stars. An HST color-magnitude diagram in the outskirts of the disk of M31 (Grillmair et al. (1996)) shows an abundance distribution extremely similar to that of the solar neighborhood. The halo of M31 appears to have a preponderance of metal rich stars, some apparently as metal-rich as the sun, and few metal poor stars (Rich et al. 1996). In M32 there is as yet no information at very large radius, but at the the 65% light-enclosed radius (), the abundance distribution is significantly narrower than that of the solar neighborhood (Grillmair et al. (1996)).
We therefore conclude that, from small galaxies barely large enough to attain solar metallicity to gigantic elliptical galaxies, and from disks to spheroids regardless of field/cluster environment, and from the nuclei alone to consideration of every star in the galaxies there is no evidence for an abundance distribution as broad as the Simple model predicts. Despite the small number of observations we cite for spiral disks and bulges (two: ours and M31’s), it is quite likely that the G dwarf problem is universal; that nowhere in the universe does chemical enrichment produce as many metal-poor stars as predicted by the Simple model if the enrichment process proceeds to near-solar composition.
This sweeping statement should provide a basic constraint for galaxy evolution. Whatever processes are responsible for galaxy formation, by the time 2%–5% of the final mass was assembled into stars the 95%–98% reservoir of gas was already quite metal-rich. As galaxies assembled, the periods in which metal-poor stars provided the bulk of the stellar luminosity must have been very brief.
The universality of the G-dwarf problem may be important in predicting what primeval galaxies look like. Galaxies observed at high redshift will tend to be the largest ones, already well into the process of forming stars. Since the present-day abundance distribution is narrow, we would expect high metallicities early in the history of the galaxies, even if only a few percent of the eventual number of stars has formed. High metallicities would mean a ready supply of dust, which is now fingered as the likely cause of quenched Ly in nearby HII galaxies (Pritchet (1994)). High redshift () galaxies appear to be very similar to local ones (Steidel et al. (1996)) in terms of nearly zero Ly emission (this makes searching for primordial galaxies by looking for Ly emission seem unproductive.) A dust-free, metal-poor phase of galaxy formation as discussed in Pritchet (1994) would be considerably shorter than 30% of the star-formation timescale. Perhaps 5% would be a better first guess, as that is the upper limit on mass locked into metal-poor stars in present day galaxies.
About early-type galaxies we learn that they cannot have formed primarily from the merging of purely stellar satellite galaxies like dwarf spheroidals. If this were the case, they would have many more metal poor stars than they do. That pure-stellar mergers are unworkable is known from dynamical simulations (e.g. Villumsen (1983), Hernquist (1993)), which show that the merging of purely stellar galaxies results in a large, flat core that is dissimilar from real galaxies.
Beyond this, the narrower-than-Simple result will loosely constrain numerical models of elliptical formation that include chemical evolution (e.g. Arimoto & Yoshii (1987), Bressan et al. 1994, Gibson (1996), Matteucci & Tornambè (1987)) by eliminating those modeled abundance distributions that approach the breadth of the Simple model. Plenty of room for variation will still exist for these models.
The biggest benefit from knowing the basics of the metallicity distribution of stars in early-type galaxies may be that it helps to estimate ages for the component stellar populations. Figure 2 shows an age diagnostic diagram in which the metallicity shifts are dramatic depending on the breadth of the metallicity distribution, but the age shifts are fairly mild. Knowing the approximate sharpness of the abundance spread will make age estimates more secure in the future.
Why does the Simple model fail universally? The simplest explanation would be that chemical enrichment is predestined to happen extremely rapidly. In the context of the Simple model, the assumption to drop is the one of constant stellar yield because on large spatial scales, considering every member star, galaxies are closed boxes and major net infall or outflow cannot be invoked. The first idea for rapid enrichment that comes to mind is that the IMF of metal-poor stars was heavily skewed toward stars more massive than 1 so that little mass was locked into unevolving stars and most of the enriched gas remained available for future star formation. There is a theoretical argument based on expected gas temperature suggesting that this could be the case (e.g. Adams & Fatuzzo (1996)). Since few low-mass stars were formed, unevolved tracers would be rare. The alternative explanation, that the metal-poor stars are present but are stored at large radii, seems ruled out in our Galaxy and M31, but more work is needed to be certain.
References
- Adams & Fatuzzo (1996) Adams, F. C., & Fatuzzo, M. 1996, ApJ, in press, June 10, volume 464
- Arimoto & Yoshii (1987) Arimoto, N. & Yoshii, Y. 1987, A&A, 173, 23
- Beers, Preston, & Schectman (1992) Beers, T. C., Preston, G. W., & Shectman, S. A. 1992, AJ, 103, 1987
- Bressan, Chiosi, & Fagotto (1994) Bressan, A., Chiosi, C. & Fagotto, F. 1994, ApJS, 94, 63
- Burstein et al. (1988) Burstein, D., Bertola, F., Buson, L., Faber, S. M., & Lauer, T. 1988, ApJ, 328, 440.
- Chiosi (1996) Chiosi, C. 1996, in ¿From Stars to Galaxies: The Impact of Stellar Physics on Galaxy Evolution, ed. C. Leitherer, U. Fritze-von Alvensleben, & J. Huchra, ASP Conf. Series, 98, 105
- Cowley (1995) Cowley, C. R. 1995, An Introduction to Cosmochemistry, (Cambridge Univ. Press: Cambridge)
- Dorman, O’Connell & Rood (1995) Dorman, B., O’Connell, R. W., & Rood, R. T. 1995, ApJ, 442, 105
- (9) Dorman, B. & O’Connell, R. W. 1996a in ¿From Stars to Galaxies: The Impact of Stellar Physics on Galaxy Evolution, ed. C. Leitherer, U. Fritze-von Alvensleben, & J. Huchra, ASP Conf. Series, 98, 105
- (10) Dorman, B. & O’Connell R. W. 1996b, in preparation
- Dorman, Rood, & O’Connell (1993) Dorman, B., Rood, R. T., & O’Connell, R. W. 1993, ApJ, 419, 596
- Freeman (1996) Freeman, K. C. 1996, in New Light on Galaxy Evolution, IAU 171, ed. R. Bender & R. L. Davies, (Dordrecht:Kluwer), 3
- Gibson (1996) Gibson, B. K. 1996, MNRAS, submitted
- Grillmair et al. (1996) Grillmair, C. J., Lauer, T. R., Worthey, G., Faber, S. M., Freedman, W. L., Madore, B. F., Ajhar, E. A., Baum, W. A., Holtzman, J. A., Lynds, C. R., O’Neill, E. J., & Stetson, P. B. 1996, AJ, in preparation
- Hernquist (1993) Hernquist, L. 1993, ApJ, 409, 548
- Jones (1996) Jones, L. A. 1996, Ph. D. Thesis, Univ. of North Carolina
- Jones & Worthey (1995) Jones, L. A. & Worthey, G. 1995, ApJ, 446, L31
- King (1977) King, I. R. 1977, in The Evolution of Galaxies and Stellar Populations, ed. B. M. Tinsley & R. B. Larson, (Yale Univ. Obs.: New Haven), 1
- Larson (1974) Larson, R. B. 1974, MNRAS, 166, 585
- Malinie et al. (1993) Malinie, G., Hartmann, D. H., Clayton, D. D., & Mathews, G. J. 1993, ApJ, 413, 633
- Matteucci & Tornambè (1987) Matteucci, F., & Tornambè, A. 1987, A&A, 185, 51
- McQuade, Calzetti, & Kinney (1995) McQuade, K., Calzetti, D., & Kinney, A. L. 1995, ApJS, 97, 331
- McWilliam & Rich (1994) McWilliam, A., & Rich, R. M. 1994, ApJS, 91, 749
- Pagel & Patchett (1975) Pagel, B. E. J., & Patchett, B. E. 1975, MNRAS, 172, 13
- Pagel (1989) Pagel, B. E. J. 1989, in Evolutionary Phenomena in Galaxies, eds. J. E. Beckman & B. E. J. Pagel, (Cambridge Univ. Press: Cambridge), 201
- Pritchet (1994) Pritchet, C. J. 1994, PASP, 106, 1052
- Rana (1991) Rana, N. C. 1991, ARAA, 29, 129
- Rich (1988) Rich, R. M. 1988, AJ, 95, 828
- Rich, Mighell, & Neill (1996) Rich, R. M., Mighell, K. J., Neill, J. D. 1996, in Formation of the Galactic Halo: Inside and Out, ed. H. Morrison & A. Sarajedini, ASP Conf. Series, 92, 544
- Rose (1994) Rose, J.A. 1994, AJ, 107, 206
- Ryan & Norris (1991) Ryan, S. G., & Norris, J. E. 1991, AJ, 101, 1865
- Schmidt (1963) Schmidt, M. 1963, ApJ, 137, 758
- Schönberner (1983) Schönberner, D. 1983, ApJ, 272, 708
- Searle & Sargent (1972) Searle, L., & Sargent, W. L. W. 1972, ApJ, 173, 25
- Steidel et al. (1996) Steidel, C. C., Giavalisco, M., Pettini, M., Dickinson, M., & Adelberger, K. L. 1996, ApJ, 462, L17
- Stetson (1992) Stetson, P. B. 1992 in The Globular Cluster-Galaxy Connection ed. J. P. Brodie & G. H. Smith (San Francisco: ASP), 14
- Talbot & Arnett (1971) Talbot, R. J., & Arnett, W. D. 1971, ApJ, 170, 409
- Tosi (1996) Tosi, M. 1996, in ¿From Stars to Galaxies: The Impact of Stellar Physics on Galaxy Evolution, ed. C. Leitherer, U. Fritze-von Alvensleben, & J. Huchra, ASP Conf. Series, 98, 299
- Trager et al. (1996) Trager, S. C., Worthey, G., Faber, S. M., González, J. J., & Burstein, D. 1996, ApJS, in preparation
- Villumsen (1983) Villumsen, J. V. 1983, MNRAS, 204, 219
- Worthey (1994) Worthey, G. 1994, ApJS, 95, 107
- Worthey et al. (1994) Worthey, G., Faber, S.M., González, J.J., and Burstein, D. 1994, ApJS, 94, 687