Identification of a Gravitationally Lensed z=2.515 Star-Forming Galaxy ††thanks: Based on observations obtained on the William Herschel Telescope at the Observatorio del Roque de los Muchachos, La Palma.
Abstract
We discuss the optical spectrum of a multiply-imaged arc resolved by HST in the =0.175 cluster A2218. The spectrum, obtained with LDSS-2 on the 4.2m William Herschel telescope, reveals the source to be a galaxy at a redshift =2.515 in excellent agreement with the value predicted by Kneib et al. (1996) on the basis of their inversion of a highly-constrained mass model for the lensing cluster. The source is extremely blue in its optical-infrared colours, consistent with active star formation, and the spectrum reveals absorption lines characteristic of a young stellar population. Of particular significance is the absence of Lyman- emission but the presence of a broad Lyman- absorption. The spectrum is similar to that of other, much fainter, galaxies found at high redshift by various techniques and illustrates the important role that lensing can play in detailed studies of the properties of distant galaxies.
keywords:
cosmology: observations – galaxies: evolution – gravitational lensing1 Introduction
Considerable progress has been made recently from systematic redshift surveys of faint galaxies in understanding the evolutionary properties of galaxies out to redshifts z1. (Colless 1995, Lilly et al., 1996, Ellis et al.,1996). Beyond this strategic barrier, a variety of new techniques promise to extend our understanding to higher redshift. Cowie et al. (1995) have extended the direct spectroscopic approach for -limited samples to 1.6 and shown a number have sufficiently strong star formation to account for a high fraction of the present-day stellar density. A drawback of this approach, as a way of finding representative distant galaxies is that only a minority of a magnitude-limited sample, even at the faint limits now reachable with 10-m class telescopes, lie beyond 1. Presumably even fainter surveys would be required to uncover significant numbers of 2 galaxies. Although systematic, this method may not be the most efficient way to locate high redshift galaxies.
In contrast, Steidel et al. (1996) have shown that very high redshift sources can be effectively isolated from multiband photometry using the the Lyman limit as a discriminator. However, the Lyman limit (=912 Å ) only becomes amenable to optical detection at redshifts 2.8 and thus, although undoubtedly a very powerful technique, any comparison of such a distant sample with one similarly selected at a lower redshift will remain an observational challenge for the UV capabilities of HST (e.g. Conti et al 1995). Finally, one must consider the searches for damped Lyman- absorbers (e.g. Wolfe et al. 1995.) The main disadvantage here is contamination of the spectrum by the QSO light which inevitably hampers detailed investigation of the absorbing galaxy. Secondly, one has to contend with an uneven selection function in redshift produced by the varying detectability of the absorption.
In this article we illustrate the important role that gravitational lensing can play in selecting distant galaxies over a large redshift range, spanning those covered by the methods discussed above. The principal advantage of lensing in this context is, of course, the boosting of the apparent magnitude of the faint galaxy. Early work in this direction was begun by Smail et al. (1993) who discussed the photometric properties of giant arcs of known redshift in the context of various evolutionary models. The unlensed magnitudes of the arcs in their sample are estimated to be fainter than the galaxies studied in the deepest current conventional 10m samples (e.g. Cowie et al. 1995) . Although it is well known that lensing conserves surface brightness, parts of the source smaller than the seeing disk do undergo a real surface brightness gain (see Ebbels et al. 1996b). Although this may not be as large as the formal lensing magnification, the spectroscopic gain in depth can be significant. Additionally, the spatial magnification enables distant sources to be resolved into their individual components using HST (Smail et al. 1996).
The data from HST has enabled the construction of very precise mass models for selected lensing clusters. A good example is the recent analysis of Abell 2218 () where the ground-based mass model of Kneib et al (1995) was confirmed in exquisite detail from as many as 7 multiply-imaged sources resolved by HST in a 3-orbit exposure (Kneib et. al. 1996, KESCS). The highly-constrained mass model allowed KESCS to invert the lensing equations and predict redshifts for individual arclets readily recognised in the HST images. A number of the arclets were predicted to have redshifts and, as a way of isolating high redshift sources, the technique will become more effective as higher redshift lenses are employed. As the inversion is a purely geometric technique, selection effects are less troublesome than with the alternative approaches. Some of the difficulties inherent in the optical detection of lensed galaxies are discussed in KESCS. Clearly it is important to verify the lensing inversion, where possible, and in this article we illustrate the potential of the method via the spectrum of a spectacular multiply-imaged arc in Abell 2218 (#384 in the numbering scheme of Le Borgne et al, 1992.) The large magnification (almost 3 magnitudes for this image) allows us to obtain the spectrum of a normal galaxy at high redshift. The redshift obtained, , is in very good agreement with that predicted by the lensing model of KESCS.
A plan of the paper follows. In §2 we present the spectroscopic observations that lead to the redshift determination and discuss its implications with respect to the inversion method discussed by KESCS. In §3 we discuss the broad-band photometric properties of the distant galaxy and estimate the ongoing star formation rate and rest-frame luminosities. In §4 we return to the spectrum and interpret the various features in the context of the photometric data and UV spectra of nearby galaxies and recent spectra of high redshift sources. §5 summarises the main conclusions of the paper.
2 Spectroscopic Observations and Redshift Determination
As part of a major effort to verify the lensing inversion method for Abell 2218 discussed by KESCS, we have secured spectra for a large sample of faint arclets using the LDSS-2 multi-slit spectrograph at the William Hershell Telescope (WHT). A more complete description of these observations will be presented elsewhere (Ebbels et al., 1996b). The arclets were selected to be those with lensed magnitudes 25 for which the inversion gave estimated redshifts 0.4. Although a colour selection was imposed to increase the chance of detecting [O II] emission in the spectral window of LDSS-2, this is immaterial in the present discussion.
The observations were conducted on the nights of May 28 to June 1 1995. LDSS-2 was used in a conventional multi-slit mode with masks constructed with straight slits of width 1.5 arcsec configured in two orientations. The TEK-1 CCD was used (0.59 arcsec pixel-1) and in the case of this arc, a total exposure of 29.9ksec was obtained with the medium blue grism, (5.3 pixel-1, ) in conditions with seeing 1-2 arcsec FWHM. This grism allows us to survey the range where Lyman- was predicted to lie for arc #384 by Pelló et al. (1992) and Kneib et al. (1995). (3700-5300 Å . This range was not obtained in Pelló et al.’s FOS spectrum.)
Standard data reduction was performed with the LEXT package (Colless et al. 1990, Allington-Smith et al. 1994). After debiasing, the data were median combined, allowing for flexure effects of 1 pixel which affect the long exposures of a single field. Dispersed tungsten flat fields were used to correct for variations in transmission along the slit, while wavelength calibration was achieved using a CuAr arc. In extracting the faint spectra, the light profile along the slit was used to fit the remaining background variations and isolate the object. Residual column to column deviations from this fit were removed linearly and the object rows summed with a gaussian weighting to form an optimally-extracted spectrum. Finally the spectra were approximately flux callibrated using the standard LDSS-2 throughput curves.
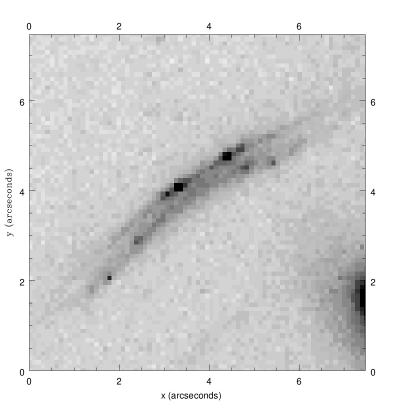
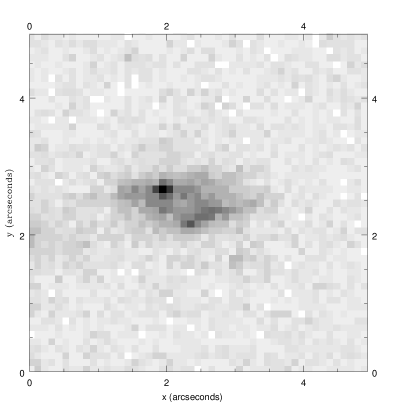
The arc in question, #384 (Figure 1(top)) in the photometric catalogue of Le Borgne et al. (1992), is one of the most spectacular in appearance in the HST image presented by KESCS. The mirror symmetry apparent in the WFPC-2 data verifies the earlier suggestion (Kneib et al. 1995) that the arc represents the merging of two images across a critical line whose location can now be precisely determined. The mass model discussed by KESCS, which is highly constrained by 6 further multiply-imaged features, strengthens the prediction (Kneib et al. 1995) of a counter-image to #384 on the other side of the central cD (object #468, Figure 1(bottom))
The location and orientations of the two images allowed KESCS to predict the inverted redshift and magnification of the source to reasonably high precision. Indeed, the redshift of #384 represents a crucial constraint because of the arc’s proximity to the critical line. On the basis of the mass model developed, the source is predicted to lie within the range , the uncertainty arising from the detail of the mass model, once constraints of the the other multiply imaged systems in the cluster are considered. This prediction agrees well with that made from broad band photometry and 5300-9000 low resolution spectroscopy, of 2.63.6 by Pelló et al. (1992).
The new redshift, when included in the model, does little to change the predicted magnification of each image (2.90.3 in the case of the of the combined #384 images and 1.50.1 in the case of #468. The larger error for #384 results from its proximity to the critical line, and thus increased sensitivity to its exact position and the slope of the mass profile (see KESCS). In calculating the properties of the unlensed source, we use the more reliable magnification of #468.) This leads to an unlensed magnitude for #384/#468 of 24.10.2. As KESCS point out, #384 comprises two images of a source which itself appears to consist of two parallel components. #468 has the same distinctive parallel morphology, albeit less distorted by the gravitational shear. Since the source lies so close to a caustic in the source plane, any bright parts of it lying outside this caustic would be imaged only in #468. The absence of any such extra bright knots in #468 leads us to conclude that all high surface brightness parts of the source lie inside the caustic line.
The LDSS-2 spectrum for #384 is shown in Figure 2 and has a very satisfactory signal/noise. Although the integrated photometry indicates =21.2, the mean surface brightness is only =23.4 (7 per cent of the La Palma night sky). Thus the observation represents a considerable challenge. The spectrum shows a number of strong ultraviolet features consistent with a redshift =2.515, close to the predicted value. Most noticeable is the prominent feature at 4250 Å which arises from strong Lyman- absorption. No emission lines are seen in the optical spectrum. With our new data, we find that multiple image hypothesis is reinforced by comparing the spectra of all three images. The two halves of #384 show no difference in spectral features, while the spectrum of #468 (figure 3), although noisy, is certainly compatible with that of #384. We return to a detailed discussion of the spectral features in the next section.


The verification of the inverted redshift, to within the estimated precision, illustrates the power of the lensing technique for isolating high redshift galaxies as well as for determining the statistical redshift distribution of very faint sources. It also shows that the mass model for the cluster core is very well determined, and in fact, further constrains it. The implications of the comparison of the lensing predicted redshifts and spectroscopically determined ones will be presented in Ebbels et al. (1996b), where the spectroscopic results from all the arclets secured in the WHT run are collated and analysed.
3 Photometric Properties
| # | U | B | g | V | R | r | i | z | J | K’ | |
|---|---|---|---|---|---|---|---|---|---|---|---|
| 384 | 23.4 | 22.2 | 22.2 | 22.1 | 21.4 | 21.2 | 21.6 | 20.6 | 21.5 | 20.0 | 17. 9 |
| 468 | 23.5 | 23.8 | 23.8 | 23.6 | 23.1 | 22.6 | 23.1 | 22.3 | 22.9 | 20.9 | 19. 1 |
| 1.6 | 1.6 | 1.5 | 1.7 | 1.4 | 1.5 | 1.7 | 1.4 | 0.9 | 1.2 |
Although there are now several examples of non-active galaxies with redshifts above 2, most can only be seen by virtue of their abnormal luminosities. The significant boosting of the source responsible for the arcs #384+#468, together with the serendipitous way in which background galaxies are lensed makes lensing a useful probe of normal galaxies at hitherto unexplored epochs, particularly if, as seems clear, further examples can be found in this way. We now illustrate, using this source as an example, what can be learnt from the photometric and spectroscopic properties of lensed high redshift galaxies.
Multiband photometry from U to K’ is presented for both #384 and #468 in Table 1 where the revised magnification is also given. The most reliable method to estimate the source luminosity is to use the infrared photometry to estimate the rest-frame optical luminosity. This is most suitably done with the or photometry which can yield the rest-frame or luminosity to reasonable precision. As maps closely onto , it can be seen from table 1 that the galaxy is intrinsically very blue, corresponding to a flat-spectrum source. To obtain the intrinsic luminosity of the source, a colour correction from or to is required and this yields =-22.2 (-23.0) 0.5 corresponding to a galaxy 8-20 (16-40) for =0.5 (0.1). (Loveday et al, 1992.) However, the blue magnitude is much influenced by star formation and, given its blue colours (=2.1), it is possible that the rest frame K luminosity of our galaxy could be closer to than suggested by the above value.
The spectral energy distribution (SED) delineated by the broad-band photometry is plotted in Figure 4 where we compare it to a synthetic spectrum produced by Bruzual & Charlot’s (1993) code and to the smoothed SED of a nearby star forming galaxy, NGC 4449 (Ellis 1984). These both show the SED to be consistant with that of an actively star forming galaxy. Although the best model fit obtained was that of a burst (of age , no reddening), other models (including those with constant star formation) can also reproduce the gross features of the photometry, particularly given the freedom to invoke reddening, which has sizable effects at UV wavelengths (the exact nature of which is little known at these redshifts). At this redshift, the Lyman limit only just reaches the edge of the U band. Thus the drop in the photometry, although influenced by the Lyman break, cannot easily be compared with the (-) cut from Steidel et al. (1996). Following Steidel et al, the UV flux can be used to derive an approximate ongoing star formation rate. In the case of a Salpeter initial mass function, (slope =2.35, with ), this amounts to 7-11 (15-24) for =0.5 (0.1), which is similar to the range seen in the Steidel sample and comparable to that in NGC 4449 when allowance for luminosity differences is made (. (Thronson, 1987))
As only the HST has the spatial resolution to adequately detect internal structures, and the WFPC-2 data is only available in a single band (F702W), no colour variations along arc #384 can be seen. However, the presence of ‘knots’ in Fig. 1 is suggestive of luminous HII regions consistent with a galaxy undergoing strong star formation.

4 Spectroscopic Properties
The conclusions based on multiband photometry are also supported by analysis of the spectrum of #384 (Figure 2). The most striking features are the broad Lyman- absorption and the presence of several ultraviolet metal absorption lines. The latter features are typical of UV lines seen with IUE in the spectra of hot stars and nearby star forming galaxies such as those catalogued by Kinney et al (1993). As an illustration, Figure 2 also shows the HST spectrum of a starburst knot in NGC 1741, a Wolf-Rayet galaxy at a distance of 77Mpc. (Conti et. al. 1996). The spectral lines seen are similar to those in our source, while the luminosity of this knot at 1500 is a factor 10 fainter (as in the Steidel et al. (1996) sample).
Higher resolution data are required for a detailed analysis of the spectrum (e.g. definative separation of stellar / interstellar absorption) but our data are sufficient to reveal several interesting aspects of this faint object. Using the redshift determined from the metal lines, it can be seen that the Lyman- line is somewhat assymmetric (by 200) on its blueward side. This may possibly be explained by a blend with metal lines such as SiIII 1207. There is also some evidence of further absorption at shorter wavelengths which could be Lyman- absorption from foreground material. The Lyman- absorption does not seem to reach a zero flux level although the signal to noise in the blue remains poor. Similar cases are seen in Kinney et al’s sample, in the HST spectra of nearby galaxies discussed by Leitherer et al. (1996) & Conti et al. (1996), and in the high redshift spectra of Steidel et al. (1996) and Yee et. al. (1996). The claimed luminosity of the latter example is a factor of 130 (at 1500) brighter than our source, strongly suggesting gravitational amplification by the cluster through which it is observed. This large factor allows the aquisition of a much higher signal to noise spectrum than the one presented here.
The strong stellar and interstellar lines seen by the above authors also appear strong in our spectrum with a few exceptions, the most notable of these being the weakness of SiII 1260 c.f. SiII 1527. Although better signal to noise data are required, this ratio is the reverse of that seen in stellar spectra and raises the question of whether the 1527 line is contaminated e.g. by a second component possibly associated with the double nature of the source mentioned in §2. From analyses of IUE stellar spectra and interstellar absorption of Magellanic Cloud stars (e.g. Savage & de Boer, 1981) we conclude that most of the low ionisation lines (e.g. SiII, OI, FeII, CII) are due to interstellar absorption while those of higher ionisation (e.g. CIV, SiIV) are mainly stellar, from late O to early B stars. In stars later than about B2, the doublet of 1526.7Å 1533.4Å becomes important and would have been resolved in our spectrum (c.f. Rountree & Donneborn, (1991)), while in the interstellar medium, only the line at 1526.7Å is seen (as we observe). The absence of Lyman- emission in a source with demonstrably active star formation confirms earlier suspicions that such emission can be attenuated by a number of processes (Charlot & Fall 1991,1993). It is important to distinguish the configuration of our system with the QSO absorption scenario. In the QSO case, Lyman- photons are scattered out of the beam by the absorber. In our case, the sources are embedded within the scattering medium and (as highlighted by Charlot & Fall), the extent of the attenuation depends on the relative abundances and geometry of the mixture of stars, gas and dust.
5 Conclusions
We have secured the redshift, =2.515, of a multiply-imaged arc in the rich cluster Abell 2218 which we believe to be the first comfirmation of a redshift predicted by a cluster lensing model. The result strongly vindicates the precision of the lensing inversion technique developed by KESCS and further illustrates how gravitational lensing through well-constrained clusters can locate samples of high redshift galaxies. The efficiency of this selection technique may be relatively low, given the surface density of high redshift galaxies found by Steidel et al. and the cluster cross section, coupled with the need for high resolution imaging. However, this method is less susceptible to luminosity biases and redshift selection effects than other techniques.
The source responsible for the lensed images appears to be a blue 8-20 galaxy whose on-going star formation rate of 7-11 yr-1 is similar to that of similar sources found at higher redshift by Steidel and collaborators using the Lyman limit cutoff as a high locator. The spectrum reveals UV absorption lines which are consistent with the photometric properties. In particular, the Lyman line is particularly broad suggesting neutral gas is abundant within the galaxy. In conclusion, we believe that the spectral and photometric properties of this source are consistant with those expected of the objects responsible for high redshift absorption along lines of sight to distant quasars.
Acknowledgments
We thank Claus Leitherer, Howard Yee and Chuck Steidel for sharing their results with us prior to their publication. We acknowledge valuable discussions on the interpretation of ultraviolet spectra and photometry with Bob Carswell, Max Pettini and Alfonso Aragón-Salamanca. We especially note the help Karl Glazebrook provided as a regular user of LDSS-2, which operates successfully thanks to the dedicated efforts of La Palma support staff and, in particular, Mike Breare. We are grateful to G. Bruzual for allowing the use of his code for the spectral evolution of galaxies. We also acknowledge financial support from the Particle Physics and Astronomy Research Council (TMDE & IS), European Commission (JPK) and the DGICYT (Ministerio de Eduacion y Ciencia, Spain) (BS).
References
- [Allington-Smith et al.1994] Allington-Smith J., Breare M., Ellis R.S., Gellatly D., Glazebrook K., Jorden P., Maclean J., Oates P., Shaw G. & Tanvir N., 1994, PASP, 106, 983.
- [Bruzual & Charlot1993] Bruzual A., & Charlot S., 1993, ApJ, 405, 538.
- [Charlot & Fall1991] Charlot S., & Fall M., 1991, ApJ, 378, 471.
- [Charlot & Fall1993] Charlot S., & Fall M., 1993, ApJ, 415, 580.
- [Colless et al.1990] Colless M., Ellis R.S., Taylor K., & Hook R.N., 1990, MNRAS, 253, 686.
- [Colless1995] Colless M., 1995, in Wide Field Spectroscopy, eds. Aragón-Salamanca, A. & Maddox, S J, World Scientific, p263.
- [Conti et al.1996] Conti P.S., Leitherer C. & Vacca W.D., 1996, preprint.
- [Cowie et al.1995] Cowie L.L., Hu E.M., & Songaila A., Nature 377, 603.
- [Ebbels et al.1996b] Ebbels T.M.D., Ellis R.S., Kneib J.-P., Pelló, R., & Le Borgne, J.-F., 1996b, in preparation.
- [Ellis et al.1994] Ellis R.S., 1984, in Spectral Evolution of Galaxies, ed. Gondhalekar, P., RAL Publications, p122.
- [Ellis et al.1996] Ellis R.S., Colless M., Heyl J.S., Broadhurst T.J., & Glazebrook K., 1996, MNRAS, in press
- [Kinney et al.1993] Kinney A.L., Bohlin R.C., Calzetti D., Panagia N. & Wyse R.F.G., 1993, ApJS, 86, 5.
- [Kneib et al.1995] Kneib, J.-P., Mellier, Y., Pelló, R., Miralda-Escudé, J., Le Borgne, J.-F., Böhringer, H., Picat, J.-P., 1995, A&A, 303, 27.
- [Kneib et al.1996] Kneib, J.-P., Ellis, R.S., Smail, I.R., Couch, W.J., Sharples, R., 1996, ApJ submitted (KESCS).
- [Le Borgne et al.1992] Le Borgne, J.-F., Pelló, R. & Sanahuja, B., 1992, A&AS, 95, 87.
- [Leitherer et al.1996] Leitherer C., Vacca W.D., Conti P.S., Filippenko A.V., Robert C. & Sargent W.L.W., 1996, ApJ, submmitted.
- [Lilly et al.1996] Lilly, S.J., Le Fevre, O., Hammer F.& Crampton D., ApJ Letters in press.
- [Loveday et al.1992] Loveday J., Peterson B.A., Efstathiou G. & Maddox S.J., 1992, ApJ, 390, 338.
- [Pelló et al.1992] Pelló R., Le Borgne, J.-F., Sanahuja, B., Mathez G., & Fort B., 1992, A&A, 266, 6.
- [Rountree & Donneborn1993] Rountree J., & Donneborn G., 1991, ApJ, 369,515
- [Savage & de Boer1981] Savage B.D. & de Boer, K.S., 1981, ApJ, 243, 460.
- [Smail et al.1993] Smail I., Ellis R.S., Aragón-Salamanca A., Soucail G., Mellier Y., & Giraud E., 1993, MNRAS, 263, 628.
- [Smail et al.1996] Smail I., Dressler A., Kneib J.-P., Ellis R.S., Couch W.J., Sharples R.M. & Oemler A., 1996, ApJ., in press.
- [Steidel et al.1996] Steidel C.C., Giavalisco M., Pettini M., Dickinson M., & Adelberger K.L., 1996, preprint.
- [Thronson et al.1987] Thronson H.A., Hunter D.A., Telesco C.M., Harper D.A., & Decher R., 1987, ApJ, 317, 180.
- [Wolfe et al.1995] Wolfe A.M., Lanzetta K.M., Foltz C.B. & Chaffee F.H., 1995, ApJ, 454, 698.
- [Yee et al.1996] Yee H.K.C., Ellingson E., Bechtold J. & Carlberg R.G., 1996, preprint.