ROSAT HRI observations of the globular clusters M13 and M92
Abstract
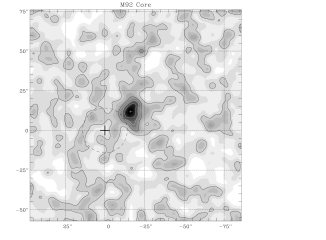
We report on 40 kiloseconds of ROSAT HRI observations of the globular cluster M92 (NGC 6341) and 20 kiloseconds of observations of the globular cluster M13 (NGC 6205). We find that the low-luminosity ( erg sec-1 at 7.5 kpc) source previously observed near the core of M92 with the ROSAT PSPC remains unresolved at HRI resolution; we can identify it with M92 with 99 per cent confidence. In M13 we find that the source seen with the ROSAT PSPC lies within the core and is possibly associated with the cluster (96 per cent confidence). We find probabilities of 99.8 per cent (M92) and 98 per cent (M13) for the presence of additional unresolved emission within these globular clusters. We interpret these results in light of current theories regarding the low-luminosity sources.
keywords:
globular clusters: individual: M92 – globular clusters: individual: M13 – globular clusters: general – X-rays: general1 Introduction
The low-luminosity X-ray sources ( erg sec-1) in globular clusters were first distinguished in the Einstein globular-cluster survey of Hertz & Grindlay (1983a,b; hereafter HG83a and HG83b). Separated by 1.5 orders of magnitude in flux from the high-luminosity sources that are convincingly explained as low-mass X-ray binaries (LMXBs; see Lewin, Van Paradijs & Taam 1993 for a review), they seemed a new population, and over a decade of observations has confirmed this view.
Recent optical and ultraviolet (UV) globular cluster observations have yielded interesting objects in the cluster cores, and these have been suggested as counterparts for the low-luminosity X-ray sources. The ultraviolet variables V1 and V2 detected in the core of 47 Tuc [Paresce, DeMarchi & Ferraro 1992, Paresce & De Marchi 1994] are a case in point. But since the cores of clusters are crowded with interesting objects, positional coincidence is not a convincing argument for association unless it is accompanied by corresponding temporal variability or by a spatial pattern present in both X-rays and the optical/UV. The latter is the case in the core of NGC 6397, where three low-luminosity sources have been identified with three H emission objects that are probably cataclysmic variables (CVs; Cool et al. 1995a, Grindlay et al. 1995).
These counterparts notwithstanding, the nature of the full source population remains uncertain. Some of the initial HG83b sources are almost certainly foreground or background objects rather than low-luminosity sources [Margon & Bolte 1987, Verbunt et al. 1995, Cool et al. 1995b], while proposals for the population itself include CVs (HG83a), LMXBs – either in quiescence [Verbunt, van Paradijs & Elson 1984, Van Paradijs et al. 1987] or viewed at high inclination [White & Mason 1985] – millisecond pulsars [Danner, Kulkarni & Thorsett 1994], and RS CVn systems [Bailyn, Grindlay & Garcia 1990, Verbunt et al. 1993].
With the addition of the data reported here, a total of 38 galactic globular clusters have been subjected to deep imaging with ROSAT (HRI and PSPC). Low-luminosity sources have been seen within or near the cores of 22 of these clusters; perhaps as many as 37 such sources have now been detected (see Johnston & Verbunt 1996 for a full discussion). The present observations aim to constrain this population further, taking advantage of the HRI’s high resolution (FWHM 7 arcsec) to evaluate the possible multiplicity of the sources seen in PSPC observations of M92 and M13 [Hasinger, Johnston & Verbunt 1994, Margon et al. 1994a] and to search for extended emission from the cores of these clusters.
2 Observations and Data Reduction
Observations were made with the ROSAT X-ray telescope [Trümper et al. 1991] and High Resolution Imager (HRI; David et al. 1995), in pointing mode. The initial observation of M92 (17.9 ksec live time) took place during 4–8 April 1994; the observation of M13 which was to follow was aborted for instrumental reasons and rescheduled for the fall. At the same time, 20 kiloseconds were inserted into the schedule for a repeat observation of M92, so that from 29 August to 5 September 1994 our entire original proposed observation sequence was carried out (21.4 ksec live time on M13 and another 20.0 ksec on M92). Thus our total exposure of M92 is 37.9 ksec.
The data reduction began with processing by the ROSAT Standard Analysis Software System (SASS). This software uses a series of sliding cell passes over the image – with detect cells ranging from 24 to 240 pixels on a side – to find rough source positions, and then refines the positions using a maximum-likelihood method. At each cell size, the source detection threshold is set so that one spurious source detection is expected over the field of view. Sources that were detected at more than one cell size here were passed on to the next stage of analysis.
At this point photon lists were created for the near vicinity ( one arcmin) of each of the candidate sources. With custom software we determined source positions by a maximum-likelihood fit to the photon distribution, using the canonical form of the HRI Point-Response Function (PRF) [David et al. 1995]. Positional uncertainties due to the finite-photon statistics of each source were determined by Monte Carlo analysis and found to be about one arcsec for on-axis sources, significantly less than the systematic uncertainty in the satellite pointing ( arcsec).
Using these positions, we determined source fluxes by a local background subtraction: counts from an annulus (20–30 arcsec for on-axis sources) about the source were scaled by area and subtracted from the counts in the source disk (radius 17.5 arcsec on-axis). Disk and annuli radii were inflated off-axis to compensate for the broadening of the HRI PRF – at a minimum, allowing the source disk to encompass 90 per cent of the source counts. Count rates were corrected for vignetting and converted to 0.1–2.4 keV fluxes, assuming a 1 keV bremsstrahlung spectrum [Margon et al. 1994b] and a hydrogen column density of cm-2. The column densities were determined by the cluster reddenings ( = 0.02 for both M92 and M13, Peterson 1993, gives = 0.06, Zombeck 1990) through the prescription of Predehl & Schmitt (1995):
If the actual source spectra are harder than assumed, our derived source fluxes are hardly affected; if they are significantly softer, this has a small effect (fluxes increase by 10 per cent for a 0.50 keV temperature).
Source significances were determined by summing counts within a critical radius – selected by hand for each source – and evaluating the probability of the Poisson fluctuation above background. The quoted confidence level, then, refers to the probability of not seeing such a fluctuation (over an area of that size) anywhere in the field of view. Sources determined to be of less than significance (99.7 per cent confidence) at this point were eliminated.
We analysed the two M92 data sets in tandem: the photons in areas surrounding preliminary source detections in either dataset were output from both and subjected to separate maximum-likelihood analyses. Using the positions of the four strongest sources in the field of view – sources A–D, which had firm detections in both data sets – we rotated (by 0.14 degrees) and shifted (by 2.3 arcsec) the second observation to closest alignment with the first. We then performed the same analysis on the photons extracted from the areas in the summed image, which provided our canonical positions, fluxes and errors. The separate datasets were then compared for evidence of source variability.
| M92 | (′) | Counts | HRI Flux | PSPC Flux | Simbad | (″) | ||||||||
|---|---|---|---|---|---|---|---|---|---|---|---|---|---|---|
| A | 17h | 16m | 319 | 43° | 02′ | 37″ | 8.5 | 121. | JVH 10 | 5.9 | ||||
| B | 17 | 17 | 00.4 | 43 | 10 | 51 | 3.0 | 8.7 | – | |||||
| C | 17 | 17 | 06.3 | 43 | 08 | 23 | 0.3 | 6.5 | – | |||||
| D | 17 | 18 | 09.7 | 43 | 09 | 06 | 11.4 | 5.9 | JVH 07 | 3.3 | ||||
| E | 17 | 16 | 37.3 | 43 | 12 | 25 | 6.9 | 4.4 | 1.0 | V798 Her | 0.2 | |||
| F | 17 | 17 | 29.5 | 43 | 19 | 49 | 12.3 | 4.5 | JVH 02 | 7.2 | ||||
| G | 17 | 16 | 48.4 | 42 | 55 | 01 | 13.6 | 7.2 | JVH 12 | 6.7 | ||||
is the distance of the source from the cluster centre at 17h17m073 +43°08′11″(Trager, Djorgovski & King 1993). Fluxes (0.1–2.4 keV) are in units of erg cm-2 sec-1, assuming a 1 keV bremhsstrahlung spectrum and a column density of cm-2. Quoted significances refer to the probability of not finding a background fluctuation of that magnitude anywhere in the field of view (the ratio of the observed flux to its error may well be smaller). is the distance of the Simbad object from the corresponding HRI source.
| M13 | (′) | Counts | HRI Flux | PSPC Flux | ||||||||
|---|---|---|---|---|---|---|---|---|---|---|---|---|
| A | 16h | 40m | 321 | 36° | 23′ | 23″ | 14.6 | 3.8 | ||||
| B | 16 | 40 | 56.3 | 36 | 34 | 07 | 11.2 | 18.6 | 1.0 | |||
| C | 16 | 40 | 58.5 | 36 | 24 | 30 | 9.2 | 6.6 | ||||
| D | 16 | 41 | 11.1 | 36 | 32 | 33 | 7.8 | 12.5 | ||||
| E | 16 | 41 | 18.6 | 36 | 26 | 48 | 4.7 | 4.0 | ||||
| G | 16 | 41 | 44.0 | 36 | 27 | 59 | 0.6 | 7.9 | ||||
| H | 16 | 41 | 56.6 | 36 | 35 | 16 | 8.2 | 3.2 | ||||
| I | 16 | 42 | 03.6 | 36 | 24 | 15 | 5.6 | 5.1 | ||||
| J | 16 | 42 | 19.8 | 36 | 31 | 53 | 8.8 | 5.8 | 1.0 | |||
| N | 16 | 41 | 52.8 | 36 | 40 | 23 | 13.0 | 3.3 | 1.0 | |||
| P | 16 | 41 | 59.7 | 36 | 44 | 21 | 17.1 | 3.3 | 1.0 | |||
| Q | 16 | 42 | 35.7 | 36 | 18 | 13 | 14.4 | 4.1 | ||||
is the distance of the source from the cluster centre at 16h41m415 +36°27′37″(Trager et al. 1993). Fluxes (0.1–2.4 keV) are in units of erg cm-2 sec-1, assuming a 1 keV bremhsstrahlung spectrum and a column density of cm-2. Quoted significances refer to the probability of not finding a background fluctuation of that magnitude anywhere in the field of view (the ratio of the observed flux to its error may well be smaller). No Simbad counterparts were found within one arcminute of any source.
| M92 | Flux 1 | Flux 2 | Sig 1 | Sig 2 | Variable? |
|---|---|---|---|---|---|
| A | 72.3 | 73.0 | 3.2 | ||
| B | 6.4 | 6.0 | – | ||
| C | 3.3 | 5.1 | – | ||
| D | 4.5 | 3.8 | – | ||
| E | 4.4 | 4.5 | – | ||
| F | 2.7 | 4.9 | 2.3 | ||
| G | 1.4 | 5.1 | 5.8 |
Fluxes (0.1–2.4 keV) are in units of erg cm-2 sec-1. “Flux 1” and “Flux 2” are the fluxes observed in our two observations, and “Sig 1” and “Sig 2” the corresponding significances. The significances here refer to the probability of not seeing such a fluctuation above background within the source disk only (17.5 arcsec radius on-axis). Sources variable at greater than the two-sigma level are indicated.
presents a comparison of the sources present in the two observations of M92. The quasar QSO 1715+432 [Harris et al. 1992], present in the M92 field of view, was not detected; no quasars within the M13 field of view were found in the catalog of Hewitt & Burbidge 1993. The four 1.4 GHz radio sources within the M13 core (including one pulsar) observed by Johnston, Kulkarni & Goss (1991) were not detected.
Our limiting fluxes for detection of sources on-axis were and erg cm-2 sec-1, respectively, for M92 and M13 (corresponding, in turn, to X-ray luminosities of and erg sec-1 at the cluster distances of 7.5 and 7.2 kpc), where again, a 1 keV bremsstrahlung spectrum has been assumed. To evaluate whether we see an overdensity of sources in these fields of view, we first compare the number of sources seen to that expected from the – relation of ROSAT deep surveys (Hasinger et al. 1993; hereafter Ha93). For purposes of this comparison, we assume an power-law spectrum for the background sources; this is roughly the best-fit spectrum given by Ha93. Adopting this spectrum increases the calculated source fluxes by 10 per cent: our limiting fluxes become and erg cm-2 sec-1 for on-axis sources in M92 and M13. Because of vignetting and the broadening of the PRF, these limiting fluxes increase off-axis, but we ignore that effect here.
Using the soft X-ray – from Ha93 and converting from their smaller bandpass (0.5–2 keV), we find that at these limiting fluxes we expect and background sources per square degree for our M92 and M13 observations, respectively. Adding in the Poisson uncertainties on these numbers, we expect to find and sources in the M92 and M13 fields of view. We see seven sources in the M92 field of view and twelve sources in the M13 field of view, which is consistent with these predictions.
As a further check, we compare our observations to the PSPC observations of the same clusters [Margon et al. 1994b]. Within the HRI field of view for M92 we find ten PSPC sources above the HRI flux limit, consistent – if we allow for modest source variability – with the seven observed. Similarly, in the HRI field of view for M13 we find 13 PSPC sources above the HRI flux limit, consistent with the twelve observed. Tables 1 and 2 show that six of our seven M92 HRI sources, and eight of our twelve M13 HRI sources, were also seen in the PSPC observations.
A query of the Simbad database returned a list of identified galactic objects within our fields of view, and when these fell close to our sources, they are also included in the Tables. The coincidences in the M92 field of view are striking: all five of our sources outside the M92 core region have a Simbad counterpart foreground star within 8 arcsec. We have taken advantage of these coincidences to adjust our aspect for that observation.
No Simbad counterparts were found for our M13 sources; however, examination of a Palomar Optical Sky Survey image of M13 from the STScI Digitized Sky Survey reveals probable bright but anonymous optical counterparts to the sources M13B and M13D. It also reveals that the optical field is too crowded to allow firm counterpart identifications for these sources or for sources M13E, M13G and M13I. In all, then, our M13 observation finds seven sources outside the M13 core region without optical counterparts, where our M92 observation finds counterparts for every source. We postulate no underlying reason for this discrepancy.
3 Discussion: Core Sources

projection to the centre of its cluster to warrant further analysis: the a posteriori chances of finding a field source anywhere closer than twice the distance of sources M92C and M13G from their cluster centres are only 1.1 per cent and 5 per cent, respectively.
To construct a credible statistic for the significance of the association, we make a comparison of two probability densities, evaluated at the source’s observed position: on the one hand, the probability density for unassociated field sources (roughly constant across the field of view), and on the other hand, the probability density at that point for a binary system within the globular cluster. For the second value we use formula (11) of Lightman, Hertz & Grindlay (1980) for the projected probability density of a test mass greater than the average mass of a cluster’s core population:
where is the vector position of the source – relative to the cluster centre – in units of the cluster core radius, and is the ratio of the test mass to . (This formula should properly be convolved with our uncertainties, but we neglect that step.) We take a value of 2.3 () – average for a CV system in the clusters – as being reasonable for the low-luminosity sources. The results of this calculation are shown in Table 4: we find a probability
| Source | (″) | () | (%) | (%) | |
|---|---|---|---|---|---|
| M92C | 28 | 99 | |||
| M13G | 7 | 96 |
is the distance of the source from the cluster centre, is the cluster core radius of 14.1 arcsec for M92 and 52.5 arcsec for M13 (Trager et al. 1993) and is the source X-ray luminosity (0.1–2.4 keV) in units of erg sec-1. The single-source likelihood is the confidence with which we prefer a single to a double-source fit (see text) – the quoted value for M92C refers to the first observation only, because of aspecting problems in the second. is the probability that the source is associated with its globular cluster, given a source system mass of 1.4 (see text).
of association of 99 per cent for source M92C, and 96 per cent for source M13G.
If the mass of the low-luminosity source systems is not 1.4, this will alter the expected distribution of the sources, and the probability of association, accordingly. If the systems are more massive than 1.4, the probabilities are not much affected. If the systems are less massive, however, this reduces the probability of association for both of our sources, and for M13G especially. For example, if the system mass is 0.7 (), our probabilities of association are 98 per cent for M92C and 88 per cent for M13G.
Using our duplicate observation of M92, we are able to test for long-term variability of the source M92C (Table 3). We find no evidence for a change in the source’s flux from the initial observation to the one that occurred five months later; our statistics are sufficient, however, only to detect variability by a factor of three or more.
We test for multiplicity of these sources by performing a multiple-source fit on the data sets and comparing the double-source and single-source likelihoods by the usual prescription. Tests on simulated data sets indicate that, for two adjacent sources each half the strength of our M92C, we can distinguish the two-source nature of the profile at a separation of five arcsec or more. With our actual data, we find that a double-source fit is not preferred for M92C in our first M92 observation. Examination of data from the second observation reveals that it is probably affected by elliptical blurring due to inaccurate aspect correction as discussed in the HRI Report [David et al. 1995]: the two on-axis sources M92B and M92C exhibit an ellipticity of profile that is similar in magnitude (major and minor axes of 7 arcsec and 4 arcsec) and orientation. Because of this, we do not attempt a single versus double-source comparison for this observation.
For M13G we find that a two-source fit is mildly preferable (93 per cent confidence level). The magnitude and orientation of M13G’s deformation from a single-source profile is not reproduced in the other two on-axis sources, so it does not seem to be the result of the elliptical blurring mentioned above. If it is in fact due to a second source, then the two components of M13G have fluxes roughly in the ratio of 3:1 and are separated by 6.5 arcsec. At the distance of the cluster, then, their X-ray luminosities would be and erg sec-1, respectively, and they would be separated by 0.2 pc in projection.
4 Discussion: Excess Emission
Multiple low-luminosity sources have now been seen in the cores of several globular clusters (Hasinger et al. 1994; Cool et al. 1993; Grindlay 1994), and the weakest detected sources have luminosities well below our threshold. Thus we would not be surprised if there were more sources still undetected in the cores of M92 and M13.
We searched for the excess emission associated with such sources by extracting photons from a circular region extending out to several arcminutes from the centres of the clusters. Emission from each of our detected sources was punched out with a 12 arcsec-radius disk – removing 90 per cent of its flux – and replaced with the events in a similar disk at the same radial distance from the cluster centre. We created plots of the binned counts in successive annuli about the cluster centre, collecting a minimum of 100 counts in each bin, to determine the rough extent of any excess emission (Fig. 3). Then the

evidence for excess emission was simply the Poisson probability of the corresponding fluctuation (Table 5).
| Cluster | (″) | (pc) | (%) | () |
|---|---|---|---|---|
| M92 | 50 | 1.9 | 99.8 | |
| M13 | 75 | 2.7 | 98. |
is the rough extent of the emission, and is the confidence level of its existence. Luminosities (0.1–2.4 keV) are in erg sec-1, assuming a 1 keV bremsstrahlung spectrum (i.e., a set of sources like the known low-luminosity sources).
Di Stefano & Rappaport (1994) have performed simulations of tidal interactions in the cores of the globular clusters 47 Tuc and Cen, with the aim of predicting the populations of cataclysmic variables expected to form within them. Performing a simple-minded scaling of their results to our clusters, we find that the erg sec-1 of emission from M92 can correspond to a population of roughly 30 CVs in their scheme, and that the erg sec-1 of emission from M13 – if it is real – can correspond to a population of roughly 40 CVs.
On a more observational level, we may consider the best-guess luminosity function for the low-luminosity sources, derived by Johnston & Verbunt (1996) from the full set of globular cluster observations. Assuming a power-law form (), Johnston & Verbunt find a best of about 0.5. According to this line of reasoning, then, the emission remaining after subtraction of the detected sources is probably due to a small number of point sources close below our detection limit. Figure 3 lends support to this view, since most of the excess emission is found in a narrow radial range. We note that the presence of a small number of sources at these luminosities would not necessarily contradict the predictions of a much larger number of CVs made by DiStefano and Rappaport (see above), since the luminosity distribution of these systems is not well known, and is compatible with a low luminosity for most (for a recent review see Verbunt 1996).
5 Conclusions
We have observed a low-luminosity X-ray source in close proximity to the core of each of the globular clusters M92 (NGC 6341) and M13 (NGC 6205). In each case the positional coincidence indicates that the source can probably, but not conclusively, be associated with its cluster (probabilites of 99 per cent and 96 per cent for M92C and M13G, respectively). We find evidence that the source M13G has a secondary or extended component (93 per cent). We find no evidence for variability in source M92C from one of our 20 ksec observations of the cluster to the next, five months later; however, our sensitivity is sufficient only to detect variability by a factor of three or more.
We observe excess X-ray emission from M92 (99.8 per cent confidence), and find evidence for similar emission, unassociated with any of our detected sources, from M13 (98 per cent confidence). In M92 it extends out to a distance of roughly two parsecs from the cluster centre, and has a total luminosity (assuming a 1 keV bremsstrahlung spectrum) of erg sec-1. In M13 the excess emission, if it exists, has a luminosity of erg sec-1and is localized near the edge of the core. In both cases, our preferred interpretation of the emission is as a small set of sub-threshold (low-luminosity) X-ray sources within the globular clusters. Such a population of low-luminosity sources is predicted to exist in the clusters by tidal capture theory (which holds that they are CVs) and by the power-law luminosity function that best fits the full population as currently known.
We find that all five of the X-ray sources within the M92 field of view, but external to the cluster, are coincident with foreground stars from the Simbad database.
5.1 Acknowledgments
We thank Eric Deutsch for supplying the SASS-output positions and count rates for the sources from the PSPC observations of the clusters. This material is based upon work supported under a National Science Foundation Graduate Research Fellowship (D. Fox). B. Margon acknowledges the financial support of NASA Grant NAG5-1518. F. Verbunt is supported by the Netherlands Organization for Scientific Research (NWO) under grant PGS 78-277. The Digitized Sky Surveys were produced at the Space Telescope Science Institute under U.S. Government grant NAG W-2166. This research made use of the Simbad database, operated at CDS, Strasbourg, France.
References
- [Bailyn, Grindlay & Garcia 1990] Bailyn C. D., Grindlay J. E., Garcia M. R., 1990, ApJ, 357, L35
- [Cool et al. 1993] Cool A. M., Grindlay J. E., Krockenberger M., Bailyn C. D., 1993, ApJ, 410, L103
- [Cool et al. 1995a] Cool A. M., Grindlay J. E., Cohn H., Lugger P., Slavin A., 1995a, ApJ, 439, 695
- [Cool et al. 1995b] Cool A. M., Grindlay J. E., Bailyn C. D., Callanan P. J., Hertz P., 1995b, ApJ, 438, 719
- [Danner, Kulkarni & Thorsett 1994] Danner R., Kulkarni S. R., Thorsett S. E., ApJ, 436, L153
- [David et al. 1995] David L. P., Harnden Jr. F. R., Kearns K. E., Zombeck M. V., 1995, The ROSAT High Resolution Imager. U.S. ROSAT Science Data Center/SAO, Cambridge, MA
- [Di Stefano & Rappaport 1994] Di Stefano R., Rappaport S., 1994, ApJ, 423, 274
- [Grindlay 1994] Grindlay J. E., 1994, Mem. Soc. Astron. Ital., 65, 259
- [Grindlay et al. 1995] Grindlay J. E., Cool A. M., Callanan P. J., Bailyn C. D., Cohn H. N., Lugger P. M., 1995, ApJ, 455, L47
- [Harris et al. 1992] Harris H. C. et al., 1992, AJ, 104, 53
- [Hasinger et al. 1993] Hasinger G., Burg R., Giacconi R., Hartner R., Schmidt M., Zamorani G., 1993, A&A, 275, 1
- [Hasinger, Johnston & Verbunt 1994] Hasinger G., Johnston H., Verbunt F., 1994, A&A, 288, 466
- [Hertz & Grindlay 1983a] Hertz P., Grindlay J. E., 1983a, ApJ, 267, L83
- [Hertz & Grindlay 1983b] Hertz P., Grindlay J. E., 1983b, ApJ, 275, 105
- [Hewitt & Burbidge 1993] Hewitt A., Burbidge G., 1993, ApJS, 87, 451
- [Johnston & Verbunt 1996] Johnston, H. M., Verbunt F., 1996, A&A, in press
- [Johnston, Kulkarni & Goss 1991] Johnston H. M., Kulkarni S. R., Goss W.M., 1991, ApJ, 382, L89
- [Johnston, Verbunt & Hasinger 1996] Johnston H. M., Verbunt F., Hasinger G., 1996, A&A, in press
- [Lewin, Van Paradijs & Taam 1993] Lewin W. H. G., Van Paradijs J., Taam R., 1993, Space Sci. Rev., 62, 223
- [Lightman, Hertz & Grindlay 1980] Lightman A. P., Hertz P., Grindlay J. E., 1980, ApJ, 241, 367
- [Margon & Bolte 1987] Margon B., Bolte M., 1987, ApJ, 321, L61
- [Margon et al. 1994a] Margon, B., Deutsch E., Silber A., Lewin W. H. G., Van Paradijs J., Van der Klis M., 1994a, BAAS, 184, 872
- [Margon et al. 1994b] Margon B., Deutsch E., Silber A., Lewin W. H. G., Van Paradijs J., Van der Klis M., 1994b, in Makino F., Ohashi T., eds, New Horizon of X-ray Astronomy. Universal Academy Press, Tokyo, p. 395
- [Paresce & De Marchi 1994] Paresce F., De Marchi G., 1994, ApJ, 427, L33
- [Paresce, DeMarchi & Ferraro 1992] Paresce F., DeMarchi G., Ferraro F., 1992, Nat, 360, 46
- [Peterson 1993] Peterson C. J., 1993, in Djorgovski S. G., Meylan G., eds, ASP Conference Series Vol. 50, Structure and Dynamics of Globular Clusters. ASP, San Francisco, p. 337
- [Predehl & Schmitt 1995] Predehl P., Schmitt J. H. M. M., 1995, A&A, 293, 889
- [Rappaport et al. 1994] Rappaport S., Dewey D., Levine A., Macri L., 1994, ApJ, 423, 633
- [Shara et al. 1995] Shara M. M., Drissen L., Bergeron L. E., Paresce F., 1995, ApJ, 441, 617
- [Trager, Djorgovski & King 1993] Trager S. C., Djorgovski S., King I. R., 1993, in Djorgovski S. G., Meylan G., eds, ASP Conference Series Vol. 50, Structure and Dynamics of Globular Clusters. ASP, San Francisco, p. 347
- [Trümper et al. 1991] Trümper J., Hasinger G., Aschenbach B., Braeuninger H., Briel U. G., 1991, Nat, 349, 579
- [Van Paradijs et al. 1987] Van Paradijs J., Verbunt F., Shafer R. A., Arnaud K. A., 1987, A& A, 182, 47
- [Verbunt 1996] Verbunt F., 1996, in Zimmermann H. U., Trümper J., Yorke H., MPE Report 263, Röntgenstrahlung from the Universe. p. 93
- [Verbunt, van Paradijs & Elson 1984] Verbunt F., van Paradijs J., Elson R., 1984, MNRAS, 210, 899
- [Verbunt et al. 1993] Verbunt F., Hasinger G., Johnston H. M., Bunk W., 1993, Adv. Space Res., 13(12), 151
- [Verbunt et al. 1995] Verbunt F., Bunk W. H., Hasinger G., Johnston H. M., 1995, A&A, 300, 732
- [White & Mason 1985] White N. E., Mason K. O., 1985, Space Sci. Rev., 40, 167
- [Zombeck 1990] Zombeck M. V., 1990, Handbook of Space Astronomy & Astrophysics. Cambridge Univ. Press, Cambridge