The Effects of a Photoionizing UV Background
on the Formation of Disk Galaxies
Abstract
We use high resolution N-body/gasdynamical simulations to investigate the effects of a photoionizing UV background on the assembly of disk galaxies in hierarchically clustering universes. We focus on the mass and rotational properties of gas that can cool to form centrifugally supported disks in dark matter halos of different mass. Photoheating can significantly reduce the amount of gas that can cool in galactic halos. Depending on the strength of the UV background field, the amount of cooled gas can be reduced by up to in systems with circular speeds in the range - km s. The magnitude of the effect, however, is not enough to solve the “overcooling” problem that plagues hierarchical models of galaxy formation if the UV background is chosen to be consistent with estimates based on recent observations of QSO absorption systems. Photoionization has little effect on the collapse of gas at high redshift and affects preferentially gas that is accreted at late times. Since disks form inside-out, accreting higher angular momentum gas at later times, disks formed in the presence of a UV background have spins that are even smaller than those formed in simulations that do not include the effects of photoionization. This exacerbates the angular momentum problem that afflicts hierarchical models of disk formation. We conclude that photoionization cannot provide the heating mechanism required to reconcile hierarchically clustering models with observations. Energy feedback and enrichment processes from the formation and evolution of stars must therefore be indispensable ingredients for any successful model of the formation of disk galaxies.
1 Introduction
Hierarchical clustering is at present the most successful paradigm of structure formation. In this scenario, structure grows as systems of progressively larger masses merge and collapse to form newly virialized systems. Many aspects of this hierarchy, such as the mass function of dark matter halos, their merger rates, and the formation times of systems of different mass can be computed analytically using variations of the Press-Schechter theory (Press & Schechter 1974, Bond et al. 1991, Bower 1991, Lacey & Cole 1993, Kauffmann & White 1993). These analytical predictions have been successfully tested against the results of N-body simulations (Lacey & Cole 1994), and provide a framework within which we can interpret the evolution of the mass hierarchy in the universe once the power spectrum of initial density fluctuations and the cosmological parameters are specified.
The formation and evolution of galaxies within this hierarchy is less well understood. In the standard lore, galaxies form as baryons cool and collapse in the potential wells of an evolving population of dark matter halos (White & Rees 1978). One key ingredient thus seems to be the ability of gas to cool efficiently and collapse to the center of halos, where it can form centrifugally supported disks and stellar systems concentrated enough to survive as separate entities as their surrounding halos merge in groups and galaxy clusters. Cooling times on galaxy scales seem, indeed, to be at present shorter than a Hubble time, lending support to this picture (Silk 1977, Rees & Ostriker 1977). Furthermore, dissipative collapse within dark halos seems to be the only way to turn the meager angular momentum induced by tidal torques into the fast spins of spiral galaxies (Fall and Efstathiou 1980).
A few major shortcomings of this scenario have also been identified. Since cooling times scale inversely with density, the dissipative collapse of gas should have been more efficient at high redshift because the dark matter halos present at that time (and the universe as a whole) were denser. Cooling is expected to be so efficient at early times that, in order to prevent the gas from cooling and turning into stars as soon as the first level of the hierarchy collapses, it is necessary to postulate the existence of a heating mechanism that can keep the gas hot and diffuse until systems with the typical size and mass of galaxies are assembled. Such heating mechanism, if especially effective in low mass halos, may also explain why the number of low luminosity galaxies is much lower than expected from the steep low-mass end slope of the halo mass function. This “overcooling” problem and its relation to the luminosity function was originally noticed by White & Rees (1978) and has been explored in detail by Cole (1991) and White & Frenk (1991), among others.
A related problem concerns the angular momentum of gaseous disks assembled in this scenario. In the absence of heating, most of the mass of a galactic disk would be accreted through mergers of protogalaxies whose own gas component had previously collapsed to form centrifugally supported disks. Numerical simulations show that, because of the central concentration of the gas, a large fraction of its angular momentum is transferred to the surrounding halos during mergers. As a result, the spin of gaseous disks formed by hierarchical mergers is much lower than that of observed spirals (Navarro, Frenk & White 1995a).
These problems all suggest that an efficient heating mechanism is needed in order to reconcile hierarchical galaxy formation scenarios with observations. Heating may either prevent gas from collapsing in, or remove it from the center of, low mass halos at high redshift. The gas may thus retain its angular momentum during mergers and cool later to form disks with spins comparable to observed spirals. The same process also could potentially bring the galaxy luminosity function and the halo mass function into agreement (see Kauffmann, White & Guiderdoni 1994, Cole et al. 1994).
One process that has been repeatedly advocated in the literature envisions energy feedback from supernovae and evolving stars as the main heating mechanism. This is certainly possible energetically. The total energy released by supernovae is enough to unbind most of the baryons from galaxy halos, especially from the shallow potential wells of low-mass systems (see, eg., Dekel & Silk 1986). If this energy could be channeled efficiently into heating the surrounding interstellar medium, perhaps driving large-scale winds such as those seen in galaxies that are actively forming stars, they could provide the required heating mechanism. Modeling this process is a formidable challenge because it involves the ill-understood physics of star formation and of the interaction of evolving stars with the interstellar medium.
A simpler alternative has been proposed by Efstathiou (1992), who suggested that the photoionizing UV background implied by the Gunn-Peterson effect in QSO spectra may be responsible for preventing gas from cooling in low mass halos at high redshift. This suggestion can in principle be tested directly using N-body/gasdynamical simulations. In fact, a few studies have already been carried out, albeit with mixed results. For example, Cen & Ostriker (1992) argued that even a UV background much weaker than suggested by the Gunn-Peterson effect could prevent the prolific formation of low mass galaxies in the standard Cold Dark Matter scenario. Vedel, Hellsten & Sommer-Larson (1994) used simulations of the collapse of an overdense, rigidly-rotating sphere to argue that the central regions of galaxies as massive as the Milky Way can be influenced by photoionization effects. This qualitative conclusion, however, was based on a single simulation and therefore cannot be used to derive results of general applicability. On the other hand, Steinmetz (1995), Quinn, Katz & Efstathiou (1996), Thoul & Weinberg (1996) and Weinberg, Hernquist & Katz (1996) have recently concluded that in systems with circular velocities larger than about km s-1 the effects of a UV background would be rather small. Their conclusions are based on the results of 3- and 1- simulations of the formation of low mass systems in the CDM scenario.
This apparent discrepancy could be due to a number of reasons. (i) The poor spatial resolution of Cen & Ostriker may have artificially enhanced the effects of the UV background (poor numerical resolution mimics heating and leads to a reduction in the efficiency of cooling). This seems likely given the results of Weinberg et al., who demonstrate that insufficient numerical resolution can artificially suppress the formation of low mass objects. (ii) The artificial initial conditions of Vedel et al. complicates the interpretation of their results. (iii) Steinmetz, Quinn et al., and Weinberg et al. studied the formation of low-mass halos at , , and , respectively, and therefore their conclusions are not directly applicable to present-day galaxies. (iv) The spherical symmetry assumed by the 1D treatment of Thoul & Weinberg hampers the comparison between their results and those of the previous studies.
We present in this paper 3D N-body/gasdynamical simulations of the formation of galaxies in the standard CDM scenario designed to address these issues. In particular, we focus on how the presence of a UV background affects the amount of gas that can cool in dark matter halos, as well as on the rotational properties of gaseous disks formed in these systems. We improve on previous studies by evolving up to the present () systems with circular velocities between and km s-1. Our mass and spatial resolution also represent a significant improvement over previous studies ( gas particles per system compared with of Quinn et al.). As in the studies mentioned above, we neglect the effects of star formation in this simplified approach.
The plan of this paper is as follows. In §2 we describe the numerical code and the initial conditions of the simulations. Section 3 describes the results of the numerical experiments. The time evolution of the systems for different choices of the spectrum and redshift dependence of the photoionizing background is presented in §3.1; §3.2 discusses the amount of mass that can cool in each of these systems as a function of redshift and of the strength of the radiation field. In §3.3 we analyze the rotational properties of the disks. Section 4 compares these results with previous works and discusses their implications for hierarchical models of galaxy formation. Section 5 contains a brief summary of our main conclusions.
2 The Numerical Experiments
2.1 The Code
The numerical code we use is GRAPESPH, an implementation of a hybrid N-body/hydrodynamical code for the special purpose hardware GRAPE (Sugimoto et al. 1990). This code combines a direct-summation N-body integrator with the Smooth Particle Hydrodynamics (SPH) approach to numerical hydrodynamics (Monaghan 1992). It is described in detail in Steinmetz (1996). The version of the code we use here is especially adapted to evolve a mixture of collisionless (dark matter) and collisional (gas) fluids. It is fully Lagrangian, three-dimensional, and highly adaptive in time and space by means of individual smoothing lengths and individual timesteps. The physical processes included in this version of the code include self-gravity, pressure gradients, hydrodynamical shocks, radiative and Compton cooling and, optionally, the photoheating of a UV background with a specified spectrum. The code follows self-consistently the non-equilibrium time evolution of the six baryonic species (H, H+, He, He+, He++, and ). We assume that the gas remains optically thin throughout the calculation and that the background radiation is uniform in space; ie. we neglect any corrections due to radiative transfer effects.
One important feature of the code we use here is that it uses a “shearfree” formulation of the artificial viscosity in the SPH equations of motion. This is important to prevent artificial viscous angular momentum transport in gaseous disks. A full description of the shearfree viscosity implementation, as well as of tests relevant to the issues we discuss in this paper, are presented in the Appendix.
2.2 The Initial Conditions
We simulate the evolution of 8 different systems with circular speeds in the range km s km s. These systems are selected from a large cosmological simulation of a standard CDM universe carried out with a P3M code (Efstathiou et al. 1985). This simulation follows the evolution of particles in a periodic box of Mpc on a side. (Here and throughout this paper we assume a value of km s-1 Mpc-1 for the Hubble constant and for all physical quantities that depend on it.) The present time () is identified by requiring that the linear rms fluctuations in a sphere of radius Mpc equals ( is the usual “bias” parameter). The eight systems are selected from a list of clumps compiled using a friends-of-friends algorithm with linking parameter set to of the mean interparticle separation.
In order to span a large range in mass but to have as well some indication of the “cosmic” scatter at a given mass we choose the eight systems in two mass bins; four low-mass systems with between and km s-1 and four massive systems with between and km s-1. The particles of each system are then traced back to the initial conditions, where a box containing all of them is drawn. The size of the box is and comoving Mpc on a side for the low- and high-mass systems, respectively. We load this high-resolution box with particles on a cubic grid and perturb them with the same long waves as in the original P3M simulation, plus some shorter waves up to the Nyquist frequency of the new particle grid. The outer regions are coarse-sampled with a few thousand particles of radially increasing mass in order to reproduce the tidal effects due to distant material. This procedure ensures the formation of a clump that is indistinguishable from the one selected in the P3M run except for the improved spatial and mass resolution. Further details can be found in Navarro & White (1994).
The gas component is included by laying the same number of gas particles on top of the dark matter particles in the high-resolution box. They are given their same velocities, and are assigned masses assuming a mean baryon density of (). The mass per gas particle is and in the low- and high-mass systems, respectively. We adopt a Plummer gravitational softening of () kpc for the dark matter and of () kpc for the gas particles in the low (high) mass systems. All runs are started at . The number of timesteps varies between and for particles in the densest regions and in the boundary, respectively. We have also carried out a series of low-resolution runs, following exactly the same procedure as before but reducing the number of particles in the high-resolution box by a factor of six. This provides a direct test of the importance of numerical resolution effects.
2.3 The Photoionizing Background
Observations of the observed deficit of Ly forest lines near quasars (the “proximity effect”) can be used to put some constraints on the UV background at high redshifts. A compilation of ground-based data for high-redshift quasars plus data from the HST FOS Key Project indicates that the specific intensity of the UV background at the Lyman limit, , seems to increase with redshift to reach at -. There is preliminary evidence of leveling off or even declining at higher redshifts. (For a review, see Bechtold 1995.) Based on these results, we have chosen to model the time evolution of the ambient UV radiation by
We use to denote the Lyman limit and we parameterize as in Vedel et al. (1994),
Most of our runs use and , but we have also explored, in two runs, an extreme version of the photoionizing spectrum, assuming and . The time evolution of in these two cases is compared with observational constraints in Figure 1. Our choice is likely to overestimate the effect of the UV radiation field at . However, we shall see below that the density of collapsing clumps at is so high that even the more energetic background has almost negligible effects on the cooling efficiency. The true evolution of the UV radiation field is likely to fall between our two models at lower .
Table 1 gives a complete summary of the relevant parameters of each run and introduces useful notation. Runs - refer to low-mass systems, runs - to high-mass systems. We have labeled each run that includes a UV background with “”; the extreme UV background runs have an extra “” index. Finally, runs preceded by “” refer to low-resolution models, where the number of particles has been artificially lowered by a factor of 6. The columns , , and give the mass, radius and circular velocity of a sphere within which the mean overdensity of the system is 200 at . We shall refer to as the “virial” radius. and are the numbers of gas and dark matter particles within that sphere. and are the total mass in each component within . The mass of the central gaseous disk at is listed under .
3 Results
3.1 Time evolution
The general evolution in runs that do not include a UV background (runs -) is very similar to that described in Navarro & White (1994) and Navarro et al. (1995a). Here we briefly describe the salient aspects of the typical formation process of these systems, and refer the reader to those papers for a more detailed discussion. Clumps of small mass collapse at high redshift and merge progressively to form more massive systems. The largest progenitor has about half the final mass at -. The gas follows the dark matter as it expands, turns around, and collapses in the smallest resolved clumps. The energy gained during the collapse is converted into heat by shocks and quickly radiated away. The gas then sinks to the center of the halos, where it settles into centrifugally supported disks. More massive disks are formed by mergers of smaller ones plus the smooth accretion of gas particles in smaller, unresolved clumps.
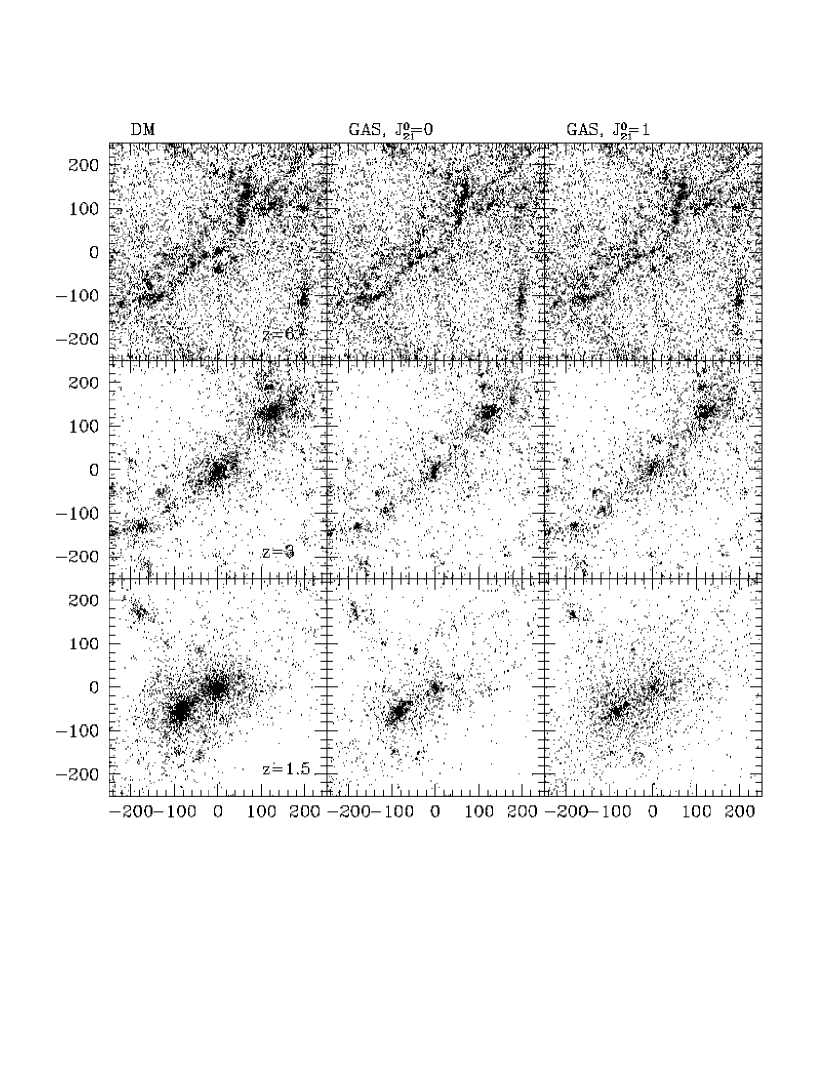
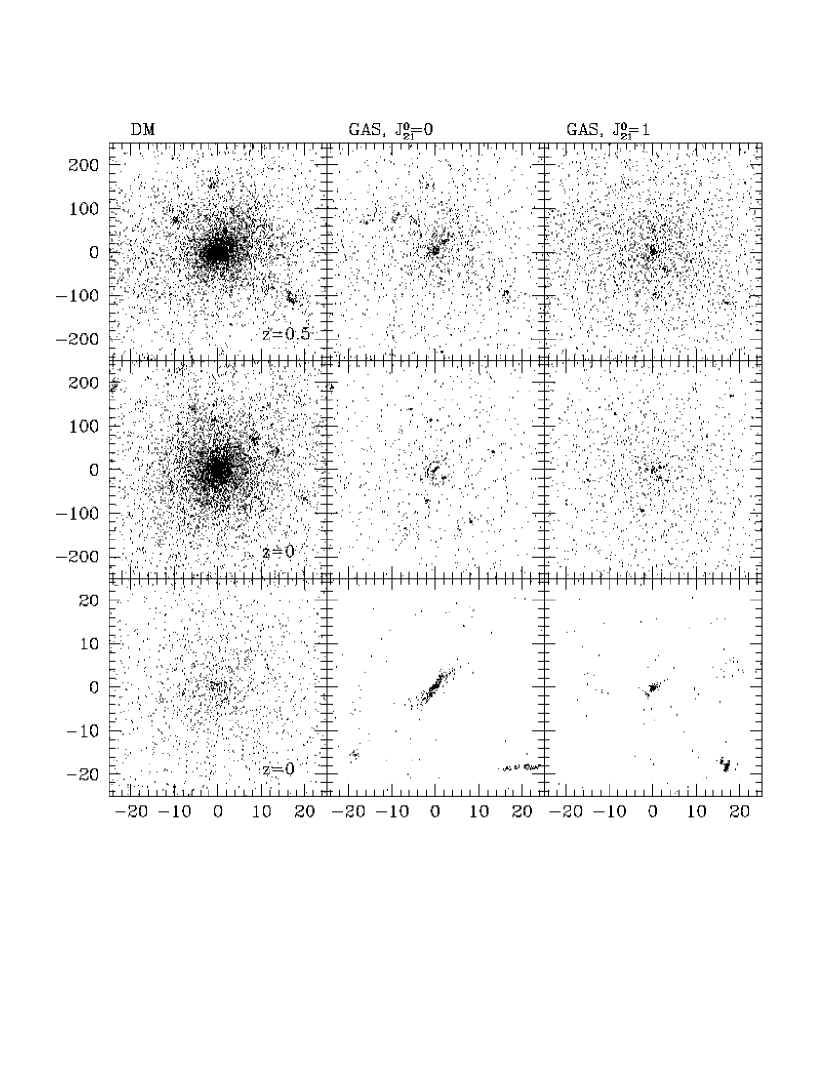
Figure 2 shows one of the systems at different evolutionary stages. Note that as early as a significant fraction of the mass of the systems is already in collapsed clumps. At this time, the mass of the largest progenitor is about a tenth of the final mass. The last major merger seems to occur at , and only a small number of low-mass satellites are accreted after . The inclusion of a UV background prevents some gas from cooling at late times, although this effect is difficult to appreciate in Figure 2. The disk at appears, however, much more concentrated in this case. Note the presence of a few satellites orbiting around the central disk, some of them stripped of their dark matter halos. These satellites contain only a small fraction of the gas mass of the system, most of which resides in the central disk. We discuss these effects in more detail in the following subsections.
3.2 The mass of cooled gas
3.2.1 Runs without a UV background
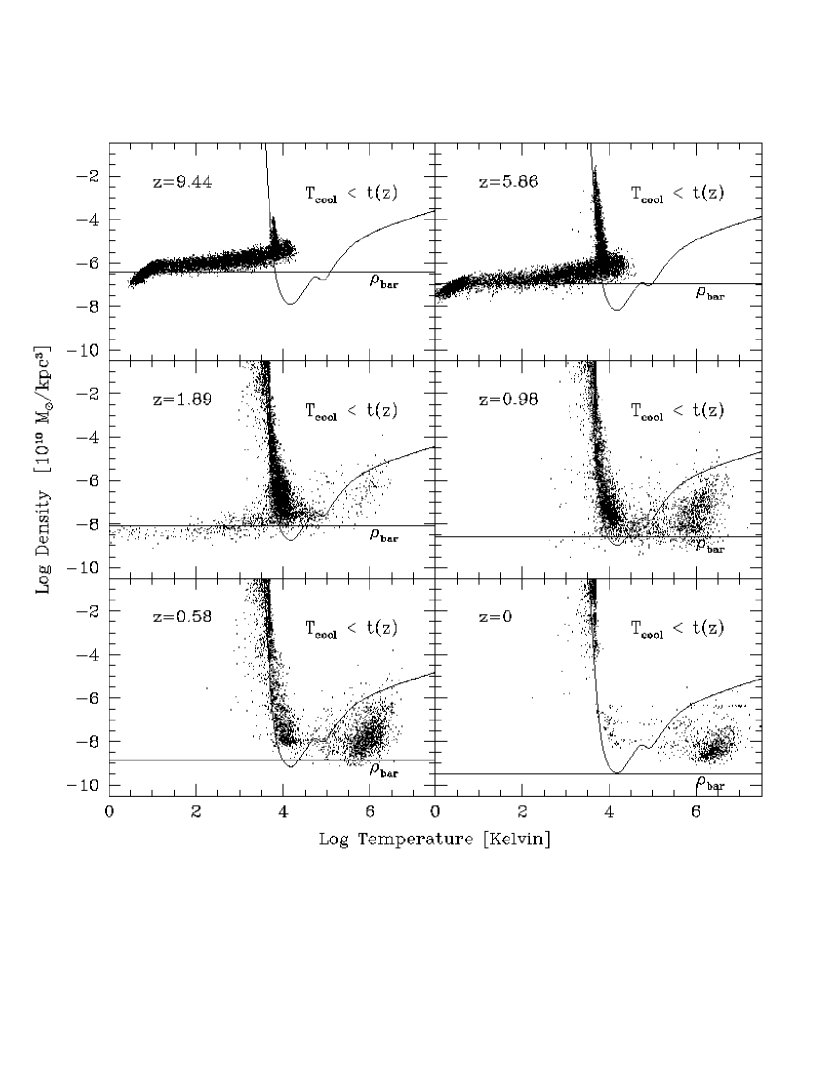
Figure 3 shows the evolution of the gas component in the density-temperature plane for the system shown in Figure 2. The horizontal lines in these panels correspond to the mean baryon density at each redshift. The meandering curve separates the regions where the cooling time, , is shorter than the current age of the universe, . Particles expanding or contracting adiabatically move along lines of slope in this plot. This is the behavior seen for underdense regions at and . At the same redshifts, particles in overdense regions are distributed almost horizontally; these are particles in collapsing clumps that are being heated by shocks. Since even strong shocks cannot raise the density by more than a factor of few but there is no bound on the jump in temperature, shock-heated particles appear to stretch almost horizontally in this plot.
In the absence of cooling, gas particles would be heated to the virial temperature of the halo they belong to; km s K (assuming as appropriate for a plasma of primordial composition). This corresponds to K for a galaxy with circular speed of km s. However, once the temperature of a shock-heated particle reaches about K, it crosses the boundary drawn by the cooling curve; cooling becomes very efficient and the particle is forced to remain at that temperature. Lost its pressure support, the gas collapses to the center of the halo, where it forms centrifugally supported disks such as that seen in Figure 2. At later times, as the density of the universe drops, particles are seen to “tunnel” past the cooling boundary to the virial temperature. Because for a primordial plasma cooling is not very efficient at K, particles that can reach these high temperatures remain there relatively undisturbed, forming a high-pressure, low density environment that surrounds the cold and dense disks.
As is clear from Figure 3, the amount of gas that cools in a galactic halo depends strongly on the redshift at which clumps with potential wells deeper than K collapse. If much of this collapse happens at the fraction of cooled gas is expected to be high. Gas accreted later finds it easier to tunnel past the K minimum in the cooling curve to high-temperatures, where cooling times are long. Gas in this hot-phase can remain in the halo for more than a Hubble time and would not participate in the formation of the main body of a galaxy. (We note that this conclusion depends sensitively on the primordial composition assumed. Cooling rates can be substantially boosted by metals at K; by more than an order of magnitude for solar composition. Therefore, a significant fraction of the gas in the hot atmosphere would be able to cool if it were sufficiently enriched by metals.)
Cooled gas sinks almost isothermally at K to the center of dark matter halos, increasing its density until the collapse is stopped by the formation of a centrifugally supported disk. Material in these disks is usually at kpc3. Since at these densities cooling dominates at essentially all for K, we shall adopt hereafter this value to distinguish between material in dense, centrifugally supported disks from infalling or pressure-supported gas. (For reference, kpc3 is about the baryonic density in the solar neighborhood, see Table 1-1 in Binney & Tremaine 1987.) At most of the gas () is in the central disk (Table 1). Note that this is a lower limit to the amount of cooled gas in the system, since it does not include the cold gas in small satellites orbiting around the central disk. Limited numerical resolution will also tend to decrease the total amount of cooled gas by preventing the collapse of low-mass clumps at high redshift, just when cooling is most effective. The effects of resolution can be assessed by reducing the number of particles in a run. Table 1 shows that, at , the effects of our limited resolution seem to be small. The fraction of gas in the central disk decreases from to just when the number of particles is reduced by a factor of 6 (compare runs and in Table 1). The effects of poorer numerical resolution are, however, more readily noticeable at higher redshift (see §3.23 below and Figure 5).
3.2.2 The effects of a UV background
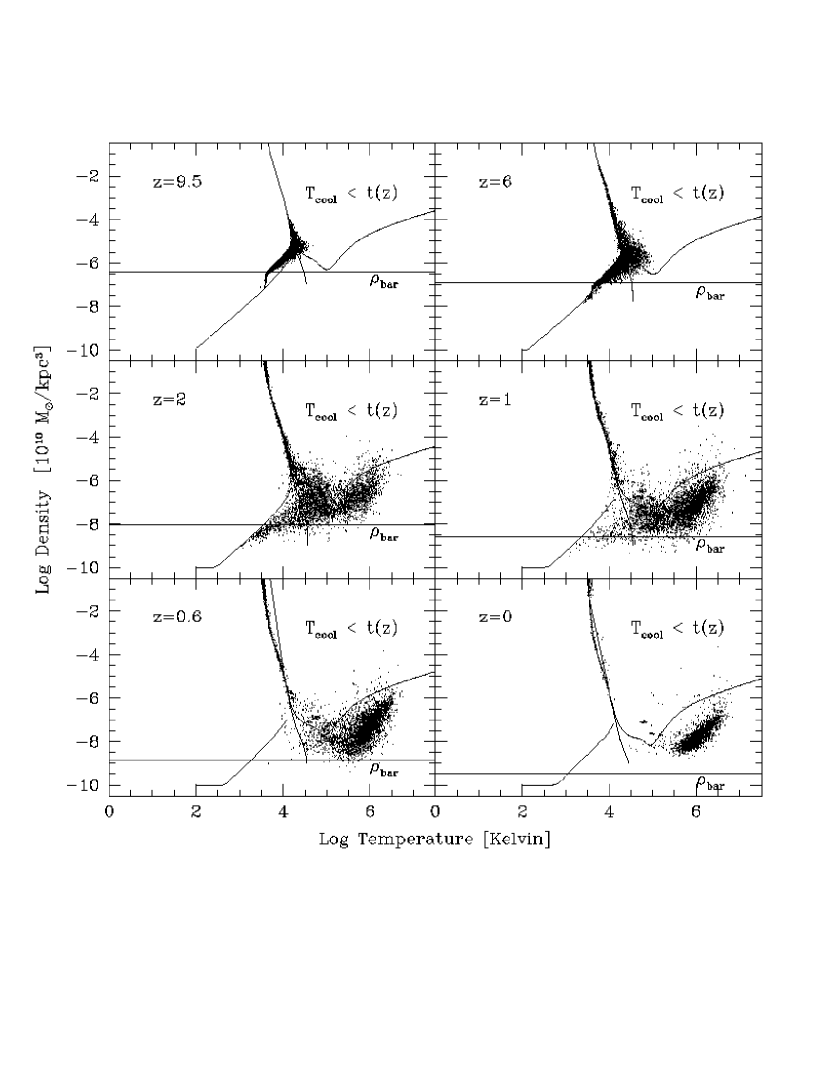
Figure 4 shows the - evolution of the gas once a UV background is included (, , run ). The horizontal line and the curve on the right are as in Figure 3. The cooling curve has been substantially modified relative to that in Figure 3 because hydrogen and helium are highly ionized and, therefore, cooling by recombination and collisional excitation are strongly suppressed. The curve on the left indicates where the photoheating timescale equals the age of the universe, and the nearly-vertical line indicates the equilibrium temperature (ie. where the cooling and heating rates balance out).
One of the main differences between runs with and without UV background is that in the former, the gas is photoheated to about K before it is accreted into resolved non-linear clumps. (Note that at that the gas is slightly cooler than the heating timescale would predict. This is due to the effect of Compton cooling, which is especially important at high ). At and the gas densities are still high enough for cooling by collisional processes () to dominate over heating by photoionization (). Cooling is quite efficient and practically all the gas that gets accreted into systems with virial temperatures K cools almost immediately to the equilibrium temperature. By the reduced cooling capabilities of low density gas become more evident; gas needs to be about one order of magnitude denser than the mean in order to cool efficiently, and denser still at lower redshifts. As a result, a significant fraction of the gas accreted into clumps at can reach the virial temperature of the final halo ( K) at relatively low overdensities. Because of its long cooling timescale, much of this gas remains hot and diffuse until . As we noted in §3.2.1, cooling times at K can be substantially shortened by the inclusion of metals. Introducing metals would thus counter the effects of photoheating, resulting in higher cooling efficiencies similar to those achieved in the absence of a UV radiation field.
This reduction in the cooling efficiency can be clearly seen by comparing the mass of the central disk in runs with and without UV background. The central disk mass is reduced by about by the inclusion of our fiducial photoionizing background. The reduction is more pronounced for more energetic radiation fields. In runs and (, ) the mass of the central disk is reduced by almost one-half. The disk masses at do not seem to be significantly affected by numerical resolution; on average, the low-resolution runs that include a UV background have the same disk mass as do the high-resolution models. We shall see below that the situation is different at higher redshifts, when the effects of numerical resolution become more pronounced.
3.2.3 The time evolution of cooled gas
The time evolution of the gas that cools is shown in Figure 5. Here we plot, as a function of , the mass of gas in dense disks (defined by kpc3, as discussed above), expressed as a fraction of the final gas mass of each system. Each curve is an average over all simulations with the same UV parameters. This figure confirms quantitatively the qualitative picture indicated by Figures 3 and 4. At there is little difference in the fraction of cooled gas regardless of the presence of a UV background. The rate at which gas cools subsequently, however, depends strongly on the intensity of the background. For our fiducial values of and , the influence of photoionization on the mass of cooled gas is negligible until . Later evolution is affected significantly more, but still the overall effect is mild and reduces the total fraction of cooled gas from to about . A harder background (, ) has a more noticeable effect, reducing the cooled fraction to about .
Figure 5 also illustrates the effects of numerical resolution. With fewer particles the collapse of low mass clumps at high- is not well resolved, causing a severe underestimate of the total amount of gas that can cool. As clumps get better resolved with time, the cooling rate accelerates in the low-resolution runs (symbols connected with dotted lines) and at the total fraction of cooled gas converges to the values found in the high-resolution runs. The effects of poor numerical resolution are, therefore, to delay the cooling and aggregation of gas into dense clumps. This may have undesirable consequences, for we shall see below that the rotational properties of the gas component depend sensitively on the timing and mode in which gas is accreted into the system.
We cannot rule out the possibility that even our high-resolution runs are affected by numerical limitations, especially at high redshift. From the discussion of Figure 3, we may expect that in the absence of a UV background the rate at which gas cools should in principle be limited only by the rate at which clumps with virial temperatures larger than K are formed. We can use the Press-Schechter theory to compute these rates. The mass fraction in clumps with masses larger than at redshift , subject to the constraint that it will form part of a halo of mass at , is given by (Bower 1991, Bond et al. 1991, Lacey & Cole 1993)
Here is the variance of the linear power spectrum at smoothed with a top-hat filter of radius enclosing a mass . ( is the mean density of the universe at .) The corresponding circular velocity is given by . The cumulative mass in clumps with km s, the circular velocity corresponding to a virial temperature of K, is shown in Figure 5 with dashed lines. The upper and lower curves correspond to the constraint that at all the mass should be in clumps with and km s, respectively. Note that the curves depend very weakly on circular velocity in the range probed by our simulations. If the cooled gas mass is determined principally by the rate at which gas is accreted into clumps with K we would expect at most a weak dependence on circular velocity. We shall see below that this is indeed the case.
The comparison between high- and low-resolution runs show that, as the numerical resolution improves, the curves corresponding to runs without a UV background approach the dashed lines. The vertical offset between these curves can then be interpreted as a measure of the effect of numerical limitations on the mass of cooled gas. We can reasonably expect that, were the resolution improved further, the curves with solid symbols would move closer to the dashed lines. Despite this potential deficiency, our simulations confirm that the cooling efficiency is indeed very high in the absence of a heating mechanism, as discussed in §1. They also show that limited numerical resolution always tends to reduce the efficiency of cooling. The curves in Figure 5 and the amounts quoted in Table 1 should therefore be viewed as lower limits on the mass of cooled gas, rather than as firm determinations. Estimates of the amount of cooled gas seem to be particularly vulnerable to numerical resolution at high redshift, when the typically smaller masses and sizes of halos make them more difficult to resolve adequately in a given simulation.
3.2.4 The mass of the central disk
Most of the gas that cools is rapidly accreted into the central disk, in good agreement with the results of Navarro & White (1994) and Navarro et al. (1995a). This is shown in Figure 6, where we plot the total mass of the central disk as a function of , the circular velocity at the virial radius . By definition, the total mass within is and . The solid and dotted lines represent, respectively, the dark matter and the gas mass within expected from our choice of baryon density; , and . Open circles are used for the runs without UV background, filled squares for the “” runs, and starred symbols for the “” runs.
This figure shows clearly that a large fraction of the gas mass in the system ends up in the central disk. The presence of a UV background can reduce the disk mass somewhat. The magnitude of the effect seems to be almost independent of the circular velocity of the system, affecting low mass halos almost as much as more massive systems. Tight correlations are observed between the circular velocity of the halo and the mass of the disk. Fits of the form have very small scatter; in log () for runs without background and in log (n=2.45) if our fiducial background is included. This small scatter is consistent with the small dispersion in the observed Tully-Fisher relation in log (Willick et al. 1995). We caution, however, against overinterpreting this result. The estimate of the scatter is based on eight simulations only. Also, the comparison with the Tully-Fisher relation assumes that disk mass is directly proportional to luminosity and that the circular velocity of the halo is identical to the rotation speed of the disk. Both of these assumptions may be incorrect (see Navarro, Frenk & White 1996 for a discussion). Nevertheless, the scatter found seems to be significantly smaller than predicted by the analytic arguments of Eisenstein & Loeb (1996). A larger set of simulations is needed in order to clarify the reasons for this discrepancy.
3.3 The angular momentum of gaseous disks
Figure 7 shows the specific angular momentum of the dark matter halos and of their central gaseous disks at , as a function of mass. The boxes indicate the loci corresponding to spiral and elliptical galaxies, as compiled by Fall (1983). The symbols are as in Figure 6. This figure shows clearly that the spins of gaseous disks formed in the absence of a UV background (open circles) are about an order of magnitude lower than that of their surrounding halos. This is a direct consequence of the formation process of the disks (Navarro et al. 1995a). Most of the disk mass is assembled through mergers between systems whose own gas component had previously collapsed to form centrally concentrated disks. During these mergers, and because of the spatial segregation between gas and dark matter, the gas component transfers most of their orbital angular momentum to the surrounding halos (Frenk et al. 1985, Barnes 1988, Quinn & Zurek 1988).
We illustrate this process in Figure 8, where we show the time evolution of the halo (dotted lines) and central disk (solid lines) of two different systems in the vs plane. The open circles correspond to , when each system had only a few hundred particles. Note that at this redshift the spins of halos and disks are similar. This is most likely an artifact of poor numerical resolution; at high redshift the collapse of gas in a system made of only a few hundred particles is artificially smooth and allows the gas to retain much of its angular momentum. As the mass of the system increases the angular momentum of the halo grows, following approximately the relation expected if halos at all times had roughly the same value of the dimensionless spin parameter (Barnes & Efstathiou 1987, Steinmetz & Bartelmann 1995). (Here is the total binding energy of the system.) The spin of the central disk does not follow the same relation, decreasing steadily as more of its mass is accreted in the form of mergers between systems that are well resolved numerically. We stress that the loss of angular momentum seems to be a sensitive function of numerical resolution. In the low-resolution runs the final spins of the disks are systematically higher (by up to a factor of ). Two factors contribute to this increase. (i) The collapse of a system of only a few hundred particles is artificially smooth, and (ii) the cooling and accretion of gas into the final disk are delayed (Figure 5). Both of these effects conspire to allow the gas component to retain more of its angular momentum in low resolution runs. We shall come back to this issue in §4.
Figure 7 shows that disks formed under the influence of a UV background suffer from the same angular momentum problem. Indeed, the spins of disks formed in the “” runs (solid squares) and in the “” runs (starred symbols) are on average even lower than those formed without a UV radiation field, exacerbating the discrepancy between observed spirals and the gaseous disks formed in the simulations. The reason why this problem is aggravated by the UV radiation field can be seen in Figure 9. This figure shows, for the disk in run , the correlation between the angular momentum of a gas particle at and the time at which that gas element is accreted into the disk. Particles accreted later clearly have larger angular momenta. This implies that disks grow from the inside-out, as mass accreted later settles at progressively larger radii from the center of the disk. As discussed in §3.2.3 (Figure 5), photoheating inhibits preferentially the late accretion of gas. This deprives the disk from its richest source of angular momentum and accentuates the discrepancy with observed spirals.
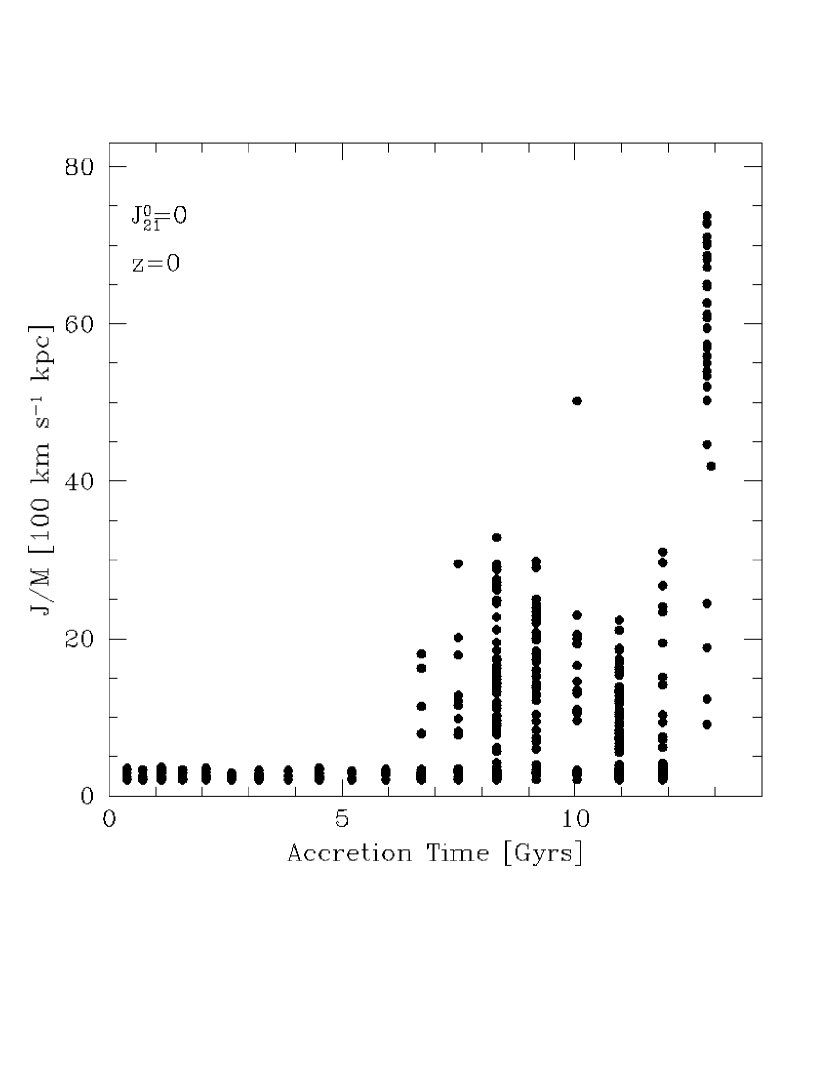
A different way to show that the spins of the gaseous disks are deficient compared with spirals is to compare their sizes with the luminous radii of spiral disks. As noted by Fall & Efstathiou (1980), if during the formation of the disk the gas conserves the same angular momentum as that of its surrounding halo, the size of the disks formed would be given approximately by , where is the half-mass radius of the dark halo and is the typical rotation parameter of the system. Figure 10 shows that this identification would predict a disk half-mass radius of kpc for a circular speed of km s(dotted line), in good agreement with observations of galaxies like the Milky Way. However, because the angular momentum content of gaseous disks is well below that of the halos (Figure 7) the half-mass radii of the disks is much smaller than those of spiral galaxies.
In summary, the assembly of gaseous disks through mergers leads to the formation of systems that are too concentrated or, alternatively, whose spins are too low to be consistent with observations of spiral galaxies. Photoionization seems only to exacerbate this problem.
4 Discussion
The simulations presented above indicate that the presence of a photoionizing background can have a significant influence on the amount of gas that can cool in galactic halos. For halos with circular velocities between and km s-1 the cooled gas fraction is in absence of a UV radiation field, and is reduced by up to when an extremely energetic background is included (, ). The reduction seems to be essentially independent of halo circular velocity in the range considered. Most of the reduction is due to the low cooling efficiency of gas that gets accreted late into systems with virial temperatures above K. At high redshifts the mass of cooled gas is independent of the UV background.
These results disagree somewhat with those of Thoul & Weinberg (1996), who concluded that above km sthe influence of photoionization would be negligible. The main discrepancy between their and our results seems to be in the cooled gas fraction obtained in absence of photoheating. These authors find that the cooled fraction is in systems with km s, and that it tends to decrease even further for larger . This is significantly lower than the average of gas that cools in our simulations, especially taking into account that this is likely to be a lower limit (see §3.2.3). The reason for the discrepancy may be the idealized 1- treatment of Thoul & Weinberg. Mass is accreted in this model by radial shells that successively turn around and collapse. The characteristic density of each shell then decreases with time. This differs markedly from the behavior illustrated in Figure 2, where we see that even mass that gets accreted “late” into the system may collapse at higher redshift into a different halo. This effect can conceivably lead to systematic underestimates in the cooling efficiency of gas in 1- simulations such as those of Thoul & Weinberg.
Quinn et al. (1996) find a cooled gas fraction of about in their simulations of a system with a circular speed of km ssystem at in the absence of photoionization. Their simulations use numerical techniques similar to ours and have only slightly worse resolution, so we would expect our results to compare favorably. Based on the results presented in Figure 5 we would have predicted a higher cooled gas fraction in their system, although this expectation is based on an uncertain extrapolation of our results to systems of lower mass and higher collapse redshifts that the ones we have considered. These authors also find that including the same extreme photoionizing background as ours (, ) can reduce the cooled gas fraction by more than , in good agreement with our results. With the caveat that Quinn et al. consider systems of different mass than ours and stop their simulations at , we conclude that our and their results are in reasonably good agreement.
Our results are also in qualitative agreement with those of Weinberg et al. (1996), who found that photoionization does not have a significant effect on the mass of cooled gas at , as long as numerical resolution effects are properly taken into account. The ionizing background chosen by these authors in their “high-resolution” simulation is weaker than our fiducial choice, so we would also predict no significant effects between runs with and without photoheating. This is especially true at , when these authors stopped their simulation.
Taken together, all these results imply that the collapse and cooling of gas in galactic halos can be at most moderately affected by the inclusion of a photoionizing background. In systems with circular speeds as low as - km sat least of the gas would be able to cool even if an extremely hard UV background were present. The magnitude of this effect is much smaller than needed in order to reconcile the large number of low-mass halos predicted by hierarchical clustering models with the relative paucity of dwarf galaxies in the local universe. According to the analysis of Cole et al. (1994, see their Figure 2b), the fraction of gas that can cool and form stars should be reduced to less than about in systems with km sand to in systems with km sin order to reconcile the shape of the galaxy luminosity function with the halo mass function in the Cold Dark Matter scenario.
Photoionization effects also prove ineffective at alleviating the angular momentum problem of gaseous disks assembled in hierarchical scenarios. By reducing preferentially the late accretion of mass into disks (Figure 5) photoheating reduces further the already low spin of gaseous disks formed through mergers. It is important to prove that this result is not the consequence of some subtle numerical effect, especially because the disks reported in the simulations of Katz & Gunn (1991), Vedel et al, (1994), Steinmetz & Müller (1995), and Evrard, Summers & Davis (1994) allegedly have sizes and spins consistent with observed spirals even though they used similar numerical techniques to the ones we used here.
To reason for this apparent discrepancy is that the transport of angular momentum from the gas to the dark matter during mergers is a sensitive function of the degree of spatial segregation between gas and dark matter in the merging protogalaxies. Therefore, the final spin of the gaseous disk depends on (i) the importance of mergers in the assembly of the mass of the system, and on (ii) the gas fraction that had collapsed to the center of the protogalaxies previous to each merger event. The initial conditions adopted by Katz & Gunn (1991), Vedel et al (1994), and Steinmetz & Müller (1995) (overdense, homogeneous spheres endowed initially with solid-body rotation and perturbed with small scale density fluctuations) emphasize the role of coherent collapse during the formation of the system and minimize the role of mergers. The disagreement with the results of Evrard et al. (1994) is, on the other hand, likely to be numerical in origin. Most of the systems analyzed by Evrard et al. (1994) have only a few hundred particles. As noted when discussing Figure 8, the collapse of systems of only a few hundred particles is artificially smooth and allows the gas to retain much of its angular momentum. Only when the proper initial conditions are used and the numerical resolution is adequate does the discrepancy between the spins of gaseous disks and those of spiral galaxies become apparent.
Another numerical effect which could in principle lead to artificially small disk sizes is the use of an artificial viscosity term in the SPH equations of motion. Introduced in order to model shock waves, it is usually implemented so as to damp the relative (approaching) motion of any two neighboring gas particles. This implies that in a gaseous disk differential rotation is seen by neighboring particles at slightly different radii as convergent motions and consequently damped. The result is an artificial transfer of angular momentum to the outer regions of the disk. Mass is channelled inwards in order to conserve angular momentum, leading to the formation of disks with artificially high central concentrations. This is a concern not only because it could affect adversely the spatial structure of the disks, but also because it could conceivably lead to enhanced losses of angular momentum during mergers (disks that are artificially small will take longer to merge and may lose more angular momentum in the process). These concerns prompted us to use a shear-corrected implementation of the artificial viscosity. (See Appendix A for a full description of the artificial viscosity used and the tests performed.) This correction essentially eliminates the viscous angular momentum transport in disks. We conclude that the angular momentum deficit of gaseous disks in our simulations are of physical, rather than numerical, origin.
As discussed in §2.3, we expect the strength of the UV background adopted in the simulations to be reasonably consistent with observations at intermediate and high redshifts. At very high () and very low () redshifts, however, the observational constraints are quite poor. We believe, however, that our results are fairly insensitive to most reasonable variations of the ionization history at these epochs. At the density of the universe is so high that the efficiency of cooling is hardly affected by the UV background. At lower redshifts the situation is also unlikely to change. Most of the gas that is prevented from cooling by the presence of the UV radiation field ends up in a low density, hot halo where the cooling times are longer than a Hubble time (see Figures 3 and 4). At these temperatures the main cooling mechanism is bremsstrahlung and, consequently, independent of the UV field. We do not expect our conclusions to change dramatically for any plausible variations of the UV background strength.
We conclude that photoionization cannot provide the heating mechanism desired to bring hierarchical galaxy formation models into agreement with observations. A different heating process such as feedback effects related to star formation and evolution must therefore be invoked. Parameterizations of this feedback mechanism by White & Frenk (1991), Cole et al. (1994) and Kauffmann et al. (1994) show that this procedure can in principle work. Unfortunately, because of our primitive understanding of the process of star formation, such mechanism can only be introduced in our numerical schemes only in the form of numerical “recipes” containing a number of free parameters. Only a painfully exhaustive search of the parameter space seems likely to provide new insights into the complex process of the formation of galaxies in hierarchical clustering models.
5 Summary
We have presented numerical simulations designed to investigate the influence of a photoionizing background on the formation of disk galaxies in hierarchically clustering universes. These simulations span the mass range of typical galaxies ( km s km s), follow the evolution of systems until , and have better numerical resolution than earlier studies. The main results of our simulations can be summarized as follows.
1) In the absence of a UV photoionizing background most of the gas () in galactic halos cools and assembles into cold, dense, centrifugally supported disks. The presence of a UV background can reduce the amount of gas that cools, but the effect seems to be mild () for our fiducial choice of background (). Cooled gas masses can be reduced by up to a factor of for an extreme version of the background (). The magnitude of this effect is insufficient to reconcile the shape of the galaxy luminosity function with the mass function of dark matter halos.
2) The influence of the UV background seems to be largely independent of circular velocity, at least in the range, km s km s, probed by our simulations. We interpret this as implying that the effect of the background depends principally on the rate at which the mass that makes up the final system gets accreted into clumps with virial temperatures higher than K collapse. This is essentially independent of in the range considered.
3) The UV radiation field affects primarily the late infall of gas and has negligible influence on the amount of cooled gas at high redshift (). Since disks grow inside-out, accreting the outer, high-angular momentum regions at late times, the ionizing radiation tends to reduce the total spins and sizes of gaseous disks assembled at the center of dark matter halos. This exacerbates the angular momentum problem of gaseous disks assembled in hierarchical clustering scenarios.
We conclude that a different heating mechanism needs to be invoked in order to bring hierarchical models of galaxy formation into agreement with observations. The energy feedback of evolving stars and supernovae seems the most obvious and attractive alternative, implying that an improved understanding of galaxy evolution is intimately related to progress in our understanding of star formation and of the interaction between evolving stars and the interstellar medium. The effects of star formation are thus crucial ingredients of any successful model of galaxy formation.
Appendix A Shear-corrected artificial viscosity for SPH
Numerical methods based on a differential formulation of hydrodynamics conservation laws such as SPH and first-generation finite difference methods usually rely on artificial viscosity terms in order to deal with shock-wave discontinuities (see, eg., Potter 1973). Numerically, these terms aim to mimic the basic physical properties of shocks, generating entropy at shock fronts and transforming kinetic energy into internal energy, preferably with minimum post-shock oscillations in the hydrodynamical variables. Following von-Neumann & Richtmyer, the artificial viscosity is usually restricted to compressive flows (), and assumed to be proportional to some power of . With this definition the artificial viscosity should vanish in pure shear flows ( and ).
The most widely used formulation of artificial viscosity in SPH is that of Monaghan and Gingold (1983), who approximate by interparticle velocity differences. The viscous contribution to the pressure gradient on particle due to particle is given by , where is the mass of particle , is the interpolating kernel, is the smoothing length, and is given by
| (A3) | |||||
| (A4) |
Here and are the arithmetic means of the sound velocity and the density , respectively, at the locations of particles and . The parameter is introduced to prevent numerical divergences. and are free parameters that control the amplitude of post-shock oscillations. For problems involving strong shocks the choice and is appropriate, but and are also widely used. The Monaghan–Gingold viscosity gives satisfactory results in test cases, even for strong shocks (Steinmetz & Müller 1993). Its main disadvantage, however, is that it does not necessarily vanish in shear-dominated flows, when , but . This is because neighboring particles across the shear surface have a non-zero velocity component along the line joining their centers. This results in a non-zero divergence estimate and a non-vanishing viscosity term, . This spurious shear viscosity is especially important when the number of particles, , used is small, since (or depending on which term dominates in eq. A1) and typically the smoothing length is chosen so that .
In order to assess the effects of the spurious shear viscosity on the structure of a centrifugally supported gaseous disk we devised the following test. A homogeneous, isothermal ( K) gas sphere is allowed to collapse in the potential well of a dark matter halo, which is modeled as a spherically symmetric external potential with a radial structure given by the density profile proposed by Navarro, Frenk & White (1995b) for Cold Dark Matter halos. The total mass of the gas component is and its initial radius is 100 kpc. The dark matter potential is characterized by a circular speed of km sat the virial radius. The gas is initially set in solid-body rotation with a total angular momentum consistent with a spin parameter . This is larger than the typical value of found in our simulations. Since the gas temperature is well below the virial temperature of the system, the gas collapses quickly to form a centrifugally supported disk. Because of the spherical symmetry assumed for the dark matter potential and the high angular momentum of the gas (which ensures that the disk is not self-gravitating) we do not expect non-axisymmetric perturbations to develop. The disk should remain stationary after the collapse, except for numerical viscous effects.
A sensitive measure of the effects of shear viscosity is the ratio between the half-mass radius of the disk and the radius that contains half its total angular momentum. We denote this ratio by . This is because as shear viscosity transports angular momentum outwards it also brings material inwards in order to conserve the total angular momentum. The two upper panels in Figure 11 show the evolution of when the standard viscosity formulation is used (eq. A1). Each run is followed for a total of yrs, slightly less than the age of the universe at . Time in this figure is given in units of the time required to complete a full rotation at the half-mass radius of the disk ( yrs). The ratio is normalized to the value just after the formation of the disk. The different symbols correspond to runs with different numbers of particles. It is clear from these two panels that the shear viscosity can alter substantially the structure of the disk. For , halves in about 6 rotations; only for as large as particles the disk remains relatively unchanged over a Hubble time.
The results presented in the upper panels of Figure 11 are particularly worrying because, although the disks analyzed in this paper have particles at , they contain fewer particles at higher . It is very likely then that the structure of the disks at can be unduly influenced by the poorer resolution prevalent at higher redshifts. Motivated by this effect, we decided to modify the formulation of the artificial viscosity in order to reduce its shear component. Following Balsara (1995), we define a “shearfree” viscosity by
The term has been introduced to prevent divergences. In case of a shear-free, compressive flow (, ), and eq. A3 reverts to the usual Monaghan & Gingold formulation (eq. A1). In the presence of shear flows, and the importance of the viscous term is reduced. The suppression factor is an order of magnitude estimate of the irrotational component of the flow. In case of a pure shear flow ( and ), vanishes and the viscosity is completely suppressed. (We note that this is not the only shear-reducing correction that has been implemented. Hernquist & Katz (1989) discuss an alternative formulation. Our tests show, however, that compared with eq. A3 their implementation leads to a less sharp definition of shock fronts.)
The effect of implementing such correction on the evolution of disks is shown in the lower panels of Figure 11. The viscous transport has been almost completely suppressed, and disks with as few as particles can be evolved safely for about a Hubble time. Figure 12 summarizes the dependence of viscous effects on and on the constants and . Here we plot the evolutionary timescale (, measured from Figure 11) as a function of the number of particles in the disk. Note that scales roughly as , indicating that the term dominates in eq. A1. As expected, is inversely proportional to and , increasing by about a factor of 2 when and are halved. We conclude that by using the shearfree formulation of the artificial viscosity (with the usual values and ) we can prevent the viscous angular momentum transport from having an appreciable effect in our simulations.
| Label | ||||||||||
|---|---|---|---|---|---|---|---|---|---|---|
| [] | [kpc] | [km/s] | [] | [] | [] | |||||
| 1 | 0.0 | 52.0 | 208.5 | 103.7 | 5400 | 5313 | 49.35 | 2.64 | 2.44 | |
| 0.0 | 56.5 | 214.3 | 106.4 | 1053 | 958 | 53.39 | 3.09 | 2.58 | ||
| 1.0 | 5.0 | 49.93 | 205.6 | 101.6 | 4500 | 5139 | 47.73 | 2.20 | 1.74 | |
| 2 | 0.0 | 41.2 | 192.8 | 95.8 | 4806 | 4180 | 38.83 | 2.35 | 2.13 | |
| 0.0 | 41.8 | 194.5 | 96.2 | 805 | 708 | 39.46 | 2.36 | 2.13 | ||
| 1.0 | 5.0 | 38.39 | 188.4 | 93.54 | 4050 | 3920 | 36.41 | 1.98 | 1.65 | |
| 3 | 0.0 | 25.2 | 162.0 | 81.7 | 2802 | 2561 | 23.79 | 1.37 | 1.31 | |
| 0.0 | 24.9 | 164.7 | 70.3 | 457 | 422 | 23.52 | 1.34 | 1.28 | ||
| 1.0 | 5.0 | 21.03 | 154.3 | 76.5 | 2311 | 2143 | 19.91 | 1.13 | 0.63 | |
| 1.0 | 5.0 | 24.93 | 165.5 | 80.5 | 368 | 343 | 19.12 | 1.08 | 0.55 | |
| 4 | 0.0 | 30.6 | 174.6 | 86.7 | 3620 | 3100 | 28.80 | 1.77 | 1.34 | |
| 0.0 | 34.8 | 182.7 | 90.4 | 678 | 588 | 32.77 | 1.99 | 1.21 | ||
| 1.0 | 5.0 | 30.03 | 173.5 | 86.3 | 3007 | 3075 | 28.56 | 1.47 | 1.05 | |
| 1.0 | 5.0 | 33.37 | 180.0 | 89.4 | 549 | 570 | 31.77 | 1.61 | 1.07 | |
| 10.0 | 1.0 | 30.20 | 173.9 | 86.5 | 2659 | 3112 | 28.91 | 1.30 | 0.744 | |
| 5 | 0.0 | 234.3 | 344.0 | 171.1 | 4410 | 5217 | 224.3 | 9.98 | 8.82 | |
| 0.0 | 228.9 | 347.9 | 168.2 | 765 | 847 | 218.6 | 10.39 | 9.05 | ||
| 1.0 | 5.0 | 230.7 | 342.3 | 170.3 | 3927 | 5159 | 221.9 | 8.89 | 4.89 | |
| 1.0 | 5.0 | 227.5 | 341.1 | 169.4 | 617 | 849 | 219.1 | 8.38 | 6.34 | |
| 10.0 | 1.0 | 233.1 | 343.5 | 170.9 | 4900 | 5163 | 222.0 | 11.1 | 5.03 | |
| 6 | 0.0 | 212.7 | 333.4 | 165.7 | 4085 | 4731 | 203.5 | 9.25 | 7.59 | |
| 0.0 | 229.8 | 342.6 | 169.9 | 843 | 846 | 218.3 | 11.45 | 9.15 | ||
| 1.0 | 5.0 | 213.7 | 336.0 | 165.4 | 3654 | 4776 | 205.4 | 8.27 | 5.45 | |
| 1.0 | 5.0 | 225.4 | 342.6 | 168.2 | 695 | 837 | 216.0 | 9.44 | 6.59 | |
| 7 | 0.0 | 336.3 | 388.2 | 192.9 | 7255 | 7439 | 319.9 | 16.42 | 13.41 | |
| 0.0 | 383.4 | 405.9 | 201.6 | 1328 | 1416 | 365.4 | 18.04 | 14.06 | ||
| 1.0 | 5.0 | 342.4 | 393.1 | 193.5 | 6495 | 7620 | 327.7 | 14.7 | 9.31 | |
| 1.0 | 5.0 | 381.8 | 407.7 | 200.8 | 1117 | 1421 | 366.7 | 15.17 | 6.76 | |
| 8 | 0.0 | 253.3 | 353.1 | 175.7 | 5669 | 5593 | 240.5 | 12.83 | 9.80 | |
| 0.0 | 208.8 | 334.2 | 163.8 | 798 | 767 | 197.9 | 10.84 | 9.71 | ||
| 1.0 | 5.0 | 240.3 | 349.3 | 171.9 | 5084 | 5530 | 229.2 | 11.1 | 5.61 | |
| 1.0 | 5.0 | 210.4 | 334.3 | 164.5 | 613 | 783 | 202.0 | 8.32 | 6.45 |
References
- (1) Balsara, D.S. 1995, J. Chem. Phys., 121, 357.
- (2) Barnes, J. 1988, ApJ, 331, 699.
- (3) Barnes, J. & Efstathiou, G. 1987, ApJ, 319, 575.
- (4) Bechtold, J. 1995, in the Proceedings of the ESO Workshop: QSO Absorption Lines, ed. G. Meylan, (Berlin: Springer).
- (5) Binney, J. & Tremaine, S. 1987, Galactic Dynamics, (Princeton: Princeton University Press).
- (6) Bond, J.R., Kaiser, N., Cole, S., & Efstathiou, G. 1991, ApJ, 379, 440.
- (7) Bower, R.G. 1991, MNRAS, 248, 332.
- (8) Cen, R. & Ostriker, J.P. 1992, ApJ, 393, 22.
- (9) Cole, S.M. 1991, ApJ, 367, 45.
- (10) Cole, S.M., Aragón-Salamanca, A., Frenk, C.S., Navarro, J.F., & Zepf, S.E. 1994, MNRAS, 271, 781.
- (11) Dekel, A., & Silk, J. 1986, ApJ, 303, 39.
- (12) Efstathiou, G.P. 1992, MNRAS, 456, 43p.
- (13) Efstathiou, G.P., Davis, M., Frenk, C.S., & White, S.D.M. 1985, ApJS, 57, 241.
- (14) Eisenstein, D.J. & Loeb, A. 1996, ApJ, 459, 432.
- (15) Evrard, A.E., Summers, F.J., & Davis, M. 1994, ApJ, 422, 11.
- (16) Fall, S.M. 1983, in Internal Kinematics and Dynamics of Galaxies, Athanassoula E. (ed.), (Dordrecht: Reidel), p. 391.
- (17) Fall, S.M. & Efstathiou, G. 1980, MNRAS, 193, 189.
- (18) Frenk, C.S., White, S.D.M., Efstathiou, G.P., and Davis, M. 1985, Nature, 317, 595.
- (19) Hernquist, L. & Katz, N. 1989, ApJS, 70, 419.
- (20) Katz, N. & Gunn, J. 1991, ApJ, 377, 365.
- (21) Kauffmann, G. & White, S.D.M. 1993, MNRAS, 261, 921.
- (22) Kauffmann, G., White, S.D.M., & Guiderdoni, B. 1994, MNRAS, 267, 981.
- (23) Lacey, C.G., & Cole, S.M. 1993, MNRAS, 262, 627.
- (24) Lacey, C.G., & Cole, S.M. 1994, MNRAS, 271, 676.
- (25) Monaghan, J.J. 1992, ARA&A, 30, 543.
- (26) Navarro, J.F., & Benz, W. 1991, ApJ, 380, 320.
- (27) Navarro, J.F., & White, S.D.M. 1994, MNRAS, 267, 401.
- (28) Navarro, J.F., Frenk, C.S., & White, S.D.M. 1995a, MNRAS, 275, 56.
- (29) Navarro, J.F., Frenk, C.S., & White, S.D.M. 1995b, MNRAS, 275, 720.
- (30) Navarro, J.F., Frenk, C.S., & White, S.D.M. 1996, ApJ, 462, 563.
- (31) Potter, D. 1973, Computational Physics (New York: Wiley).
- (32) Press, W.H., & Schechter, P. 1974, ApJ, 187, 425.
- (33) Rees, M.J. & Ostriker, J.P. 1977, MNRAS, 179, 541.
- (34) Quinn, P.J. & Zurek, W.H. 1988, ApJ, 331, 1.
- (35) Quinn, T., Katz, N. & Efstathiou, G. 1996, MNRAS, 278, L49.
- (36) Silk, J. 1977, ApJ, 211, 638.
- (37) Steinmetz, M. 1995, in Proc. 17th Texas Symposium on Relativistic Astrophysics, Annals of the New York Academy of Science, Vol. 759, p. 628.
- (38) Steinmetz, M. 1996, MNRAS, 278, 1005.
- (39) Steinmetz, M. & Bartelmann, M. 1996, MNRAS, 272, 570.
- (40) Steinmetz, M. & Müller, E. 1993, A&A, 268, 391.
- (41) Steinmetz, M. & Müller, E. 1995, MNRAS, 276, 549.
- (42) Sugimoto, D., Chikada, Y., Makino, J., Ito, T., Ebisuzaki, T. & Umemura, M. 1990, Nature, 345, 33.
- (43) Thoul, A. & Weinberg, D.H. 1996, ApJ, in press.
- (44) Vedel, H., Hellsten, U. & Sommer-Larsen, J. 1994, MNRAS, 271, 743.
- (45) Weinberg, D., Hernquist, L. & Katz, N. 1996, ApJ, submitted.
- (46) White, S.D.M., & Rees, M.J. 1978, MNRAS, 183, 341.
- (47) White, S.D.M., and Frenk, C.S. 1991, ApJ, 379, 25.
- (48) Willick J.A., Courteau, S., Faber, S.M., Burstein, D. & Dekel, A. 1995, ApJ, 446, 12.