10.07.2; 11.05.1; 11.09.1 NGC 5018
M. Hilker
The globular cluster system of an “old” merger: NGC 5018 ††thanks: Based on data collected at the European Southern Observatory, La Silla, Chile
Abstract
We study the properties of the globular cluster system of the “old” merger NGC 5018. We detect a relatively poor globular cluster system, that can be divided into at least two populations based on colors: a small population of blue clusters, aged between several hundred Myr to 6 Gyr, the formation of which was probably induced by the last interaction in the galaxy group; and one (possibly two) population(s) of old(er) clusters that can be associated with the original galaxy(ies).
This composite globular cluster system is as elliptical () as the best oblate model for the luminous component (about E6), but as diffuse as the dark halo implied by the same model. In terms of a power law slope, we find a fall-off of for the globular cluster density profile, while the intensity of the stellar light falls off with .
We sample the globular cluster luminosity function down to mag, and do not reach the turnover. Fits to our data with Gaussians and functions can only constrain the turn-over to mag. The total number of globular clusters derived from the luminosity function and the surface density profile of the globular clusters lies then between and . The amount of young globular clusters is estimated to be less than 10% of the total, evidence against a significant increase of globular clusters by the merger event in this case.
The specific frequency, for which uncertainties in distance and total number cancel, is , lower than expected for a normal elliptical galaxy. However, if the reported young luminous stellar population would brighten NGC 5018 by one magnitude compared with normal ellipticals, the corrected value would be about 3, comparable with values found for ellipticals in small groups.
Finally, the study confirms that NGC 5018 contains a large amount of dust. The globular clusters might even reveal a dust concentration.
keywords:
globular cluster systems – globular clusters – elliptical galaxies – galaxies: individual: NGC 50181 Introduction
With the study of globular clusters in interacting and merging galaxies, globular cluster systems gain in importance for the understanding of the evolutionary history of elliptical galaxies. Properties like the luminosity function, specific frequency, morphology, and color distribution of a globular cluster system contain information on the globular cluster formation history, as well as on the distance and history of the parent galaxy. Several hypotheses about the formation of globular clusters and globular cluster systems are discussed in the literature (e.g. Harris 1991, 1994 and Richtler 1995 for reviews, Ashman & Zepf 1992 for formation in mergers). Besides primordial formation of globular clusters there are also indications that the formation can be triggered by interactions between galaxies like merging and/or accretion of dwarf galaxies. The study of ellipticals showing indications of merging events or interactions provides the possibility to get a direct insight into the building up of globular cluster systems.
Examples of young globular clusters in recent merger galaxies are becoming more numerous (e.g. NGC 3597: Lutz 1991; NGC 1275: Holtzman et al. 1992; NGC 7252: Whitmore et al. 1993, Schweizer & Seitzer 1993; He2-10: Conti & Vacca 1994; NGC 4038/4039, Whitmore & Schweizer 1995). NGC 5018, that underwent an interaction about 1 Gyr ago, might be a similar system, probably even older than the previous examples.
NGC 5018 is the brightest member of a small group of 5 galaxies (Gourgoulhon et al. 1992). It is classified as a “normal” giant elliptical (E4 in the RSA survey; E3 in the RC3 catalog) but shows several indications for a past merger event. Some properties of NGC 5018 are summarized in Table 1.
| Name | NGC 5018 |
|---|---|
| RA(2000) | 13 13 01 |
| DEC(2000) | 19 31 12 |
| l, b | 309.9, 43.1 |
| type | E3 |
| mag | |
| 0.92 mag | |
| 1.05 mag |
Both Carollo & Danziger (1994) and Goudfrooij et al. (1994b) investigated in detail the photometric profile of NGC 5018 out to and found similar results. The color of the galaxy is very blue (, Goudfrooij et al. 1994b), and the color gradient is steeper than normally observed in ellipticals. This led Carollo & Danziger (1994) to conclude that either the galaxy is very blue in the outer parts, or that the whole galaxy is rather blue and obscured and reddened in the inner part (where the boundary between inner and outer parts is at about radius). Our study excludes this inner part. Both also agree that, despite a probably complicated dust distribution in the inner region, the isophotes are disky at all radii (note that this is not in contradiction with a merger event, e.g. Lima-Neto & Combes 1995).
NGC 5018 is also peculiar in having one of the lowest nuclear magnesium absorption-line strengths for its absolute magnitude (Schweizer et al. 1990). However, if the Mg2 index profile (Carollo & Danziger 1994), that shows a strong decrease down to solar values inside 7\arcsec from the center, is extrapolated to outer radii it reaches again values normal for the luminosity of NGC 5018. This suggests the presence of a young stellar population in the central region, diluting the Mg2 index. In that case NGC 5018 could be considered as a “classical” merger remnant. This also is strengthend by the presence of prominent ripples and shells (e.g. Schweizer 1987). Schweizer & Seitzer (1992) attribute to NGC 5018 one of the highest fine structure parameters, making it one of the best merger candidates, and derive a heuristic merger age from colors of Gyr.
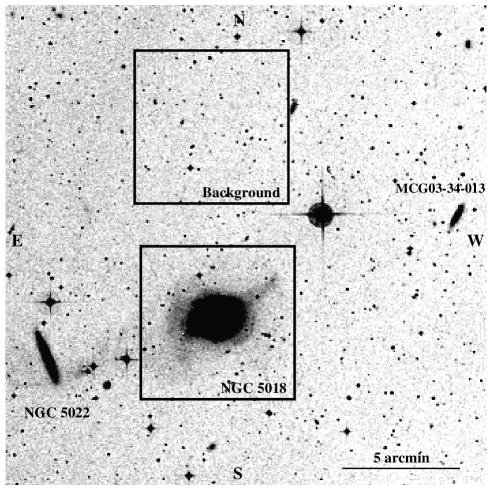
Deep HI observations with the VLA by Guhathakurta et al. (1989) show a large HI bridge between NGC 5022 and MCG 0334013, the galaxies situated to the E and NW of NGC 5018 (see Fig. 1). The authors claim it to be the first direct observational evidence for the formation of a shell system when an elliptical galaxy merges with a cold disk system, in a (at least) three-body encounter. They derive from dynamical arguments a relatively recent last interaction, about 600 Myr ago, that produced the HI plume, and an orbital time for the outermost shell of 300 Myr.
Dynamical investigations show that NGC 5018 has a relatively high velocity dispersion (, Davies et al. 1987) but a flat velocity dispersion gradient. To reproduce this flat gradient a massive, diffuse dark halo is required which is half as flattened (about E3) as the best fitting oblate dynamical model of the galaxy light (about E6, see Carollo et al. 1995, Carollo & Danziger 1994). Also the HI velocity data (Kim et al. 1988) support the existence of an substantial amount of dark matter in the galaxy group around NGC 5018.
2 Observations and Reduction
2.1 The observations
Deep Bessell (ESO # 451) and Gunn (ESO # 461) CCD images were taken in direct imaging mode with the Danish 1.54m telescope at the European Southern Observatory, La Silla, Chile during the night of 23/24.4.1995 under photometric and good seeing conditions (between and , as measured from the FWHM of stellar images). The CCD chip in use was a Tektronix chip (ESO #28) pixels; the scale is per pixel, giving a field size of . We obtained respectively five 10 and five 12 min exposures in and centered on NGC 5018. Short exposures of 1 min were taken in both filters to compare our photometry with the published aperture photometry of the galaxy (Poulain & Nieto 1994) and check the zero point of our calibration. An additional background field, located north of NGC 5018 (see Fig. 1), was observed to get an estimation of the contribution of background objects in the NGC 5018 field. Bias- and sky-flatfield exposures were taken at the beginning and end of the night. Landolt (1992) standard fields were observed throughout the night for the photometric calibration.
2.2 The reduction
All the reductions were done in IRAF. Bias subtraction and sky flat-fields led to satisfactory (flatter than 1%) images. The different long exposures were combined with a sigma clipping algorithm to clean the master exposures of cosmic rays.
Object search, photometry, and the determination of the completeness factors were done with the IRAF version of the DAOPHOT II package. Before applying the final point-source search and PSF fitting, we prepared the master exposures in each filter by the following procedure. First we subtracted from the image the brightest stars and extended objects with the IRAF imedit routine. Then we computed an isophotal model (using the IRAF STSDAS isophote package) that we subtracted from our cleaned image. The shells, dust lanes and ripples were then visible as residuals. To remove also these structures we first subtracted all point-source objects by the standard DAOPHOT II PSF fitting. Then we applied a 11 11 pixel median filter to the image. The sum of the isophotal model and the median image was subtracted from the original master exposures, leading to a flat background image ready for the final point-source search. We checked that no systematic offset was introduced in the photometry by this procedure. Due to model fitting residuals and the very complex structure in the center of the galaxy we did not consider the innermost 30\arcsec radius.
The calibration was done via typically 40 standard stars from the Landolt (1992) list by which we transformed our colors to Johnson and Cousins . The calibration agreed well with the aperture photometry values published by Poulain & Nieto (1994). The mean residuals for and are 0.014 and 0.015 respectively. Typical errors in color at the faintest magnitudes are about 0.19 mag, about 0.14 mag at , and drop below 0.10 mag for .
The determination of the completeness was done by standard artificial star experiments. The completeness starts to affect the results at magnitudes of 24.0 mag in and 23.0 mag in for the NGC 5018 field and 23.8 mag in and 22.6 mag in for the background field. The limiting magnitudes where the completeness factor has dropped down to 50 % (we used this limit for our investigations) are 24.9 mag in , 23.7 mag in for the galaxy field, 24.4 mag in and 23.3 mag in for the background field.
3 Colors
In this section we derive the mean colors of the globular clusters as well as features in the color distribution. Background galaxies can be identified by their second moments of intensities down to . In the following we will use the term “objects” for objects obeying this coarse selection, i.e. evident galaxies are rejected.
The color distribution for all the objects in the field detected in and is shown in figure 2, where the dashed lines mark our 80% completeness limits in the and filters.

3.1 Existence of a dust lane?
We plotted the spatial distribution of objects of different colors. The distribution of blue, , objects as well as red, , objects is shown in figure 3, together with a contour plot of NGC 5018. The first group is chosen to be bluer than most background objects, and the second to be redder than most globular clusters.

Two features appear in these plots: blue objects are totally missing in a stripe extending from the South-East corner to the North of the galaxy (0 objects out of 57, in a lane representing 18% of the surface), while red objects are overabundant in this stripe (34 objects out of 125, or 27% of the objects on 18% of the surface).
We checked for any flatfield or reduction effect, as well as
any similar feature in the background field, but could not find any.
We exclude the possibility that the inhomogeneous distribution of objects of
different colors could be due to random fluctuations in the spatial
distribution. The probability for a configuration as we see it is very
small, since the “blue” and “red” distributions shown above
represent already 3 and fluctuations on their own, and are
correlated to each other as well as with the HI distribution as shown
below.
We are thus confident that this effect is real, and see two possible
explanations:
different populations of globular clusters have an inhomogeneous
distribution in NGC 5018. Or,
there is a strong reddening along this stripe, e.g. a dust
lane.
The first hypothesis is supported by various facts. As will be shown below, an unrealistic assumption for the gas-to-dust ratio would have to be made to reconcile the HI observations with the existence of a dust lane. Moreover, the possible extinction could not be clearly seen in the galaxy light on our color image (note however, that this is not trivial, considering the amount of structure surrounding NGC 5018 and the fact that it occurs where the surface brightness drops). Also, the inhomogeneous spatial distribution of the objects could be a remnant of the merger event: Guhathakurta et al. (1989) noticed that the HI bridge connecting NGC 5022 and MCG 0334013 seems to bifurcate at approximately the position and radial velocity of NGC 5018, and while the northern part continues unbroken, the southern portion disappears near the elliptical. This could have lead to an inhomogeneous distribution of the globular clusters, if for example they formed from the infalling gas in the southern region, where indeed the blue objects are seen. However this would not explain the over-density of red objects in the northern part.
The second hypothesis, the presence of a dust concentration, is supported by the following points. The large HI bridge between NGC 5022 and MCG 0334013 (Guhathakurta et al. 1989), crosses our frame exactly along the stripe suspected to be dust (see their Figure 1). However the column density in the bridge is around several (Guhathakurta priv.com.) which, using the hydrogen column density to color excess ratio in our Galaxy of (Bohlin, Savage and Drake 1978), would give an reddening of , far too small to produce the effect of several tenths of magnitudes in observed, unless the gas-to-dust ratio is higher by about two orders of magnitude (i.e. 1 to 5) than in our Milky Way.
Further, emission at m and m at an intensity of about 1 Jy was detected with the IRAS satellite. The derived temperature of the infrared emission was below 30 K, leading to the assumption that this elliptical galaxy possibly contains cold interstellar gas (Knapp et al. 1989). Unfortunately, even the HIRAS maps (processed IRAS images for a higher resolution of 1 arcmin) at m and m do still not have the required resolution to locate the dust in NGC 5018.
Finally, the isophotal shape and the distribution of ionized gas and dust have been extensively studied by Goudfrooij et al. (1994a, 1994b) and Goudfrooij & de Jong (1995). They noticed that the overall visible optical extinction is about 1 magnitude smaller than expected from the high IRAS flux, and might be caused by a diffuse distribution of dust, probably accreted from other galaxies.
We have at this stage no reason to prefer one scenario to the other and will have to wait for ISO observations in order to solve the ambiguity. Nevertheless, we will show that most conclusions are not severely affected by the assumption of one or other scenario, but that in details our results might be affected by unknown extinction being clumped or diffuse.
3.2 Color distributions
We present in the following the color distributions for both hypotheses. For the first, we left all colors unchanged. For the second, we made a coarse correction for reddening within the stripe shown in Fig. 3.
3.2.1 The sample
To determine the color of globular clusters, we selected a sample of objects in which the globular clusters dominate the background and compared this sample with an equally selected one on the background field. This sample consists of all objects in a elliptical ring from to major-axis, the lower limit protecting against variation in completeness towards the center, and the upper limit being chosen from the density profile: out to a semi-major axis of 170\arcsec, globular clusters dominate the background (see Sect. 5.1).
Further, only objects fainter than mag are considered. This is motivated by the globular cluster luminosity function (see Sect. 4.1), which shows that globular clusters are only to be expected at fainter magnitudes.
3.2.2 Correction for eventual local extinction
For the color correction in the stripe we assumed that the colors outside the stripe are unaffected. We corrected the colors within the stripe by a constant value to match their mean with the mean color outside the stripe. In the stripe, the objects following the selection described above have a mean color mag ; in the rest of the ring, the mean color is mag. We therefore adopted a “reddening correction” of mag, mag , and mag. In the following, colors and magnitudes in the stripe will be corrected by these values when we mention a correction for the “dust lane”.
3.2.3 The color distribution
We plotted the color distribution for objects from to 24.5 mag in Figs. 4 and 5. Figure 2 shows that completeness corrections start to be necessary at magnitudes fainter than , and that the correction is a function of the colors of the objects.
We divided our sample into four categories: to 1.0, 1.0 to 1.5, 1.5 to 2.0, and 2.0 to 2.5. We then applied the correction as a function of magnitude and of color to the bins in a given category, computed as the product of the mean completeness and the corresponding mean completeness111 We examined in artificial star experiments the effects of combining completeness factors for and . In our case the completeness drops due to photon noise rather than to crowding, so that completeness in and are independent. We therefore used the product of the completeness factors in and in , rather than just the lowest completeness at a given magnitude.. See Tab. 2 for the values used for the field and the background.
| Mag. / | 0.5—1.0 | 1.0—1.5 | 1.5—2.0 | 2.0—2.5 |
|---|---|---|---|---|
| 23.0–23.5 | 95 95 | 100 100 | 100 100 | 100 100 |
| 23.5–24.0 | 87 77 | 95 95 | 100 100 | 100 100 |
| 24.0–24.5 | 68 22 | 87 54 | 88 66 | 91 68 |
The color distribution of the background was smoothed by the median over respectively 3 bins to avoid any large fluctuations due to galaxy clusters that we could identify on our background frames, which fall in single color bins. It was then scaled down to the ring area considered in the galaxy field and subtracted bin by bin from the color distribution of objects in the ring around NGC 5018.


The resulting color distribution is much broader than expected from the photometric errors alone. If all clusters were concentrated at a single color, we would obtain a gaussian distribution with a FWHM of about 0.4 mag. The distribution uncorrected for reddening shows different groups of objects: a small group of objects around mag, a broad population around mag, and a narrower one around .
The color distribution corrected for the reddening in the “dust lane” shows a different mixing of the populations. The population at becomes as large as the one at , and the population at , shifting to a somewhat bluer color (), is only seen as a tail of the population at .
Both distributions show some red objects clustered around or respectively. In the case of no reddening, they would be a galaxy cluster at low redshift, judging from their color. In case of a reddening stripe the whole group shifts towards the blue: all these objects appear to lie in the stripe. This shows that our reddening correction of 0.3 mag might be very crude, and that, in fact, some objects could be even more reddened.
3.3 Interpretation of the color distribution
3.3.1 The colors
In the following we include the Galactic extinction of mag or mag towards NGC 5018 (Burstein & Heiles 1984).
If we compare the colors of the globular clusters in NGC 5018 with those of the Galactic globular clusters (see Fig. 6, data taken from Harris 1996), we notice that the distribution of the two red populations is similar to that of the globular clusters in the Milky Way, if the colors of the latter are not corrected for extinction.

From their colors, the red population(s) are thus compatible with being old globular clusters as seen in the Milky Way, with metallicities ranging from to dex and possibly suffering from as much reddening. We cannot discriminate between single populations with a wide range of metallicity combined with some reddening due to the dust in NGC 5018, or eventually two distinct populations of old globular clusters.
However, the blue objects are bluer than even the most metal-poor globular clusters in the Milky Way. Therefore they must be younger, unless they are more metal-poor than any observed globular cluster to date (e.g. Geisler et al. 1995). According to the models from Fritze v.Alvensleben & Burkert (1995), agreeing with Bruzual & Charlot’s (1993) model for solar metallicity, the globular cluster population centered at (eventually redder by 0.1 in the corrected case), could have an age ranging from 200 Myr to 6 Gyr, depending on the metallicity of the globular clusters (the younger limit being for extremely metal rich (), the upper for extremely metal poor () globular clusters). This compares well with the young globular clusters found in NGC 7252 (Whitmore et al. 1993), which are marginally bluer (by about 0.1 mag) and brighter by 2–3 magnitudes than our candidates. And thus probably younger by a few 100 Myr. These clusters are estimated to have ages between 0 and 800 Myr (Schweizer & Seitzer 1993).
All this supports the fact, that the young globular clusters in NGC 5018 could have formed during the last interaction dated between several hundred Myr and a few Gyr ago (see references in Sect. 1).
3.3.2 The color distribution with magnitude
In Table 3 we show the counts of globular clusters (background subtracted) for two magnitude bins, in order to examine the distribution of the red and blue objetcs with the magnitude.
| color interval: | 0.6—0.9 | 0.9—1.4 | 1.4—1.9 |
|---|---|---|---|
| mag limit | |||
| uncorrected case | |||
| 22.5—23.5 | 1.4 | 13.6 | 13.2 |
| 22.5—24.5 | 13.2 | 56.8 | 42.3 |
| corrected case | |||
| 22.5—23.5 | 4.5 | 12.7 | 7.6 |
| 22.5—24.5 | 28.8 | 52.1 | 29.7 |
For the two red intervals the counts increase by a factor 4 when going a magnitude deeper (independently of a correction or not). Assuming a turnover magnitude around mag (see Sect.4.1), we cut off respectively 2.8 and 1.8 mag below the turnover magnitude and sample respectively 3% and 12% of the surface of the globular cluster luminosity function (assuming it to be Gaussian and to have a dispersion of 1.4 mag). This is in good agreement with the increase by roughly a factor 4 found for the red populations.
For the blue objects, the statistics are too uncertain to be used in a quantitative way. Qualitatively, we detect only a few (1–5) objects down to (including also the interval to 22.5, i.e. , adds 3 more objects) and then a sudden increase (13–30) when sampling a magnitude deeper. Assuming an unimodal luminosity function for the blue objects, not much broader than the luminosity function of red objects, this would hint at a peak about 2–3 magnitudes brighter in than that of the red objects. This fits into the scenario where the blue objects would indeed be younger: according to e.g. Fritze v.Alvensleben & Burkert’s model, globular cluster around 1 Gyr would be 3 magnitudes brighter in than 15 Gyr old ones.
To get an estimate of the ratio of blue to red globular cluster candidates we assume a “blue GCLF” with a Gaussian shape, peaking 2 to 3 magnitudes brighter than the GCLF of the red objects, for which we take the turn-over values from table 4. This leads then to 20–150 blue globular clusters in total, or 1–10% of the red objects (see Sect. 4.2).
In summary, despite the fact that we have small number statistics
for the globular clusters and large uncertainties in the dust
distribution, the following points can be retained:
A blue population of globular clusters exists in NGC 5018, and is
probably between 200 Myr to 6 Gyr old.
(the upper range would be slightly preferred from their magnitudes, when
compared to the young clusters in NGC 7252).
These young globular clusters are likely to have
formed in the last interactions within the galaxy group.
The red globular cluster population(s) is compatible with old
( 10 Gyr) globular clusters.
Two distinct populations might exist, but the data are
still compatible with a single population differentially reddened and
with a large spread in metallicity.
4 The number of globular clusters
The globular cluster luminosity function (GCLF) plays an important role as extragalactic distance indicator and is essential for the estimation of the total number of globular clusters and specific frequencies. In recent years a lot of work has been done towards understanding the representation of the GCLFs and the fine tuning with the dependences on metallicity and age (e.g. Secker 1992, Ashman et al. 1995).
4.1 The globular cluster luminosity function
To compute the GCLF, we used the coarse selection of the objects described in the Sect. 3. (i.e. obvious galaxies were rejected) and restricted ourselves to an elliptical ring from 53\arcsec to 170\arcsec major-axis. We made no selection in color, since we wanted to avoid a combined completeness correction. Thus we included the blue objects and one has to be aware that these objects may influence the following results as discussed later.
To determine the GCLF, we counted the selected objects in bins of 0.5 mag width and shifted the bins in steps of 0.125 mag to get four luminosity distributions. We then corrected the counts for incompleteness. These steps were done for the field centered on NGC 5018 as well as for the background field. We interpolated the background luminosity function by a polynomial fit of the 4th order to smooth out the effect of individual background galaxy clusters biasing given bins. This background luminosity function was then subtracted from the field luminosity function bin by bin.
The limiting magnitude of 24.4 mag in is determined by the last bin of the background luminosity function with a completeness above 50%. Since we only have 7 to 8 data points for each fit to the bright tail of the luminosity function, we combined respectively the two luminosity functions shifted by 0.25 mag to obtain distributions with 0.5 mag bins in 0.25 mag steps. The points are then no longer statistically independent, but stabilize the fit.
The best representation of GCLFs are Gaussians or Student functions with dispersions of around or respectively (e.g. Secker 1992). The resulting turnover values (error-weighted means) from fitting these functions to the double-binned distributions vary a lot as a function of the chosen dispersion, while being almost unaffected by the correction for the dust lane or different binnings. In case of a Gaussian fit the values range from for the lowest dispersion of to mag for the highest dispersion of . For a fit with a function the values range from from for the lowest dispersion of to mag for the highest dispersion of . The turnover values have been corrected for a foreground extinction of mag (Burstein & Heiles 1984).
The uncertainties in our results are the following:
– The accuracy of the turnover determination by a given
function lies between 0.3 and 0.6 mag for a sparse sample like ours,
covering only the bright end of
the GCLF. This was derived from Monte Carlo simulations, simulating
samples similar to ours and fitting them in the same way. Single deviating
bins can largely influence the fit.
– Figure 7 shows that the fits of a Gaussian and a function
with different dispersions are
indistinguishable from each other in the fitted bright tail, whereas the
turnovers cover a range of about one magnitude. Since we do not know the real
dispersion for the GCLF of NGC 5018, we can only derive turnover values within
this range. Nevertheless, in the case of a broad color distribution one would
expect a dispersion around , as seen for
example in M87 which has a comparable color distribution (Whitmore &
Schweizer, 1995).
– A neglected young globular cluster population could affect the
bright tail of the luminosity function.
The possible young population which is 2–3 mag
brighter than the old one would produce a more
extended, flatter wing on the bright side of the GCLF
which leads to
underestimation of the turnover values for the old population.
Monte Carlo simulations showed that in our case (less than 10% young
clusters and only fitting the bright tail) the underestimation would be less
than 0.1 mag, but would introduce an additional scatter of 0.5 mag.

Including these uncertainties we can estimate a distance for NGC 5018 using the GCLF. We assume an absolute turnover value corrected for metallicity of mag (following Ashman et al. 1995, combined with a metallicity slightly less than solar for our old population, assumed from our colors).
Our average values lead to a distance modulus in the range of to , bracketing the value given in Tully (1988), derived from the heliocentric velocity of , and assuming .
An accurate distance determination by the GCLF awaits deeper data.
4.2 The total number
The calculation of the total number of globular clusters strongly depends on the fraction of the GCLF that we have covered with our data. The fitted luminosity function covers all clusters in the ring of 53\arcsec to 170\arcsec of major-axis. The results of the Gaussian fits of Tab. 4 (with “dust” lane stripe) range between and objects. For the inner and outer parts one has to make assumptions for the number of globular clusters based on the radial distribution of the globular cluster density (see section 5.1). Due to disruption processes we do not expect a steep increase of the cluster density in the innermost 10 kpc from the center but a flattening of the density profile (e.g. McLaughlin et al. 1993). Therefore, a reasonable guess for the inner ring (0\arcsec - 53\arcsec) is a density of objects per square arcmin (the density at 40\arcsec) leading to objects down to a magnitude of mag. For the outer part (170\arcsec - 200\arcsec) we assumed a mean density of leading to objects. We then corrected for the full GCLF. Our estimate of the total number of globular clusters in NGC 5018 ranges from to .
4.3 The specific frequency
The specific frequency is defined as , where is the total number of globular clusters in the galaxy and its absolute visual brightness (Harris & van den Bergh 1981). Mean values for are found to correlate with the galaxy type, luminosity, and environment. While the mean specific frequency of spirals is around 1, ellipticals in small groups have a higher mean value around 2.6, and ellipticals in clusters have a mean value around 5.4 (Harris 1991). Kumai, Hashi, and Fujimoto (1993) tried to quantify empirically the correlation of the specific frequency with the local galaxy density. For the given galaxy density around NGC 5018 of 0.29 galaxies/Mpc3 (Tully 1988), their relation would lead to a value of , also expected from Harris’ (1991) compilation. Djorgovski & Santiago (1992), supported by Zepf, Geisler & Ashman (1993) showed the relation between galaxy luminosity and number of globular cluster to be rather than , from which we also would expect an value around 3 for NGC 5018.
The absolute visual brightness of NGC 5018 depends on its distance, but since the derived total number of clusters, taken from the GCLF, also increases with distance, the calculated values lie in a narrow range between and , significantly below the expected value of for our given and values. For NGC 5018 to fall in the mean for ellipticals in small groups this would mean: either having 3 times as many clusters as observed, or being roughly one magnitude “too bright”. One explanation could be that the absolute luminosity of NGC 5018 is increased by a young stellar population and therefore is underestimated.
We calculated the increase of the luminosity and the change in color when mixing a young blue and red old population based on the models given by Fritze v.Alvensleben & Burkert (1995). If one wants to reach a value of 3 the young population would have to have increased the total luminosity of NGC 5018 by about 1.1 mag. A 3 Gyr old population with a color of mag which contributes 33% to the total luminosity would increase the luminosity by that amount. The color would change from , which is usual for ellipticals (e.g. Goudfrooij et al. 1994b), to , the color of NGC 5018.
5 Spatial distributions
5.1 The radial distributions
In the following we derive the radial density profile of the globular clusters and compare it with the profile of the galaxy light.
We compute the radial profile using all the objects found on our frame down to a magnitude of . The objects were binned into elliptical rings 100 pixels (37.7\arcsec) wide, the counts were then corrected for finding incompleteness (using 100% down to , 94% between and , and 65% between and ), and geometrical completeness when the ring expanded over the limits of our frame (only necessary for the ring 500 to 600 pixels ( to )).
Table 4 shows the mean semi-major axis of the ring, the corrected counts, the applied geometrical completeness, the total ring area, and the density. The density error was taken as a combination of the square root of the raw counts and uncertainties in the correction for incompleteness. The second part of Table 4 shows the object densities on the background field, where no rings were defined, but 3 stripes perpendicular to the minor axis.
| radius | corrected | geom. | full area | density |
| in arcsec | counts | corr. | in arcmin2 | obj/arcmin2 |
| 56.5 | 105.6 | 1.00 | 2.61 | |
| 94.3 | 121.4 | 1.00 | 4.34 | |
| 132.0 | 148.0 | 1.00 | 6.08 | |
| 169.7 | 200.2 | 0.96 | 7.82 | |
| 207.4 | 182.4 | 0.79 | 9.56 | |
| 290.3 | 280 | 1.0 | 14.7 | |
| 444.9 | 250 | 1.0 | 13.3 | |
| 662.8 | 254 | 1.0 | 13.3 |
On the background field, the counts at mag are already incomplete by more then 50%. We therefore corrected these counts by comparing them with Smail’s et al. (1995) deep counts in , and extrapolated our results down to mag with their slope. We find for our background field a mean density of objects per square arcmin down to mag, in agreement with Smail’s et al. (1995) results.
The radial profile is plotted in Fig. 8. We fitted a power-law of the kind , where stands for the surface density of the globular clusters or the light flux of the galaxy, and for the semi–major axis, to both globular cluster and light profiles in order to compare their fall-off.
For the density profile of the globular clusters after subtraction of the background density, we obtain (the large error being due to the weight attributed to the fourth point). The fit to the light profile (between and semi-major axis) returns a slope of , and is therefore steeper than the globular cluster profile. This last slope depends slightly on how far one extends the fits, since the galaxy light gets steeper beyond a semi-major axis of about . Stopping our fit there returns , essentially the same value that would return a fit to the Goudfrooij et al. (1994a) data in this range, for which we find .

The galaxy light does not have an unexpectedly steep profile, it is rather the globular cluster system which extends further out and is flatter than the stellar component. A similar behavior was already observed in galaxies with rich globular cluster systems, while in sparser systems the globular clusters seem to follow the galaxy light (e.g. Kissler-Patig et al. 1996 and references therein).
5.2 Ellipticity and position angle of the globular cluster system

Figure 9 shows the angular distribution of all objects down to a magnitude of around NGC 5018 in a ring from to , uncorrected for finding incompleteness; that we assumed to be homogeneous over the position angle. Objects closer than were not considered because of the too high finding incompleteness within this radius. To avoid any geometrical incompleteness, we limited the counts to . The thus defined ring area covers 29.6 arcmin2, or 73% of the total frame surface.
We divided the ring into 12 segments, 30 degrees wide each, and counted the objects in the segments. Each ring has a surface of 2.48 arcmin2. We estimated the background contamination, uncorrected for completeness, from the area outside , where the density profile reaches already the background (see Sect. 5.1.) and obtained 12.0 objects per square arcmin. We thus expect 30 objects in each segment (marked as a dashed line in Fig. 9).
The two strong peaks in Fig. 9 separated by 180 degrees at the position angle of the galaxy hint at a non-spherical distribution of the objects. Indeed, the distribution can be better fit by a double cosine (expected for an elliptical distribution) than by a constant function (expected for a purely spherical distribution); note however that a spherical distribution is still compatible with the data within .
The best fit by a double cosine of the form , where are the corrected counts and the position angle E of N, returns the parameters , , and . The globular cluster system thus has a position angle of degrees E of N, and its ellipticity as . The isophotes of the galaxy have a position angle of out to and then become more irregular, shifting between 95 and 110 degrees E of N (Goudfrooij et al. 1994b). The ellipticity of the isophotes is roughly (Goudfrooij et al. 1994b), while the best oblate model for the galaxy light returns 0.6 (Carollo & Danziger 1994).
The globular cluster distribution is compatible within the errors with the galaxy light. It seems slightly shifted with respect to the stellar light and would rather support Carollo & Danziger’s (1994) model where the galaxy is intrinsically flat (E4 to E6) but seen at an inclination of 30 to 55 degrees, if we assume that the globular clusters share the ellipticity of the luminous component.
6 Discussion and Conclusions
6.1 Verifying the prediction of globular clusters in mergers
At least some ellipticals are supposed to have formed by mergers or interactions. When the majority of these events happened is still unclear, as well as the evolutionary state of the progenitors (still gaseous proto-galaxies or evolved stellar systems?, see e.g. White (1994) for a review).
NGC 5018 is probably one of the elliptical galaxies that were formed by mergers or interactions of evolved stellar systems. Guhathakurta et al. (1989) suggest an encounter of at least three bodies including at least one cold disk system.
The properties of the globular cluster system of NGC 5018 can be compared with the predictions of the model for globular cluster formation in mergers (Ashman & Zepf 1992 and Zepf & Ashman 1993). Several predictions of the models are confirmed:
(i) – NGC 5018 most probably contains “young” (several hundred Myr to 6 Gyr) globular clusters that could be attributed to the last interaction of NGC 5018. This would close the gap between different “old” populations in the same galaxy and “newborn” globular clusters, as seen directly in merging or interacting galaxies (e.g. NGC 3597: Lutz 1991; NGC 1275: Holtzman et al. 1992; NGC 7252: Schweizer & Seitzer 1993; He2-10: Conti & Vacca 1994).
(ii) – In NGC 5018, the problem caused by age/metallicity ambiguity in broad-band filters is partly solved by the big differences in age between the clusters, that make the young population clearly stand out in color. It remains however very difficult to decide whether one or two “old” populations are present, owing to the large uncertainties in the dust distribution within the galaxy. Therefore it is not possible to say whether two similar systems (e.g. spiral galaxies) merged, in which case different old populations are expected, or that a larger system (already elliptical?) interacted with smaller systems.
Different populations of globular clusters around elliptical galaxies, as identified in color distributions (e.g. examples in Zepf et al. 1995, or the recent study by Whitmore & Schweizer 1995 in M87), wait for confirmation by spectroscopy of whole globular cluster systems with 10m-class telescopes.
(iii) – The model also predicts flatter radial density profiles for globular cluster after a merger event. The assumption is that old and new globular clusters follow the distribution of the field stars with which they formed. During a merging event the gas condenses to the center to form the new stars and clusters, so that the resulting stellar distribution is more centrally concentrated than the old globular clusters. If, after the interaction, the old globular clusters still dominate the system, it will appear flatter then the galaxy light. If, on the contrary, the new globular clusters dominate, the system will only be marginally flatter then the light of the galaxy.
In the case of NGC 5018, the globular cluster system extends further than the stellar component. Therefore, if the assumption above is right, we would expect only very few globular clusters to have formed newly and the old globular clusters to still dominate the system, as is indeed the case (see Sect. 4.1), since we estimate the young population to be at most 10% of the old one.
In that respect, however, poor systems that follow the profile of the galaxy light like NGC 720 (Kissler-Patig et al. 1996) would not fit into a merger scenario. Density profiles of globular clusters could then serve to identify ellipticals that did not form by late stellar mergers.
One prediction of the model, however, does not seem to be verified here: originally, the model aimed to explain the higher specific frequency of ellipticals compared with spiral galaxies. Taking into account the different mass to luminosity along the Hubble sequence, the specific frequencies of ellipticals are higher by a factor two than in spirals (Ashman & Zepf 1992). If this excess of globular clusters had to be explained by formation during mergers and interactions alone, Ashman & Zepf (1992) expected the formation of as many new globular clusters as there were old ones.
The specific frequency of NGC 5018 is not much higher than in spirals, mainly due to its high luminosity. To reconcile its -value with that of normal ellipticals in groups (about 3, Harris 1991) the young stellar population must have raised the absolute luminosity of NGC 5018 by one magnitude.
The results for NGC 5018 show, however, that only few blue globular clusters formed in this last interaction. We estimate the young population of globular clusters to make up less than 10% of the total population. At least in this case, the merger event did not produce a sufficiently high number of new clusters to systematically explain the higher number of globular clusters found in ellipticals as compared to spirals. Either NGC 5018 experienced more mergers in the past that were more effective, or another scenario is needed to explain the systematic higher number of globular clusters around ellipticals.
Harris (1995) estimated that for an efficiency of 1% to turn gas into bound stellar clusters during a merger, typical merging events involving of gas would produce about 300 clusters with an “average” mass of . In the case of NGC 5018 roughly 100 new clusters formed, which might allow an estimation of the amount of gas involved. Note that the efficiency seem to be influenced by the amount of gas in both merging galaxies. NGC 5018, probably an elliptical merging with a cold disk system (Guhathakurta et al. 1989), resembles in that respect NGC 5128, the product of a bulge dominated system with a late–type spiral (Minniti et al. 1996), for which Zepf & Ashman (1993) suggested that the small amount of newly formed clusters was due to the swallowing of a small satellite. In contrast, systems like NGC 4038/4039 (the “Antennae”), the result of a Sb and a Sc galaxy merging, produced over 700 young globular clusters (Whitmore & Schweizer 1995). This suggests that “gas on gas” infall creates very favorable conditions for the formation of globular clusters, while the infall of gas into an early–type galaxy is not as effective.
6.2 Globular clusters compared to dark matter
In their kinematical study, Carollo & Danziger (1994) found through dynamical modeling that NGC 5018 is much better fit by a model with a dark matter halo than without. Their best oblate model with dark matter returns the presence of a dark halo six times as massive, twice as diffuse, and half as flattened (about E3) as the luminous galaxy. In that respect it is interesting to note, that the profile for the globular cluster system was computed further than 38\arcsec (), where the dark matter potential will dominate, and is also twice as diffuse as the stellar component. However, its ellipticity seems higher than that returned by the dynamical model for the dark halo, even if both still agree within the errors.
The association of globular cluster systems with the stellar or the dark halo also waits verification from kinematical studies of entire globular cluster systems.
Acknowledgements.
We wish to thank Tom Richtler for his constant support, as well as Paul Goudfrooij and Edwin Huizinga (“the unbelievers”) for helpful discussions. Uta Fritze-v.Alvensleben is thanked for providing us with the tabulated results of her globular cluster color evolution computations. Thanks also to Do Kester for providing the HIRAS images of NGC 5018. The referee S. Zepf is acknowledged for useful comments. This research was partially supported through the Deutsche Forschungsgemeinschaft under grant Ri 418/5-1. This research made use of the NASA/IPAC extragalactic database (NED) which is operated by the Jet Propulsion Laboratory, Caltech, under contract with the National Aeronautics and Space Administration.References
- [] Ashman K., Zepf S.E., 1992, ApJ 384, 50
- [] Ashman K.M., Conti A., Zepf S.E., 1995, AJ 110, 1164
- [] Bohlin R.C., Savage B.D., Drake J.F., 1978, ApJ 224, 132
- [] Bruzual G.A., Charlot S., 1993, ApJ 405, 538
- [] Burstein D., Heiles C., 1984, ApJS 64, 601
- [] Carollo C.M., Danziger I.J., 1994, MNRAS 270, 743
- [] Carollo C.M., de Zeeuw P.T., van der Marel R.P., Danziger I.J., Qian E.E., 1995, ApJ 441, L25
- [] Conti P.S., Vacca W.D., 1994 ApJ 423, L97
- [] Davies R.L., Burstein D., Dressler A., Faber S.M., Lynden-Bell D., Terlevich R.J., Wegner G., 1987, ApJS 64, 581
- [] Djorgovsky S., Santiago B.X., 1992, ApJ 391, L85
- [] Fritze v. Alvesleben U., Burkert A., 1995, A&A 300, 58
- [] Geisler D., Piatti A. E., Claria J. J., Minniti D., 1995, AJ, 109, 605
- [] Goudfrooij P., de Jong T., 1995, A&A 298, 784
- [] Goudfrooij P., Hansen L., Jorgensen H.E., Nørgaard-Nielsen H.U., 1994a, A&AS 105, 341
- [] Goudfrooij P., Hansen L., Jorgensen H.E., Nørgaard-Nielsen H.U., de Jong T., van den Hoek L.B., 1994b, A&AS 104, 179
- [] Gourgoulhon E., Chamaraux P., Fouque P., 1992, A&A 255, 69
- [] Guhathakurta P., Knapp G.R., van Gorkom J.H., Kim D.-W., 1989, in “The Interstellar Medium in External Galaxies”, ed. D.J. Hollenbach & A.T. Harley, NASA Conf. Publication 3084, p.26
- [] Harris W.E., 1991, ARAA 29, 543
- [] Harris W.E., 1994, in “The Globular Cluster–Galaxy Connection” ASP Conf. Series Vol. 48, eds. G.H. Smith & J.P. Brodie
- [] Harris W.E., 1995, in “Stellar Populations”, IAU Symp. 164, eds. P.C. van der Kruit & G. Gilmore, Dodrecht: Kluwer, p.85
- [] Harris W.E., 1996, electronically published catalog (McMaster University)
- [] Harris W.E., van den Bergh S., 1981, AJ 86, 1627
- [] Holtzman J.A., et al., 1992, AJ 103, 691
- [] Kim D., Jura M., Guhathakurta P., Knapp G.R., van Gorkom J.H., 1988, ApJ 330, 684
- [] Kissler-Patig M., Richtler T., Hilker M., 1996, A&A 308, 704
- [] Knapp G.R., Guhathakurta P., Kim D.-W., Jura M., 1989, ApJS 70, 239
- [] Kumai Y., Hashi Y., Fujimoto M., 1993, ApJ 416, 576
- [] Landolt A.U., 1992, AJ 104, 340
- [] Lima-Neto G., Combes F., 1995, A&A 294, 657
- [] Lutz D., 1991, A&A 245, 31
- [] McLaughlin D.E., Harris W.E., Hanes D.A., 1993, ApJ, 409, L45
- [] Minniti D., Alonso M.V., Goudfrooij P., Jablonka P., Meylan G., 1996, ApJ in press
- [] Poulain P., Nieto J.-L., 1994, A&AS 103, 573
- [] Richtler T., 1995, in “Reviews of Modern Astronomy”, Vol. 8, eds. G. Klare, Springer, p.163
- [] Schweizer F., 1987, in “Structure and Dynamics of Elliptical Galaxies”, IAU Symp. 127, ed. P.T. de Zeeuw, Dordrecht: Reidel, p.109
- [] Schweizer F., Seitzer P., 1992, AJ 104, 1039
- [] Schweizer F., Seitzer P., 1993, ApJ 417, L29
- [] Schweizer F., Seitzer P., Faber S.M., Burstein D., Dalle Ore C.M., 1990, ApJ 364, L33
- [] Secker J.A., 1992, AJ 104, 1472
- [] Smail I., Hogg D.W., Yan L., Cohen J.G., 1995, ApJ 449, L105
- [] Tully R.B., 1988, Nearby Galaxies Catalog, Cambridge University Press
- [] Vaucouleurs de G., Vaucouleurs de A., Corwin H.G., Buta R.J., Paturel G., Fouqué P., 1991, Third Ref. Catalogue of Bright Galaxies, Springer, New York
- [] White S.D.M., 1994, in: Lecture Series of the Les Houches Summer scholl on ‘Dark Matter and Cosmology’ August 1993, ed. R.Schaeffer, North Holland, in press, also preprint MPA 831
- [] Whitmore B.C., Schweizer F., Leitherer C., Borne K., Robert C., 1993, AJ 106, 1354
- [] Whitmore B.C., Schweizer F., 1995, AJ 109, 960
- [] Zepf S.E., Ashman K.M., 1993, MNRAS 264, 611
- [] Zepf S.E., Geisler D., Ashman K.M., 1993, ApJ 435, L117
- [] Zepf S.E., Ashman K.M., Geisler D., 1995, ApJ 443, 570