M. Villar-Martín, Dept. of Physics, University of Sheffield, Sheffield S3 7RH, UK
2 Max-Planck-Institute für extraterrestrische Physik, Giessenbachstrasse, Postfach 1603, D-85740 Garching, Germany 3 Observatoire de Lyon, UMR CNRS 142, 9 av. Charles André, F-69561 Saint-Genis-Laval Cedex, France
4 Affiliated to the Astrophysics Division, Space Science Department, European Space Agency
The effects of resonance scattering and dust on the UV line spectrum of radio galaxies
Abstract
In the powerful, high redshift radio galaxies, it is believed that the dominant source of ionization for the interstellar gas is the hard radiation field associated with the active nucleus. The photon source is generally external to the clouds being ionized and so the geometrical perspective from which the gas is observed and the presence and distribution of dust must be properly accounted for in the diagnostic process. In this paper, we examine the formation of the three strong lines: CIV1549, Ly and CIII]1909 which are often observed in the nuclear and extended emission from these sources. We find that the observed trends, in particular the high CIV1549/Ly ratio, are often better explained by geometrical (viewing angle) effects than by the presence of large quantities of dust either within or outside the excited clouds. We show that neutral condensations along the line-of-sight, by reflecting photons near the wavelength of Ly, can increase the observed CIV/Ly ratio. The existence of HI absorption clouds (i.e., mirrors) external to the emission region leads also to the presence of large, diffuse haloes of what appears to be pure, narrow Ly emission.
keywords:
atomic processes – ISM: dust – Galaxies: cooling flows, radio galaxies, galaxy formation1 Introduction
The strong, spatially extended, rest-frame ultraviolet emission lines observed in high redshift radio galaxies provide one of the principal diagnostics in establishing the state of the interstellar medium in galaxies at early epochs. The presence of a blue continuum and emission lines from regions aligned with the radio axis (McCarthy et al. 1987; Chambers et al. 1987) warned us that much of the observed optical radiation might be associated with the nuclear activity and so may not be giving us a clear picture of the stellar processes which are of such interest in studies of galaxy formation and evolution. Subsequent work has shown, indeed, that much of the blue light is scattered, polarized nuclear radiation (e.g., Tadhunter et al. 1989; di Serego Alighieri et al. 1993; Cimatti et al. 1993) and that the emission lines have a high ionization state and cannot result from stellar photoionization (McCarthy 1993). It is clearly necessary, therefore, to reach a clear understanding of the physical processes involved in the formation of the various lines and continua to be able to disentangle the stellar and the AGN-related sources.
For objects at high , the UV rest-frame lines are shifted into the optical band and the spectrum is generally dominated by Ly, CIV1549, HeII1640 and CIII]1909. The strength of the high ionization lines suggests the presence of a hard photoionizing continuum which could originate at the AGN itself (Robinson et al. 1987) or be associated with fast shocks generated in extranuclear regions by the radio jets (Sutherland, Bicknell & Dopita 1993). The strong radio/optical asymmetries observed in these objects which exhibit the ‘alignment effect’ (McCarthy et al. 1991a) may simply result from a one-sidedness in the distribution of material. It it is clear, however, that correlated line and continuum asymmetries could be produced by dust scattering and line fluorescence for sources where the radio axis falls significantly away from the plane of the sky.
In this work, we concentrate on modeling the high excitation lines for which rather extreme ratios relative to Ly have recently been reported. The presence of dust has been universally invoked to explain the weakness of Ly which is a resonance line and therefore, due to multiple scattering, more susceptible to absorption. We explore the fact that any resonance line will be extremely sensitive to geometrical factors, an aspect of the problem which has so far been overlooked in modeling the UV lines. If in radio-galaxies the distant gas clouds are photoionized from the outside by partially collimated UV radiation emitted by the nucleus, the line formation process — particularly for the resonance lines — is very different from internally ionized HII regions. The escape of resonance line photons is strongly influenced by the presence of spaces between the line emitting clouds.
We have collected from the literature the observed line ratios for a number of high z radio-galaxies in which no contribution from any nuclear BLR is apparent. We have built a diagnostic diagram consisting of the lines CIV1549/Ly vs. CIV1549/CIII]1909, in which we compare the position of the objects with photoionization models which not only consider the effects of internal dust but also those of the viewing perspective — the angle between the incoming ionizing radiation and the observer’s line of sight. Our concentration on the particular class of radio galaxies is purely for pragmatic reasons. It is these objects, which we presume to harbour a powerful quasar which is hidden at optical/ultraviolet wavelengths to our line of sight, which are most readily found and studied at the high redshifts where we have access to the ultraviolet spectrum from groundbased observations. Our conclusions should be equally applicable to other classes of AGN.
For some objects, Ly is observed to be fainter with respect to CIV than predicted by dust-free photoionization models. The explanation previously proposed to explain the weakness of Ly with respect H or H has been dust destruction of resonant Ly photons. This is not borne out by our calculations in which we have used arbitrary amounts of dust and found that this cannot simultaneously weaken Ly while leaving the CIV/CIII] ratio relatively unchanged since resonant CIV suffers also from dust absorption. Alternatively, by varying the proportions of the illuminated and the shadowed cloud faces which contribute to the observed spectrum, we are better able to match the data. geometric explanation could naturally explain that some of the brightness asymmetries noted by McCarthy et al. (1991a) on sides of the nucleus.
As we find that geometry alone (with or without internal dust) can in principle explain most of the specific line ratios observed (fainter Ly compared with either CIV or HeII), we also discuss the possibility of a patchy outer halo of neutral gas to account for the diffuse Ly seen in some cases to extend much beyond the CIV emitting region and even the outermost radio lobes. Reflection by cold gas of the brighter Ly emitting side of the ionized clouds would lead to a narrower profile for such a diffuse component. Another possibility is that part of the beamed nuclear continuum and BLR radiation might be reflected at the wavelength of Ly by thin matter-bounded photoionized gas at very large distances from the nucleus leading to a diffuse Ly component aligned with the radio axis. It appears to us that geometrical perspective effects are an essential component of the interpretation of the UV spectrum of radio-galaxies whether or not dust is present. Furthermore, a spectrum in which only Ly appears does not necessarily imply starburst activity, other lines must be observed before the existence of an HII region can be inferred.
2 Data sample and modeling procedure
2.1 The data
We have constructed a data sample containing galaxies at high z for which the CIV, Ly and, in most cases CIII], emission lines have been measured. Since very high densities such as those encountered in the BLR alter significantly the line formation and transfer processes, we have excluded those objects which show evidence of a BLR. In Table 1, we list the object names, the line ratios of interest to us here, the redshift and the reference to the observations. The larger fraction of the data are taken from the recent thesis by van Ojik (1995) which includes objects selected on the basis of a very steep radio spectrum. Probably by virtue of the radio selection, these sources populate the region of the line ratio diagram (Fig. 4) with lower CIV/CIII] ratios (lower ionization parameter) than the previously published objects. The line measurements refer to the integrated emission from the object collected with a long slit aligned with the major axis.
2.2 The model and its parameters
The data are compared to photoionization models computed using the multipurpose photoionization–shock code MAPPINGS I. The version described in Binette et al. (1993a,b) is particularly suited to the problem since it considers both the effects of the observer’s position with respect to the emitting slab and the ionizing source (cf, Fig. 3). We distinguish between the spectrum seen from the back and from the front of the slab. The code also considers the effects of dust mixed with the ionized gas: extinction of the ionizing continuum and of the emission lines, scattering by the dust and heating by dust photoionization. The treatment of the escape of resonant CIV and Ly photons in a dusty medium is described in Appendix B of Binette et al. (1993a) and is based on the results of Hummer & Kunasz (1980).
The dust content of the photoionized plasma is described by the quantity which is the dust-to-gas ratio of the plasma expressed in units of the solar neighbourhood dust-to-gas ratio. To specify the gas metallicity, we scale with a factor the solar abundance set of trace elements from Anders & Grevesse (1989). He/H is kept constant at 0.1. We generally consider the solar case with . Since the presence of dust implies depletion of refractory trace elements, we use the prescription given in Appendix A of Binette et al. (1993a, hereafter BWVM3) to derive the gaseous phase abundances for any metallicity . The depletion algorithm is function of the ratio and makes use of the depletion indices listed in Whittet (1992) for the different metals.
The calculations consider the gas pressure to be constant (isobaric models) and so the density behaviour with depth in the cloud is determined by the behaviour of the temperature and the ionization fraction of the gas. The ionization parameter, a measure of the excitation level of the ionized gas, is defined as the quotient of the density of ionizing photons incident on the cloud and the gas density:
where is the monochromatic ionizing energy flux impinging on the cloud, the ionization potential of H, the density of the gas in the front layer of the slab and the speed of light.
| Name | CIV/CIII] | CIV/Ly | ref. | |
|---|---|---|---|---|
| Average RG | 2.054 | 0.118 | McCarthy (1993) | |
| MG1019+0535A | 2.12 | 1.24 | 2.76 | Dey et al. 1995 |
| F10214+4724 | 3.68 | 8.75 | 2.29 | Elston et al. 1994 |
| TX0211-122 | 3.33 | 0.91 | 2.34 | van Ojik et al. 1994 |
| 3C294 | 0.83 | 0.10 | 1.79 | McCarthy et al. 1990a |
| 0902+34 | – | 0.11 | 3.40 | Lilly 1988 |
| 3C256-3C239 | 1.90 | 0.14 | 1.82 & 1.78 | Spinrad et al. 1985 |
| 0200+015 | 1.05 | 0.241 | 2.23 | van Ojik 1995 |
| 0214+183 | 1.67 | – | 2.13 | ” |
| 0355-037 | 1.17 | 0.24 | 2.15 | ” |
| 0417-181 | – | 0.40 | 2.73 | ” |
| 0448+091 | 0.44 | 0.10 | 2.04 | ” |
| 0529-549 | 0.22 | 0.05 | 2.58 | ” |
| 0748+134 | 1.29 | 0.29 | 2.42 | ” |
| 0828+193 | 0.95 | 0.14 | 2.57 | ” |
| 0857+036 | – | 0.39 | 2.81 | ” |
| 0943-242 | 1.70 | 0.19 | 2.92 | ” |
| 1138-262 | 0.62 | 0.06 | 2.16 | ” |
| 1357+007 | – | 0.19 | 2.67 | ” |
| 1410-001 | 1.58 | 0.16 | 2.36 | ” |
| 1545-234 | 0.61 | 0.17 | 2.76 | ” |
| 1558-003 | 2.25 | 0.18 | 2.53 | ” |
| 2202+128 | – | 0.25 | 2.71 | ” |
| 2251-089 | 2.20 | – | 1.99 | ” |
| 4C23.56 | 3.40 | – | 2.48 | ” |
| 4C24.28 | – | 0.23 | 2.88 | ” |
| 4C26.38 | 3.71 | – | 2.61 | ” |
| 4C28.58 | 0.17 | – | 2.89 | ” |
| 4C40.36 | 1.05 | – | 2.27 | ” |
| 4C41.17 | – | 0.05 | 3.80 | ” |
| 4C48.48 | 2.18 | – | 2.34 | ” |
| 4C60.07 | – | 0.27 | 3.79 | ” |
2.3 Adopted physical conditions
The detailed studies of the optical emission lines of low z radio galaxies provide our basic reference for the properties of the emitting gas and the ionizing continuum (e.g., Robinson et al. 1987, hereafter RBFT87). As a guide in choosing the input parameters, we have assumed that the excited gas of very high z radio galaxies () has similar properties to that of the low redshift () objects.
For the extended (EELR) as well as the (narrow) nuclear emission lines, photoionization by a hard continuum appears to best explain the various line ratio diagnostic diagrams. The EELR follow a tight sequences which are well reproduced by varying the ionization parameter in photoionization models. By combining [OI]6300/H with information on the gas excitation (from the ratio [OIII]/H), RBFT87 inferred that the ionizing spectrum is characterized by mean photon energies in the range 30 to 40 eV, which rules out normal stars. A power law of index () obeys this requirement and has produced remarkably good agreement with the optical line ratios although equally good fits can be obtained using hot ( K) blackbody spectra. Hereafter the above power law will be adopted as ionizing energy distribution.
Concerning metallicity, RBFT87 indicated that the abundances cannot be much higher than solar values. They could however be lower by a factor of a few, a distinct possibility in the case of the extranuclear gas in very high z galaxies. Unless specified otherwise, we have adopted in our calculations and have verified that lower abundances do not in any way affect the conclusions reached here.
The red [SII] doublet ratio in low z radio galaxies indicates densities for the extended emission line regions which are not higher than a few tens per cm3. We therefore adopt the low density regime, specifically , since the extranuclear gas generally dominates the line luminosities.
3 Models and comparison with observed UV lines
In this section we first extend the assumption of photoionization to modeling the line emission in the rest-frame ultraviolet of high z radio galaxies. We distinguish the effects of having a back and a front view of an externally photoionized slab (section 3.2). In 3.3, we introduce internal dust and discuss how, alone, it is insufficient to explain the low value of the Ly/CIV ratio in some objects. In 3.4 we distinguish between the resonance line ‘mirror’ intrinsic to our photoionized slab and the possibility of having external cold gas — which is shadowed from the ionizing source — acting as a reflector.


3.1 The photoionization assumption at low and high z
At very high redshift, observational access to the normal optical plasma diagnostic lines is restricted and the available data set is small. Also, where measurements are available, few lines are measured in any given source. It is nevertheless interesting to compare the [OIII]5007/H value observed at very high z to that of low z radio galaxies as plotted in Figure 1. The curved line corresponds to the sequence of photoionization models of RBFT87 which reproduce reasonably well the optical (rest frame) line ratios of the extended emission line regions and their associated narrow nuclear line emission. The range in is []. The three lower horizontal lines correspond to high z radio galaxies while the upper one corresponds to the “average” radiogalaxy spectrum as defined by McCarthy (1993). The high z objects are not substantially different from the low z sample although the apparent trend towards weaker [OIII]/H, if confirmed, might indicate substantially lower metallicities: low enough to overcome the higher ratios produced by the higher kinetic temperatures in moderately underabundant objects. Such an effect could also be produced by insufficient spatial resolution at high z to separate the high from the low excitation regions.
To see if these models reproduce the observed CIV/Ly and CIV/CIII] ratios, we have presented the observed and predicted values in Fig. 2. The various lines correspond to calculations in which the ionization parameter is varied, generating a sequence in . Different line types correspond to different viewing angles (front, back and average) of the photoionized slab. The metallicity was and the gas dustfree.
We find that somewhat higher values of than in the optical are required to reproduce the CIV/CIII] ratio observed. This is most probably a consequence of the different way in which the objects at high and low z are selected: the distant sources are all very powerful radio sources with luminous AGN. For a power law of index –1.4, the optimum value is . Hereafter, diagrams will only cover the range of [0.01,0.1] in .
3.2 Effects of viewing direction on the UV lines
A notable observation is the distribution of observed points above the model loci in Fig. 2 even at the highest value of . In the extreme objects at least — like F 10214+4724 and TX 0211-122 — this results from a weakening of Ly rather than atypical values of CIV/CIII]. It is usually claimed that the destruction Ly photons by resonance scattering in the presence of dust is the explanation for its faintness, but why does not the same process reduce CIV which is also a resonance line? Is there an alternative explanation for this selective dimming of Ly?
To answer this question, we examine the geometrical aspects of the line formation process. Each emitting cloud is approximated as a plane parallel slab which contains a fully ionized region and a partially ionized zone where low ionization species co-exist (e.g., O0, S+, etc) with a mixture of H0 and H+. In principle there can be an additional neutral zone which does not contribute to the emission line intensities (see Fig. 3).
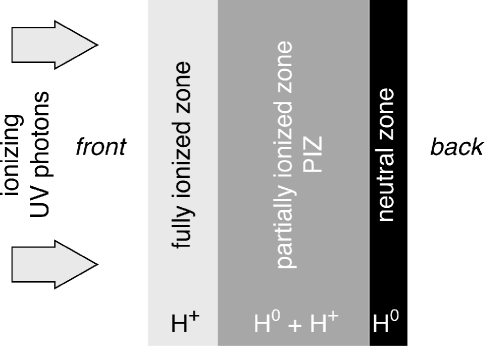
In this section we consider the dust-free case. For most lines (like CIII], HeII, H, [OIII], etc) line opacity is negligible and the line is emitted isotropically with photons escaping freely in all directions. However, when the line opacity is important as it is for CIV and Ly, line scattering occurs which increases the path length. Another important effect of large optical depths is that the line photon will not escape isotropically. A resonance line photon following many scatterings must statistically escape in the direction of highest escape probability which can be shown to be the front for the photoionized slab depicted in Fig. 3. In the case of Ly, the reason is that — while Ly photons are generated more or less uniformly within the slab (except within the PIZ) by recombination — the neutral fraction and therefore the incremental line opacity increases monotonically as a function of depth as discussed in more detail by BWVM3. This means that for an open geometry like that shown in Fig. 3, the zone of equal escape probability of front vs back occurs far beyond the point where half the luminosity of Ly is produced. For the collisionally excited CIV line, the tendency to escape from the front also exists although it is less pronounced. It arises mainly because the emissivity of CIV is larger towards the front due to the temperature gradient across the C+3 zone. Note that while CIV is emitted and scatters within the rather limited zone containing C+3, Ly remains subject to scattering outside the region where it is produced. While most Ly emission is produced in the fully ionized zone, most of the line opacity occurs within the PIZ. The presence of a layer of neutral gas beyond the PIZ will increase the anisotropy of Ly escape.

The effects described qualitatively above are shown in Fig. 4 using detailed photoionization calculations. We present the same sequence of dust-free models as in Fig. 2 but distinguish between the spectrum seen from the back — equivalent to observing the clouds through the PIZ — from that seen from the front — equivalent to seeing the UV irradiated side. The differences are striking: both Ly and to a lesser extent CIV are fainter when seen from the back. The CIII] line is isotropic in the dust-free case. The fact that Ly is more affected by perspective is due to the significant amount of neutral hydrogen (i.e., large line opacity) in the PIZ which acts as a mirror. Although we have considered a very simplified geometry in our calculations, the method nevertheless treats properly the essential physical effects and indicates how important the viewing direction is in this open geometry.
Fig. 4 suggests that perspective effects alone (without any dust) are sufficient to explain the weak Ly seen in some objects. Ionization bounded calculations with imply total hydrogen column densities (H+ region + PIZ) (of which about 60% is ionized). Adding a modest neutral zone beyond the PIZ of would double the CIV/Ly ratio without affecting in any way the CIV/CIII] ratio. It seems, therefore, that a geometry where we see preferentially the ionized gas from the side of the PIZ gives us an explanation of the weakness of Ly.
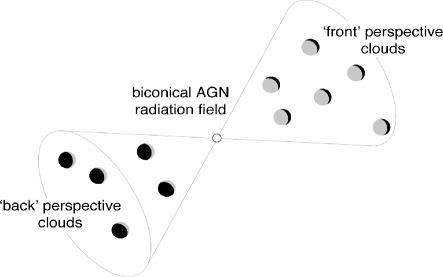
How would this apply to the EELR of the powerful radio galaxies? In a very simplified scheme, we can imagine (see Fig. 5) that the clouds seen from the nearside cone are seen from a direction which we approximate as the back perspective in our slab calculations while clouds on the far side would be seen from the front. The studies of McCarthy et al. (1991a) which emphasized the one-sideness of the line brightness suggest that the observer with limited spatial resolution at very high z will be biased towards either a back or front dominated perspective depending on whether it is the near or the farside illuminated cone which is intrinsically brighter. Our proposed interpretation of the high CIV/Ly ratio of some objects in Fig. 4 is that they correspond to the case where the brightest clouds are seen from behind. Note that, because of the intensity weighting, there is rather little difference between the pure front perspective and the sum of equal numbers of front- and back-clouds, a small effect which is not easily distinguished from that of slightly reducing the value of .
Our conclusion from this section is that perspective effects in an open — externally illuminated cloud — geometry go a long way towards explaining the behaviour of the CIV, Ly, CIII] line ratio diagram. It implies that, when spatially resolved spectra become available, marked asymmetries in the CIV/Ly ratio could arise when the axis of the illuminated cones forms a large angle with the sky plane.
3.3 The effects of internal dust
There is evidence for the existence of dust in some high z radio galaxies. The detection of 4C41.17 () and B2 0902+34 () (Chini & Krügel 1994; Dunlop et al. 1994) and 8C1435+635 () (Ivison 1995) in the mm spectral range is attributed to warm dust. Also, the IRAS galaxy F10214+4724 () has been shown, from the far infrared flux, to contain of dust, although this figure may be reduced by the gravitational lensing amplification factor (Serjeant et al. 1995). In addition, the mid- to far-infrared measurements at intermediate z are explained as emission from warm dust (Heckman, Chambers & Postman 1992). We should emphasize, however, that we have no direct measurement of how this dust is spatially distributed. In the event that this infrared emission arises from the reprocessing of higher energy photons from the AGN by a dusty torus, it has no direct bearing on our modeling of ionized gas at tens of kpc. However, there is considerable evidence that aligned blue polarized continuum is the result of scattering of the anisotropic nuclear radiation field by dust (e.g., Cimatti et al. 1993). In this case it is very likely that at least some of the dust is internal to the extended line emission regions. In this section we consider the effects of including dust within the gas clouds which emit the UV lines.

We illustrate the effects of dust mixed with the emitting gas in Fig. 6 where we plot sequence of models which correspond to the front perspective for three different dust-to-gas ratios: , 0.3 and 1. The effects on the line ratios are evident. The resonance scattering suffered by CIV and Ly increases their pathlengths many times and, therefore, the probability of their being absorbed by dust grains is much higher than for CIII]. In the case of Ly, however, the geometrical thickness of the H+ region exceeds greatly that of the C+3 since we observe more than one stage of ionization of metals (e.g. C+2). Any reasonable parameters for the ionization structure of a photoionized slab with indicates that the opacity in Ly greatly exceeds that of CIV, which implies a larger pathlength increase for Ly than for CIV. This results in relatively more Ly absorption by dust. This effect explains how the ratio CIV/Ly increases somewhat with increasing . Dust absorption of resonant CIV on the other hand causes a comparable decrease in CIV/CIII]. What is important in these results is that, even with a concentration of internal dust as high as (equivalent to that in solar neighbourhood cold clouds), it is not possible to reproduce the high ratio CIV/Ly which is observed in some objects and has been attributed to dust. We emphasize that higher amounts of dust do not change these results. For instance models with do not lead to any higher Ly/CIV ratio than the models shown in Fig. 6.

When the clouds are viewed from behind, even with they are sufficiently opaque that all the UV lines are severely absorbed. With and , all of the high excitation UV lines become absorbed within the PIZ. To produce an acceptable spectrum, without reddened CIV/CIII] and CIV/HeII ratios, as seen from the back of an ionization bounded slab with , we have to use much smaller amounts of dust like (2% of local ISM) in models. In Fig. 7, we plot the back and front sequences for such models. These can reproduce the weak Ly objects although this result is obtained only for the back spectrum, emphasizing that perspective is the dominant factor. It should be noted that the amount of extinction within the ionization bounded slab implied by (i.e., –0.2) is consistent with the quantity of small dust grains needed to explain the extremely blue continuum of the “detached” ionized cloud in PKS 2152-69 (di Serego Alighieri et al. 1988; Magris & Binette private communication), supposing that the continuum energy distribution is the result of dust scattering of the nuclear radiation.
Note that because the scattering/absorbing dust is locally kinematically linked to the emission line gas, we require much smaller column densities of HI than the absorbing screen proposed by van Ojik et al. (1994) () to explain CIV/Ly. The line widths and centroids of the PIZ and of the fully ionized gas are expected to be quite similar within each of the emitting clouds, the ensemble of which could have a greater ‘turbulent’ velocity dispersion.
To reproduce the extreme case of the IRAS galaxy F10214+4724 with CIV/Ly, we need additional neutral gas beyond the PIZ. For instance, it requires only a column density of assuming . Alternatively we might consider that within the PIZ increases with depth as the degree of ionization decreases. In this case, no additional HI gas would be required. If this IRAS galaxy is indeed an extreme Seyfert 2 as argued by Elston et al. (1994), then a closed, dust enshrouded geometry as proposed by BWVM3 to explain the Lyman and Balmer decrements in Seyfert 2 would be more appropriate than the open geometry adopted here which may be applicable only to the truly extended large scale gas. It is likely that objects with unusually strong NV emission (such as in F10214+4724 and TX0211-122) are cases where the NV originates predominantly from the inner NLR. A high NV/CIV ratio indicates very enriched gas which is not unexpected within the inner parts of an AGN (Hamman & Ferland 1993) and is consistent with the lack of convincing evidence that NV is spatially resolved in any of these objects.
3.4 Neutral gas mirrors
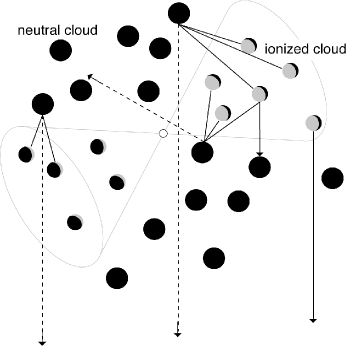
So far we have considered the effects of scattering by gas which forms part of the line emitting clouds: we refer to this as an ‘intrinsic’ process. Similar effects could be produced by a large-scale distribution of predominantly neutral material surrounding the emitting regions: we will refer to this as the ‘extrinsic’ case. Any extrinsic neutral gas component with a non-negligible covering factor could affect the observed spectra in a way which mimics that of the back perspective described earlier. Let us suppose that this outer material is broken up into cold gas clumps which are randomly distributed. In such a case, some Ly photons which leave the ionized cones will escape the region through the holes between the external clumps while others will strike the neutral clumps and be immediately scattered away to escape eventually through another hole in a different direction (see Fig. 8). If observed with sufficient spatial resolution, such a geometry would result in holes in the Ly brightness due to reflection by intervening clumps as well as diffuse sources corresponding to reflection from clumps on the far side of the source. The bulk of the Ly luminosity would be preserved but redistributed on an apparently larger scale than the true line emitting clouds. Only a more closed geometry would result in a significant destruction of Ly, assuming that the interclump space does not contain pure dust segregated from the gas phase.
The reflection efficiency of clouds will, of course, depend strongly on the relative velocity fields of the emitting and the cold regions. If the extended gas has a large scale ordered motion but small ‘microturbulence’, the reflection effects would be localized. Broad Ly emission and continuum from the AGN could, however, be scattered by any of the extranuclear clouds (see Sect. 3.4.2). In general, we would expect the diffuse, scattered Ly to show a narrower line than the integrated emission profile.
We will review the observational evidence for the existence of such large scale mirrors.
3.4.1 The radio galaxy PKS2104-242
PKS2104-242 (McCarthy et al. 1990b) shows very extended emission lines of Ly, CIV and HeII associated with continuum knots which lie between the radio lobes and are aligned with the radio axis. The Ly image shows emission resolved into three distinct clumps, two of them corresponding roughly with the two continuum knots. In addition, there appears to be a low surface brightness halo of emission surrounding the entire object. Is this halo a consequence of reflection by neutral material of either Ly emission or of the intense nuclear continuum, or are these photons emitted locally by H+ recombination? A way of discriminating between these two possibilities is to look for the detection of any other emission line in the halo. If Ly is the result of reflection by cold HI, there will be no other lines (except possibly resonant MgII). If it is instead produced by recombination, other lines should be detected in the rest-frame optical band like H, [OIII]5007, etc.
3.4.2 The radiogalaxy 3C 294
From images of this object, McCarthy et al. (1990a) report the existence of Ly emission extending over a region covering 170kpc. The Ly emission is elongated and well aligned with the inner radio-source. An intriguing aspect of the observations is the one-sidedness of the CIV emission (obtained with an long slit aligned with the axis of elongation). The decreasing linewidth of Ly on the side where CIV is absent (South) suggests to us the possibility that Ly in the south corresponds to scattered continuum and BLR Ly photons by HI clumps lying along this direction provided the ionizing radiation has already been reprocessed (filtered out) within the nuclear regions into NLR or BLR emission.
Failing that (scattering by HI clumps), an alternative possibility resides in very thin matter-bounded photoionized sheets of gas which can be very efficient at reflecting the intense (beamed) nuclear continuum as well as BLR Ly photons. Due to its large scattering cross section, very small column depths of H0 (a trace specie within the ionized phase) are sufficient to scatter effectively the impinging flux within the core of the Ly thermal profile. If we suppose the existence within the cone of ionization of the radio-galaxy of a population of clouds of similar physical conditions to that thought to apply to Ly forest clouds, the energy reflected due to resonant scattering by HI typically exceeds that generated within the clouds by reprocessing of the ionizing radiation (i.e. by recombination). In effect, adopting as a typical column density of such cloud, we derive an equivalent width in absorption (i.e. the scattered intensity) of
which corresponds to the saturated part of the Ly curve of growth, assuming km s-1. Adopting for definiteness and , we obtain that the fraction of reprocessed ionizing photons, , within a very thin photoionized sheet111With these parameters, the total column density is given by . is given by
The equivalent width of Ly in emission as a result of recombination is simply
where is the covering factor. If we integrate the absorbed intensity over the same area as that given by , the ratio of scattered versus emitted Ly is (the ratio between the above two equivalent widths). Allowing for the fact that the cloud will be exposed not only to the nuclear continuum but to the BLR Ly which typically peaks at twice the continuum level, the ratio can be expected to increase up to 8 times the Ly emitted by recombination. To account for the observed FWHM km s-1 in 3C294 (South), one most rely on a turbulent velocity field for the the Ly clouds.
We ought to consider seriously the possibility that Ly on the southern knot of 3C294 corresponds to large scale scattered light by either HI or even ionized gas unless other bona fide emission lines were detected. So far, no other lines than Ly are observed which is consistent with our suggestion. The only certain way of discriminating between reflection and in situ emission would be the detection at this radius of any non-resonance line in either the optical ([OII], [OIII], H etc.) or the UV (CII], CIII]). To conclude, we believe that HII regions or starbursts should not be considered the default emission mechanism in cases where only Ly is present, especially along the axis where the AGN supposedly collimates its intense nuclear continuum + Ly(BLR) light.
3.4.3 Ly absorption in 0943-242
The radio galaxy 0943-242 shows a Ly profile with several absorption features which cover the whole of spatial extent of the Ly emission (Röttgering et al. 1995). The strongest of the absorbers is at least as extended spatially as the emitting region ( kpc) and its HI column density is . The absorption line is blue-shifted by 250km s-1 with respect to the emission peak. The ‘screen’ is kinematically distinct from the emitting gas and therefore clearly external to the emitting clouds). This is a clear demonstration that HI screens — or mirrors depending on the perspective — exist on galaxy scales at these early epochs. From Fig. 5 of Röttgering et al., we estimate that this cloud would reflect % of the Ly. Thicker clouds could exist around other objects but would be hard to detect when only the faint wings at the extremities of the emission profile were transmitted. In the case of 0943-242, even if the screen contained dust, its effects would be negligible. The reason, as stated before, is that Ly photons (seen by the cloud) are incident from the exterior and will be very effectively scattered away before being absorbed by the dust. Even the photons getting through (i.e., without any scattering) to us because they are sufficiently far in the wings of the profile would not see much dust in this particular cloud. With such low column densities, for and 0.005 for . Much thicker clouds may result in some non-negligible extinction but again this does not arise because of the multiple scattering of Ly.
4 Conclusions
If the large-scale extended emission line regions (EELR) in radio galaxies are photoionized predominantly by the collimated UV radiation emitted by a hidden AGN, the line emission and transfer processes are characterized by what we call an ’open’ geometry with externally illuminated clouds. This produces an emission line spectrum which is distinctly different from an internally ionized HII region, especially in the ultraviolet.
Our principal conclusion is that internal dust, even in proportions as large as that found in the solar neighbourhood, does not satisfactorily explain the large CIV/Ly ratios commonly seen in groundbased observations of high redshift radio galaxies. Note that the maximum amount of dust considered here () should be considered a sensible upper limit on the ground that: a) the extended large scale gas (kpc) in radio galaxies is likely to be less than solar in metallicity, b) the physical conditions found within the higly ionized warm plasma threatens dust survival and a more realistic approach would favour using . In any event, more dust does not lead to any higher Ly/CIV ratio as we have verified with models in which .
We have demonstrated that geometrical effects can, in most cases without invoking any dust, explain the observed trends in the data. Although we agree that internal dust can quite effectively kill the Ly luminosity, we consider essential to examine also its effects on the other UV lines — especially CIV which is also a resonance transition.
Although some internal dust within the ionized gas is allowed by our modeling and even improve things in a few cases, we find that the effects of geometrical perspective dominate the intended decrease of Ly without affecting excessively the other lines. The current work demonstrates that the faintness of Ly is not sufficient per se to imply the existence of large amount of dust in these objects.
The influence of the geometrical factors discussed above on the line spectrum gives us, potentially, a natural explanation for some of the emission line asymmetries seen in the ’alignment effect’ in radio galaxies.
We have also investigated the effects that material external to the ionized cones will have on the appearance of the object in the light of Ly. We suggest that the existence of the diffuse Ly halos observed in some high z radio galaxies could be due to the reflection of Ly photons by neutral clumps lying outside the ionization cones. In addition to reflecting Ly, such neutral clouds could be responsible for the spatially extended absorption seen within the Ly emission profile. Pure Ly emission clouds need not, therefore, necessarily be identified as star-forming regions.
Acknowledgements.
MV-M acknowledges support from the Deustche Forschungsgemeinschaft; also thanks the Observatoire de Lyon for its hospitality during a collaborative trip in June 1995 and Jacco van Loon for useful discussions.References
- [\citenameAnders & Grevesse1989] Anders E., Grevesse N. 1989, Geochim. Cosmochim. Acta, 53, 197
- [\citenameBinette et al.a 1993] Binette L., Wang J.C.L., Zuo L., Magris C.M. 1993a, AJ, 105, 797
- [\citenameBinette et al.b 1993] Binette L., Wang J., Villar-Martín M., Martin P.G., Magris C.M. 1993b, ApJ, 414, 535 (BWVM3)
- [\citename] Chambers K.C., Miley G.K., van Breugel W.J.M. 1987, Nature, 329, 604
- [\citename] Chambers K.C., Miley G.K., van Breugel W.J.M. 1990, ApJ, 363, 21
- [\citename] Chini R., Krügel E. 1994, A&A, 288, L33
- [\citename] Cimatti A., di Serego Alighieri S., Fosbury R.A.E., Salvati M., Taylor D. 1993, MNRAS, 264, 421
- [\citename] di Serego Alighieri, S., Binette, L., Courvoisier, T. J- L., Fosbury, R.A.E. & Tadhunter, C.N. 1988. Nature, 334, pp. 591-593
- [\citename] di Serego Alighieri S., Cimatti A., Fosbury R.A.E. 1993, ApJ, 404, 584
- [\citename] Dey A., Spinrad H., Dickinson M. 1995, ApJ, 440, 515
- [\citename] Dunlop J.S., Hughes D.H., Rawlings S., Eales S.A., Ward M.J. 1994, Nature, 370, 347
- [\citename] Eales S.A., Rawlings S. 1993, ApJ, 411, 67
- [\citename] Elston R., McCarthy P.J., Eisenhardt P., Dickinson M., Spinrad H., Januzzi B.T., Maloney P. 1994, AJ, 107, 910
- [\citenamed1990] Fosbury R.A.E., di Serego Alighieri S., Courvoisier T., Snijders M.A.J., Tadhunter C.N., Walsh C.N., Wilson W. 1990, in Evolution in Astrophysics, Toulouse, ESA SP-310
- [\citename] Hamman F., Ferland G. 1993, ApJ, 418, 11
- [\citename] Heckman T.M., Chambers K.C., Postman M. 1992, ApJ, 391, 39
- [\citename] Hummer D.G., Kunasz P.B. 1980, ApJ, 236, 609
- [\citename] Ivison R.J., MNRAS, 275, L33 1995
- [\citename] Lilly S.J. 1988, ApJ, 333, 161
- [\citename] Magris C., G., Binette L., & Martin. P. G. 1993, in proc. The Nearest Active Galaxies, ed. J. Beckman; Astrophysics and Space Science, 205, p. 141
- [\citename] McCarthy P.J., van Breugel W.J.M., Spinrad H., Djorgovski S. 1987, ApJ, 321, L29
- [\citename] McCarthy P.J., Spinrad H., van Breugel W.J.M., Liebert J., Dickinson M., Djorgovski S., Eisenhardt P. 1990a, ApJ, 365, 487
- [\citename] McCarthy P.J., Kapahi V.K., van Breugel W.J.M., Subrahmanya C.R. 1990b, AJ, 100, 1014
- [\citename] McCarthy P.J., van Breugel W.J.M. 1991a, ApJ, 371, 478
- [\citename] McCarthy P.J., van Breugel W.J.M., Kapahi V.K., Subrahmanya C.R. 1991b, AJ, 102, 522
- [\citename] McCarthy P.J., Elston R., Eisenhardt P. 1992, ApJ, 387, L29
- [\citename] McCarthy P.J. 1993, ARA&A 31, 639
- [\citename] Morganti R., Robinson A., Fosbury R.A.E., di Serego Alighieri S., Tadhunter C.N. Malin D.F. 1991, MNRAS, 249, 91
- [\citename] van Ojik R., Röttgering H.J.A., Miley G.K., Bremer M.N., Macchetto F., Chambers, K.C. 1994, A&A, 289, 54
- [\citename] van Ojik R. 1995, Ph.D.thesis, Rijksuniversiteit te Leiden
- [\citenameRBFT87 1987] Robinson A., Binette L., Fosbury R.A.E., Tadhunter C.N. 1987, MNRAS, 227, 97 (RBFT87)
- [\citename] Röttgering H.J.A., Hunstead R.W., Miley G.K., van Ojik R., Wieringa M.H. 1995, MNRAS, 277, 389
- [\citename] Serjeant S., Lacy M., Rawlings L.J., King L.J., Clements D.L. 1995, MNRAS, 276, L31
- [\citename] Spinrad H., Filippenko A.V., Wyckoff A., Stocke J.T., Wagner R.M., Lawrie D.G. 1985, ApJ, 299, L7
- [\citename] Spinrad H., Dey A., Graham J.R. 1995, ApJ, 438, L51
- [\citename] Sutherland R.S., Bicknell G.V., Dopita M.A. 1993, ApJ, 414, 510
- [\citenameTadhunter et al. 1988] Tadhunter C.N. 1986, D.Phil. Thesis, University of Sussex
- [\citename] Tadhunter C.N., Fosbury R.A.E., di Serego Alighieri S. 1988, in: Maraschi L., Maccacaro T. & Ulrich M.H., eds., ”BL Lac Objects”, Springer-Verlag, Berlin, p.79
- [\citenamet1991] Tadhunter C.N., Scarrot S.M., Draper P., Rolph C. 1992, MNRAS, 256, 53p
- [\citenameTadhunter, Fosbury & Quinn 1989] Tadhunter C.N., Fosbury R.A.E., Quinn P.J. 1989, MNRAS, 240, 255
- [\citenameTadhunter, Robinson & Morganti1989] Tadhunter C.N., Robinson A., Morganti, R. 1989, in: ESO Workshop on Extranuclear Activity in Galaxies, p. 293, eds Meurs, E.J.A., Fosbury, R.A.E., ESO Conf. and Workshop Proc. No. 32, Garching
- [\citename] Viegas S.M., Prieto A. 1992, MNRAS, 258, 483
- [\citenameWhittet 1992] Whittet D.C.B. 1992, Dust in the Galactic Environment (Bristol:IOP)
- [\citenameWilson & Tsvetanov 1994] Wilson A.S., Tsvetanov Z. 1994, AJ, 107, 1227
- [\citename] Windhorst R.A., Burstein D., Mathis D.F., Lyman W.N., Bertola F., Buson L.M., Koo D.C., Matthews K., Barthel P.D., Chambers K.C. 1991, ApJ, 380, 362