08 (08.06.3; 08.09.2: HD 149499 B; 8.23.1)
S. Jordan
Temperature determination of the cool DO white dwarf HD 149499 B from EUVE observations††thanks: Based on observations with the EUVE and ROSAT satellites
Abstract
We present a LTE model atmosphere analysis of the EUVE medium and long wavelength spectrum of the cool DO white dwarf HD 149499 B. This observation in the spectral range 230-700 Å supplements a previous analysis of an ORFEUS spectrum between 912 and 1170 Å which yielded the atmospheric parameters K and and a hydrogen-to-helium number ratio of . The EUVE data are in full agreement with the ORFEUS result and allow a more precise determination of the effective temperature ( K) and the interstellar hydrogen column density ( cm-2). None of the features in the EUVE spectrum could be identified with any additional absorber besides helium. Exploratory calculations with fully metal blanketed LTE model atmospheres show that the metal abundances predicted by current diffusion theory are clearly at variance with the observed spectrum.
keywords:
Stars: atmospheric parameters — Stars: individual: HD 149499 B — Stars: white dwarfs1 Introduction
White dwarfs can be divided into two groups: the spectral class DA showing only the Balmer lines of hydrogen in their optical spectrum and the non-DA white dwarfs. The atmospheres of the latter are mostly dominated by helium. Depending on the effective temperature (), the spectra are either characterized by He ii (DO stars with K are also showing He i lines at the cool end), He i lines (spectral class DB with K K) or exhibit a continuous spectrum in the optical ( K). Between the DO stars and the DB stars a hitherto unexplained gap exists: no hydrogen poor star is found between 28 000 and 45 000 K (Liebert et al 1986). Possibly the non-DA sequence is the progeny of the PG 1159 stars which are helium, carbon, and oxygen rich.
Since even the FUV wavelength range of the DO stars ( K) is on the Rayleigh-Jeans tail of the electromagnetic spectrum, no accurate temperature determination can be expected from continuum fitting. More promising is the use of line profiles with elaborate model atmospheres, especially the utilization of ionization equilibria (e.g. He i/He ii) by fitting lines of different ionization stages for the determination; this approach has e.g. been used by Koester et al. (1979) for a LTE analysis of the cool DO HZ 21. The most comprehensive spectral analysis of DO stars with NLTE model atmospheres was performed by Dreizler & Werner (1996). They could not identify hydrogen neither in optical nor in UV spectra; in the cooler DAs hydrogen should be easily detectable in the optical if the hydrogen abundances exceed about 10%. Therefore, HD 149499 B remains the only star with strong — though indirect — indications for the presence of hydrogen (Napiwotzki et al. 1995).
With HD 149499 B, the secondary of a binary, is brighter than any other DO white dwarf. The KOV primary () of the system is only away and strongly contaminates the optical spectrum.
In the UV/FUV region the white dwarf flux dominates at least up to 2100 Å (Sion et al. 1982, Wray et al. 1979). However, since it is not possible to detect the He i lines in the optical region, the temperature determination of this DO remained controversial until recently: Sion et al. (1982) determined K from a fit of the He ii lines in the IUE range and the comparison of the continuum flux. In disagreement with this result, Wray et al. (1979) derived K K from the continuum fit only.
Napiwotzki et al. (1995) performed an analysis of a FUV spectrum of HD 149499 B taken with the EUV/FUV Berkeley spectrometer of the ORFEUS experiment and obtained the first reliable temperature determination of HD 149499 B: K. Their most important result was that photospheric hydrogen could be inferred from the ORFEUS spectrum. The closeness of HD 149499 B to the DB gap, in which all white dwarfs probably become hydrogen rich makes it a very unique object for the understanding of how the transition of former DO white dwarfs into DAs below about 50 000 K may occur.
Since no He i line is detectable in the FUV, the temperature and gravity determination of HD 149499 B by Napiwotzki et al. (1995) is based on a simultaneous fit of the He ii (Balmer) series in the ORFEUS wavelength range, which limits the accuracy of the temperature. Since no broadening tables with up to date theories are available for these lines, systematic errors cannot be excluded. Thus we complement the analysis of HD 149499 B with data gathered with the EUVE satellite in order to put further constraints on the atmospheric parameters of HD 149499 B.
The EUV is well suited for the detection of metal features in hot white dwarfs (e.g. Vennes et al. 1989, Barstow et al. 1995, Jordan et al. 1996a ). Therefore we tried to identify lines of heavy elements and calculated model spectra to check the predictions of diffusion theory. Currently, RE0503-289 is the only DO white dwarf in which features of carbon and nitrogen could be identified in an EUV spectrum (Barstow et al. 1995).
2 Observations
The EUV spectra of HD 149499 were obtained during June 23-27, 1993 with the EUVE satellite; the effective exposure time was 91732 sec. The three spectrometers of EUVE cover the wavelength intervals Å (short-wavelength; SW), Å (medium-wavelength; MW), and Å (long-wavelength; LW) with a spectral resolution of . Since the spectra have not been observed in dithered mode it is likely that some of the observed features are caused by fixed pattern noise.
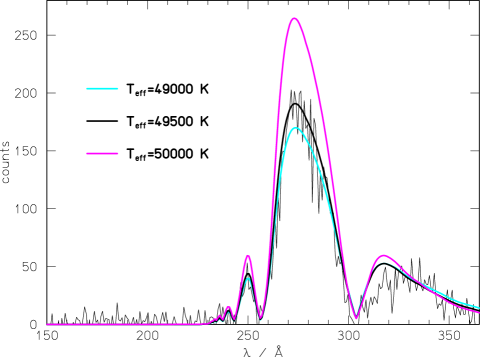
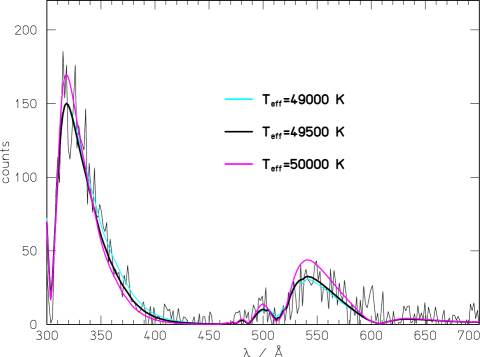
Significant flux was detected in the MW and LW ranges only. The first lines of the He ii resonance series (303.8, 256.3, and 243.0 Å) are clearly visible (Fig. 2 and 3). Napiwotzki et al. (1996) performed a preliminary analysis of the EUVE spectra using the data from the EUVE standard extraction. However, in Fig. 2 of their paper a 20% inconsistency between the flux measured with the MW and LW spectrograph, respectively, can be noticed. Thus, we have repeated the data reduction for this paper with the EUV package in IRAF111IRAF is distributed by the National Optical Astronomy Observatories, which is operated by the Association of Universities for Research in Astronomy, Inc. (AURA) under cooperative agreement with the National Science Foundation with the result that the inconsistency disappeared (see Sect. 3.2).
The HD 149499 system was observed with ROSAT during a pointed observation on March 15, 1993, with an exposure time of 1376 sec. ROSAT carries aboard two instruments: a X-ray telescope, which we used in connection with the PSPC (positional sensitive proportional counter) detector, and the Wide Field Camera (WFC). The PSPC covers approximately the energies between 0.1 keV and 2.4 keV ( Å) with a modest energy resolution.
The WFC measurement was made through the P1 filter. No flux was detected in the corresponding spectral range ( Å). In the ROSAT WFC All-Sky Survey (Pye et al. 1995), where the S1 ( Å) and S2 ( Å) filters were used, HD 149499 B also remained undetected.
3 Analysis
3.1 The ROSAT observation
Typically, no X-ray flux of DO white dwarfs ist measured above 0.4 keV (see e.g. Werner et al. 1995). However, the observed pulse height distribution (PHD, Fig. 1) of HD 149499 B exhibits flux up to 1.5 keV. We have reduced and analyzed the ROSAT data as described in Jordan et al. (1994). The predicted PHD for a model with the parameters derived from the ORFEUS and EUVE analysis (see Sect. 3) is a factor of lower than observed ( counts/sec). Therefore we conclude that practically all of the measured soft X-ray flux originates from the K0V star companion. We adopted the conversion factor erg cm-2 ct-1 (Hempelmann et al. 1995) and the distance pc (Ianna et al. 1982) and computed an X-ray luminosity erg/sec. This corresponds to a relative X-ray luminosity . From a comparison with the ROSAT sample of late type main sequence stars presented by Hempelmann et al. (1995), we conclude that HD 149499 A displays high activity. Further insights may be gained from a measurement of the rotational period of this star.
3.2 The EUVE spectra
3.2.1 Temperature determination
The LTE model atmosphere codes of Koester were used to calculate an extensive grid of HHe models in the relevant parameter range of HD 149499 B. The model code uses the classical assumptions of LTE models: plane-parallel stratification, hydrostatic and radiative equilibrium. Convection is taken into account using the ML1 version of the mixing length approximation with l/Hp =1.
With the help of these model atmospheres Napiwotzki et al. (1995) have analyzed the FUV spectrum of HD 149499 B obtained with the Berkeley EUV/FUV spectrometer of the ORFEUS experiment. Significant flux was detected above the Lyman edge of hydrogen up to Å. The basic atmospheric parameters were obtained by a simultaneous fit of the He ii series and the coinciding Lyman lines yielding K, , and .
In a first step we tried to reproduce the EUVE spectra with synthetic spectra calculated with the atmospheric parameters derived from the ORFEUS analysis. Just as in the case of the ORFEUS FUV spectrum we normalized the model flux according to the observed flux at 1150 Å. Subsequently, the predicted photon flux was convolved with the detector response of the spectrograph taking into account higher order contamination. The interstellar absorption was calculated according to Rumph et al. (1994) and Morrison & MacCammon(1983).
In Fig. 2 and 3 we compare the EUVE observations to the predictions from the “ORFEUS” model and two synthetic spectra for effective temperatures differing by K (corresponding to the 1 error of the Napiwotzki et al. 1995 solution). The best fit was found at K, in full agreement with the ORFEUS result. Since the models with 49 000 and 50 000 K already show strong deviations we believe that the EUVE analysis improves the accuracy of the temperature determination to about 200 K if possible systematic errors caused by the accuracy of the calibration are ignored.
The hydrogen column density found () is also consistent with the value derived by fitting the interstellar components of the hydrogen Lyman lines in the ORFEUS spectrum. Therefore the value of determined indirectly by Bruhweiler & Kondo (1982) from interstellar N i lines appears clearly too low.
The overall flux distribution in both spectral ranges is well reproduced by our LTE model. Moreover, the inconsistency between the MW and LW range, seen in Fig. 2 of Napiwotzki et al. (1996), is no longer present in the newly extracted spectra. Only in the red wing of the He ii line at 303.8 Å a small depression is visible in the MW spectrum which is not present at the same wavelength in the LW observation. We believe that this is due to fixed pattern noise.
The photons nominally measured at Å can be entirely explained by second order contamination from the flux between 228 and 350 Å. Since the flux at Å is zero, no such contamination occurs in the MW region.
3.2.2 Influence of hydrogen and surface gravity
In a second step we tried to find out if our most important result namely that about 20% hydrogen is present in the atmosphere can be confirmed by our EUVE observations. Therefore we compared the MW and LW spectra with theoretical models for a pure helium atmosphere. Although the flux level in the EUVE is about 30-40% lower in this case (due to a weaker Lyman absorption edge of hydrogen at 911 Å and a somewhat stronger one at 504 Å due to He i) this effect can be compensated by an increase of the effective temperature by 200 K and a reduction of by about cm-2, well within the error limits. If we vary our models within the error range of hydrogen abundances from the ORFEUS analysis the influence on the EUVE spectrum can be ignored. This means that the EUVE spectrum does not provide any information about additional to the FUV region.
Likewise we have tested the influence of on our temperature determination. A change of 0.08 dex corresponds to a K difference in . In order to obtain a significant deviation about 0.3 dex are necessary: at we find the best fit at about K and cm-2, while at the observation is best reproduced at K and cm-2.
Thus the accuracy of the temperature determination is better than 200 K if the gravity and the hydrogen abundance are only varied within the error limits of the ORFEUS solution. However, the undithered spectrum does not allow an independent simultaneous fit for , , and .


3.2.3 Search for the presence of metals
Although the EUVE spectra are contaminated by fixed pattern noise, we have tried to find out if any of the observed features besides the He ii lines can be attributed to heavier absorbers. Metals are expected to be present in the atmosphere due to radiative levitation: For K, Chayer et al. (1995) and Chayer (priv. comm.) predict number ratios of metals relative to helium as listed in Tab. 1.
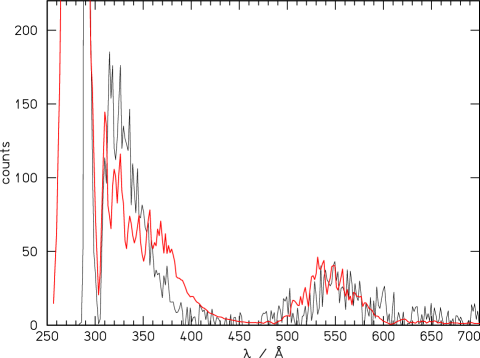
For this mixture and the atmospheric parameters K, , and we have calculated fully line blanketed LTE model atmospheres accounting for several million lines (taken from the Kurucz 1991 tables) by an opacity sampling technique (resolution Å). The bound-free opacities of C, N O, Ne, Mg, Si, S, Ar, Ca, and Fe are calculated using Opacity Project data (Seaton 1987, Seaton et al. 1994); for Ni a hydrogenic approximation has been used.
| number ratio | |
|---|---|
| C/He = | |
| N/He = | |
| O/He = | |
| Ne/He = | |
| Na/He = | |
| Mg/He = | |
| Al/He = | |
| Si/He = | |
| S/He = | |
| Ar/He = | |
| Ca/He = | |
| Fe/He = | |
Theoretical EUVE spectra for this composition are shown in Fig. 4 and 5: in both, the MW and the LW range, strong features occur, some of them being in clear disagreement with the observation. Moreover, the fit to the overall energy distribution becomes somewhat worse compared to Fig. 2 and Fig. 3 where atmospheres containing only hydrogen and helium have been used.
Finally, we tried to find out if any of the features in the EUVE spectra can be attributed to individual elements. We calculated theoretical spectra for K, , and a single additional element with an abundance given by Table 1. The results are:
-
•
None of the features predicted forcarbon can be identified in the SW or MW spectra. The number ratio of can be regarded as an upper limit since some of the absorption lines are already stronger than the “noise” level.
-
•
A nitrogen abundance of can be definitely excluded due to a rather strong N iv absorption feature at about 283 Å which is not observed.
-
•
At about the same wavelength the only significant absorption line of Ne occurs. At it is, however, much weaker so that Ne can in principle be present even at a somewhat higher abundance.
-
•
Sodium does not exhibit any strong features in the EUVE so that its presence can neither be confirmed nor excluded.
-
•
Due to a relatively strong predicted S iii line at 276 Å we can conclude that the number ratio cannot be much higher than .
-
•
Likewise a feature at 339 Å in the theoretical spectrum is still compatible with the observation if is assumed but can also be regarded as an approximate upper limit.
-
•
From the mixture given in Table. 1 the strongest absorption lines are predicted for Ca and Fe. Both, and , are clearly at variance with the observation and must be lower by at least one dex.
For a more precise analysis a dithered EUVE spectrum would be necessary.
4 Discussion
The HD 149499 system is a bright source in the PSPC camera of ROSAT. We showed that the measured X-ray flux is attributed to the main sequence component HD149499A. It indicates a high level of coronal activity in this K0V star.
HD 149499 B is a rather unique object since it is one of the coolest DO stars, close to the DB gap, and it is the only DO in which hydrogen has been detected (Napiwotzki et al. 1995).
Our goal was to investigate if the MW and LW EUVE spectra of HD 149499 B can further constrain the atmospheric parameters derived by our analysis of the ORFEUS spectrum. Since only two spectral lines of He ii are visible in the EUVE spectra well above the noise level, we could not use the spectra for a simultaneous determination of , , and , and the interstellar column density. However, the EUVE observation is consistent with the ORFEUS result: For and we obtain K with an accuracy of about 200 K. A precise temperature determination is rather important since currently the blue edge of the DB gap is not well determined; there is no known DO white dwarf significantly cooler than 50 000 K.
Unfortunately, the analysis of the EUVE data does not set any further limits to the hydrogen abundance and the gravity, since changes in or can be compensated by rather small changes in and .
With the help of fully line blanketed LTE model atmospheres we could show that the the mixture of metals predicted by the current diffusion theory (Chayer et al. 1995) is in worse agreement with the EUVE observations than a H+He model. Although no individual elements could be identified in the spectra we conclude that iron, calcium, and nitrogen are less abundant compared to the Chayer et al. values; moreover, the content of carbon, sulphur, and argon in the atmosphere of HD 149499 B is at least not higher than predicted. Carbon is the only other element beside helium which could be identified by high resolution UV spectroscopy. Werner & Dreizler (1996) derived from IUE data.
While pratically all DA white dwarfs are metal deficient relative to the predictions of the diffusion theory (Jordan et al. 1996a, 1996b; Finley 1996), Dreizler & Werner (1996) have shown that among the DO stars both cases exist, those where the observed abundances of C, N, O, and Si are higher than the predictions and those where the number ratios are lower. These confusing results show that it is necessary to improve the theory of diffusion in hot white dwarfs.
Acknowledgements.
This research has made use of the SIMBAD database, operated at CDS, Strasbourg, France. Work on ROSAT and ORFEUS in Kiel was supported by DARA grant 50 OR 94091.References
- [1] Barstow, M.A., Holberg J.B., Koester, D., Nousek J.A., Werner, K., 1995, in White Dwarfs, Lecture Notes in Physics, eds. D. Koester & K. Werner, Springer, p. 302
- [2] Bruhweiler, F.C., Kondo, Y. ,1982, ApJ 259, 232
- [3] Chayer, P., Fontaine, G., Wesemael, F., 1995, ApJS 99, 189
- [4] Dreizler, S., Werner, K., 1996, A&A, in press
- [5] Feibelman, W.A., Bruhweiler, F.C., 1990, ApJ 357, 548
- [6] Finley D.S., 1996, in Astrophysics in the Extreme Ultraviolet, eds. S. Bowyer and R.F. Malina, Kluwer, p. 223
- [7] Hempelmann, A., Schmitt, J.H.M.M., Schultz, M., Rüdiger, G., Stȩpień, K. 1995, A&A 294, 515
- [8] Ianna, P.A., Rohde, J.R., Newell, E.B., 1982, ApJ 259, L71
- [9] Jordan, S., Wolff, B., Koester, D., Napiwotzki, R. 1994, A&A 290, 834
- [10] Jordan, S., Koester, D., Finley, D., 1996a, in Astrophysics in the Extreme Ultraviolet, eds. S. Bowyer and R.F. Malina, Kluwer, p. 235
- [11] Jordan, S., Finley, D., Koester, D., Wolff, B., 1996b, in Röntgenstrahlung from the Universe, MPE Report 263, p. 5
- [12] Koester, D., Liebert, J., Hege, E.K., 1979, A&A 71, 163
- [13] Kurucz R.L., 1991, in Stellar Atmospheres: Beyond Classical Models, NATO ASI Series, 341, p.441
- [14] Liebert, J., Wesemael, F., Hansen, C.J. et al., 1986, ApJ 309, 241
- [15] Morrison R., MacCammon D., 1983 ApJ 270, 119
- [16] Napiwotzki, R., Hurwitz, M., Jordan, S., Bowyer, S., Koester, D., Weidemann, V., Lampton, M., Edelstein J., 1995, A&A 300, L5
- [17] Napiwotzki, R., Jordan, S., Bowyer, S., Hurwitz, M., Koester, D., Rauch, T., Weidemann, V., 1996, in Astrophysics in the Extreme Ultraviolet, eds. S. Bowyer & R.F. Malina, Kluwer, p. 241
- [18] Pye J.P., McGale P.A., Allan D.J., et al., 1995, MNRAS 274, 1165
- [19] Seaton, M.J., 1987, JPhysB 20, 6363
- [20] Seaton, M.J., Yan Y., Mihalas, D., Pradhan, A. K., 1994, MNRAS 266, 805
- [21] Rumph T., Bowyer S., Vennes S., 1994, AJ 107, 2108
- [22] Sion, E.M., Guinan, F., Wesemael, F., 1982, ApJ 255, 232
- [23] Vennes, S., Chayer, P., Fontaine, G., Wesemael, F., 1989, ApJ 336, L25
- [24] Werner, K. 1986, A&A 161, 177
- [25] Werner, K. 1993, in: White dwarfs: advances in observation and theory, ed. M.A. Barstow, Kluwer, Dordrecht, p. 67
- [26] Werner, K., Dreizler, S. , Wolff, B. 1995, A&A 298, 567
- [27] Wray, J.D., Parsons, S.B., Henize, K.G., 1979, ApJ 234, L187