Simultaneous H, Nai D1, D2, and Hei D3 observations of a flare on the RS CVn system UX Ari ††thanks: Based on observations made with the Isaac Newton telescope operated on the island of La Palma by the Royal Greenwich Observatory at the Spanish Observatorio del Roque de Los Muchachos of the Instituto de Astrofísica de Canarias on behalf of the Science and Engineering Research Council of the United Kingdom and the Netherland Organization for Scientific Research.
Abstract
We present simultaneous H, Nai D1, D2, and Hei D3 spectroscopic observations on the RS CVn system UX Ari. We have found a dramatic increase in the excess H emission equivalent width by a factor of 2 in an interval of 1 day that indicates the beginning of a strong flare in this system. The presence of the Hei D3 in emission in coincidence with the enhancement of the H emission confirms the detection of a flare. The application of the spectral subtraction technique reveals that the core of the Nai D1 and D2 lines are also filled-in by chromospheric emission.
Key words: stars: activity – stars: binaries: close – stars: chromospheres – stars: flare – stars: late-type
1 Introduction
The RS CVn system UX Ari (HD 21242) is a non-eclipsing double-lined spectroscopic binary with spectral type (G5V/K0IV) and orbital period of 6.43791 days. It is one of the few RS CVn systems, along with V711 Tau, IIPeg, and DM UMa, that shows H consistently in emission. The extensive Caii H & K and H observations of UX Ari (Carlos & Popper 1971; Bopp & Talcott 1978; Nations & Ramsey 1986; Huenemoerder et al. 1989; Frasca & Catalano 1994; Raveendran & Mohin 1995; Montes et al. 1995a,b,c) show that the chromospheric emission belongs to the cooler component of the system, however some authors (Simon & Linsky 1980; Huenemoerder et al. 1989) also found a small contribution from the G5V secondary component.
Simon et al. (1980) observed a UV flare on UX Ari and found that chromospheric lines were enhanced 2.5 times their quiescent level, while transition region lines displayed an enhancement by a factor of up to 5.5. They proposed an activity scenario for long-lived RS CVn flares in which the component stars have large corotating flux tubes which occasionally interact. The resulting magnetic reconnection leads to flares. Recently, Henry & Newsom (1996) have detected, with photometric observations, an optical flare in this system.
In this paper, we report the detection of an optical flare in UX Ari through simultaneous observations of the chromospheric H and Hei D3 lines. It is the first time that the Hei D3 line is observed in emission in UX Ari, moreover, a filled-in in the Nai D1 and D2 lines have been found. In Sect. 2 we give the details of our observations and data reduction and we describe the method of spectral subtraction to obtain the active-chromosphere contribution. In Sect. 3 we describe the behaviour of the chromospheric activity indicators and Sect. 4 gives the conclusions.
2 Observations and Data Reduction
Observations of UX Ari in the H and Hei D3 line regions have been obtained during three nights (1995 September 13-15) with the Isaac Newton Telescope (INT) at the Observatorio del Roque de Los Muchachos (La Palma, Spain) using the Intermediate Dispersion Spectrograph (IDS) with grating H1800V, camera 500 and a 1024x1024 pixel TEK3 CCD as detector. The reciprocal dispersion achieved is 0.24Å/pixel which yields a spectral resolution of 0.48Å and a useful wavelength range of 250Å centered at 6563Å (H) and 5876Å (Hei D3) respectively.
The spectra have been extracted using the standard reduction procedures in the IRAF package (bias subtraction, flat-field division, and optimal extraction of the spectra). The wavelength calibration was obtained by taking spectra of a Cu-Ar lamp. Finally, the spectra have been normalized by fitting a continuum.
We have obtained the chromospheric contribution in H and Hei D3 lines using the spectral subtraction technique described in detail by Montes et al. (1995a,c). In this method the synthesized spectra were constructed from artificially rotationally broadened, radial-velocity shifted, and weighted spectra of inactive stars chosen to match the spectral types and luminosity classes of both components of the active system under consideration. For UX Ari we have used as reference stars HD20630 (G5V) and HD23249 (K0IV) and we have adopted the vsini (6/37) from Strassmeier et al. (1993), (hereafter CABS).
| H broad component | H narrow component | |||||||||||||
| Date | UT | I | FWHM | EW | L (1030) | I | FWHM | EW | I | FWHM | EW | |||
| (Å) | (Å) | erg cm-2 s-1 | erg s-1 | (Å) | (Å) | (Å) | (Å) | |||||||
| 1995/09/13 | 02:08 | 0.42 | 0.722 | 1.89 | 1.798 | 6.85 | 9.52 | 0.302 | 3.720 | 1.194 | 0.431 | 1.317 | 0.605 | |
| 1995/09/13 | 05:08 | 0.44 | 0.626 | 1.82 | 1.405 | 6.74 | 7.39 | 0.297 | 2.917 | 0.922 | 0.344 | 1.316 | 0.483 | |
| 1995/09/14 | 02:24 | 0.58 | 0.609 | 1.83 | 1.476 | 6.76 | 7.74 | 0.145 | 5.153 | 0.778 | 0.468 | 1.512 | 0.753 | |
| 1995/09/15 | 03:09 | 0.74 | 0.996 | 2.51 | 3.286 | 7.11 | 17.3 | 0.405 | 5.414 | 2.229 | 0.580 | 1.723 | 1.069 | |
3 Chromospheric activity indicators
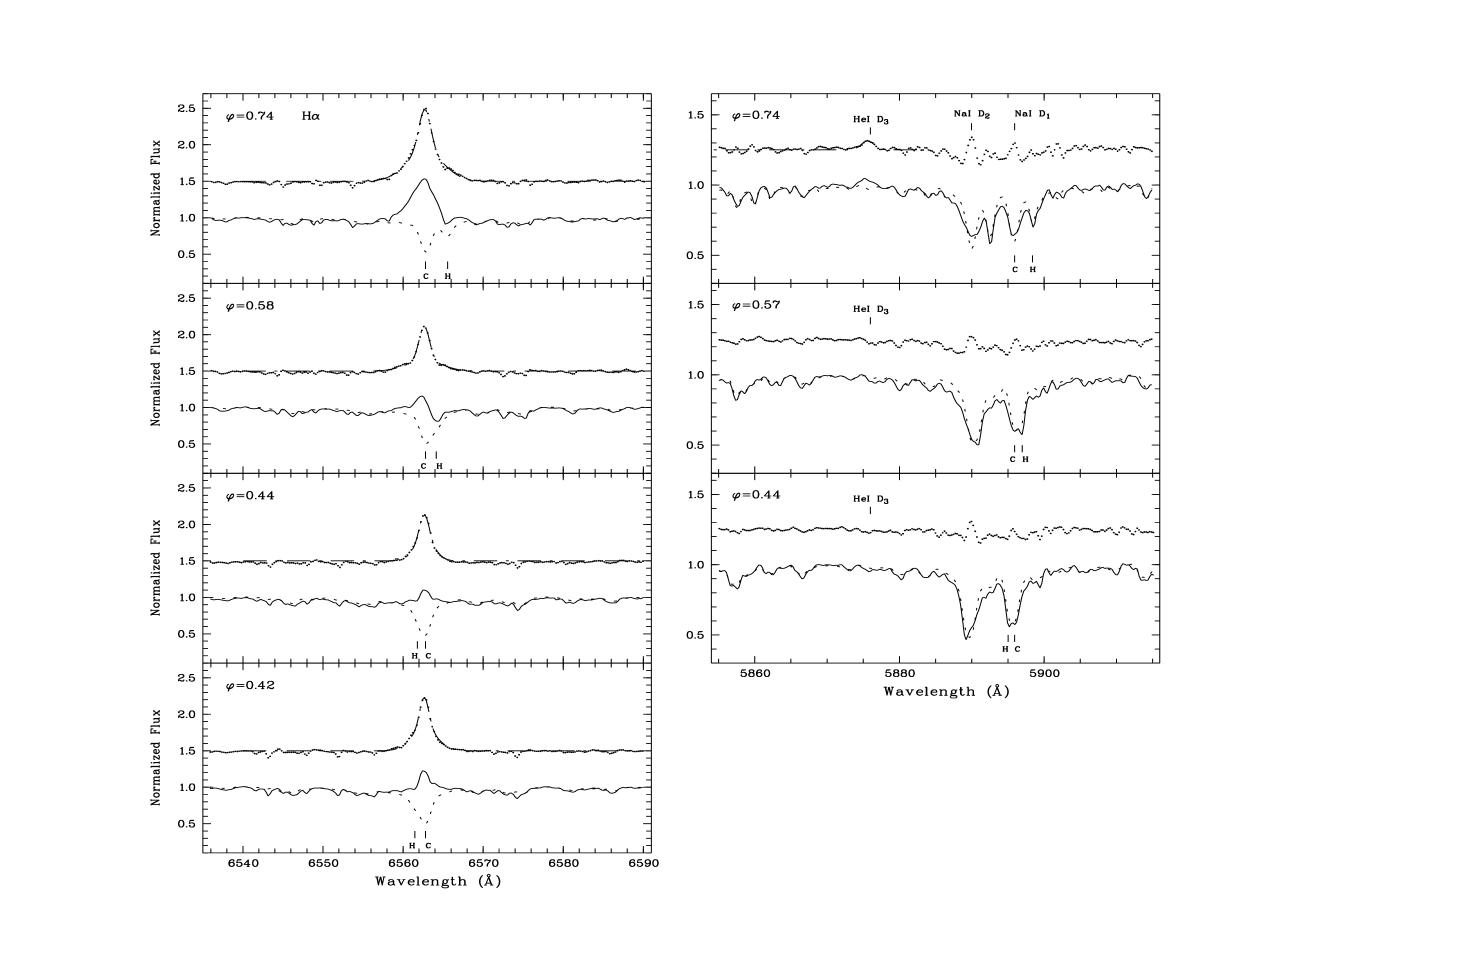
Our spectra in the H line region at orbital phases 0.42, 0.44 (September 13), 0.58 (September 14) and 0.74 (September 15) are displayed in Fig.1. Strong emission from the cool component is present in all the phases.
The observed spectra exhibit photospheric absorption lines from both components shifted in agreement with orbital phases, being more intense the corresponding to the cooler component, however the relative contribution of each component to the total spectrum is not according to that obtained with the spectral types and radii given in CABS (0.07/0.93). To obtain a satisfactory fit between the observed and synthesized spectra is necessary to take a relative contribution of 0.30/0.70 to the hot and cool components. This indicates that the radii given for these stars are wrong and/or that when a large fraction of the K0IV star’s surface is covered by spots, the contribution of the G5V star is larger (see Raveendran & Mohin 1995). In the latter case the relative contribution of the components may change with time, which is in accordance with the different contributions that we used in previous observations of this system (Montes et al. 1995b,c).
In Table1 we list the parameters measured in the subtracted H spectra: the peak emission intensity, I; the full width at half maximum, FWHM; the excess emission equivalent width, EW; the surface flux, , obtained with the calibration of Pasquini & Pallavicini (1991) as a function of (V-R) and the luminosity, L, obtained with the radius given in CABS.

At 0.74 orbital phase the emission intensity shows a remarkable enhancement with respect to the other phases. The excess H emission equivalent width increases in about a factor of 2 in an interval of 1 day. This fact suggests that we have detected a flare since enhancements of this amount during flares are typical of chromospheric emission lines (Simon et al. 1980, Catalano & Frasca 1994). The EW obtained in the three other spectra (that we have considered as quiescent level) are similar to that measured by us on 1992 December 16 (Montes et al. 1995b) and similar to the values given in the literature. The energy released in the flare, 1.7 1031 ergs-1 (EW in the flare spectrum converted into luminosity) is of the same order of magnitude than the maximum H luminosity observed in the H flares of other RS CVn systems, V711 Tau (Foing et al. 1993) and HK Lac (Catalano & Frasca 1994).
The subtracted spectra show than the emission corresponds only to the cooler component (K0IV) and the H profile presents broad wings, which are much more remarkable in the flare spectrum. A Gaussian fit to the subtracted spectrum is not well matched, therefore we fit the profile using two Gaussian components: a narrow one having a FWHM of 60-79 kms-1 and a broad component whose FWHM ranges from 133 to 247 kms-1. In Fig.2 we have represented the subtracted spectrum at phase 0.74 and the corresponding narrow and broad components used to perform the fit. In Table1 we give the parameters of the narrow and broad Gaussian components used in each spectrum. As we can see the large changes in the strength of the H emission, from the quiescent level to the flare level, occur primarily in the broad component, a similar behaviour has been observed in the case of DM UMa by Hatzes (1995). Since in a solar flare large scale mass motions occur, a large flare in UX Ari may explain the increase of the H emission and the broad wings observed in our spectrum.
In the Nai D1, D2, and Hei D3 lines region we have obtained three spectra at orbital phases 0.44 (September 13), 0.57 (Sept. 14) and 0.74 (Sept. 15), being quasi-simultaneous to the H observations. The Hei D3 line appears in emission only at 0.74 phase (see Fig.1) corresponding to the increase of the emission observed in the H line. This fact supports the detection of a flare-like event, since in the Sun the Hei D3 line appears as absorption in plage and weak flares and as emission in strong flares (Zirin 1988). The Hei D3 line has been also observed in emission at 0.22, 0.26, 0.77 orbital phases in the RS CVn system IIPeg by Huenemoerder & Ramsey (1987) and Huenemoerder et al. (1990). We have also seen in IIPeg the Hei D3 line in emission in one spectrum at 0.76 orbital phase taken on 1995 September 14 (paper in preparation).
We have applied to this spectral region the spectral subtraction technique in the same way as for the H line. The excess Hei D3 emission EW obtained in the flare spectrum (=0.74) is 0.140 Å. In the other two spectra only a very small absorption seems to be present. In the case of the Nai D1 and D2 lines we observe a filled-in absorption lines from the cool component in the three spectra, which is slightly larger in the flare spectrum (see Fig.1). These lines have been observed in emission or as a filled-in in red dwarf flare stars (Pettersen et al. 1984; Pettersen 1989). As Nai resonance lines are collisionally-controlled in the atmospheres of late-type stars, the filled-in observed may provide information about chromospheric emission.
4 Conclusions
We have shown here that the UX Ari binary system exhibits a strong increase in the H EW at 0.74 orbital phase. In the same phase the Hei D3 appears in emission, and the Nai D1 and D2 lines show a larger filled-in than in the other phases. This behaviour yields us to the conclusion that we have detected a flare which released about 1.71031ergs-1 in the H line.
According to the magnetic loop model for UX Ari described by Simon et al. (1980) in which the component stars have large corotating flux tubes which occasionally interact, the resulting magnetic reconnection leads to flares. When the emitting regions are seen in projection against the stellar disk the Hei D3 line appears in absorption, when the regions are observed off the stellar limb Hei D3 can be seen in emission. The orbital phase (0.74) of our UX Ari observation and its symmetrical position are the most favourable to observe the Hei D3 line in emission. The other Hei D3 observations in emission in IIPeg are also seen at these orbital phases.
This fact together with the strong increase in the H EW and the larger filled-in of the Nai D1 and D2 lines at 0.74 orbital phase support the presence of a flare in the UX Ari binary system.
Photometric observations of this system indicate that the light curve minimum (due to cool spots) normally occurred between phase 0.6-0.9 (Raveendran & Mohin 1995 and references therein), on the other hand Rodonò & Cutispoto (1992) observed an anticorrelation between the V light curve and the U-B and B-V colours variations that is not consistent with the expected variations produced by the presence of cool spots alone, and might be due to continuous flaring activity or bright plage-like regions associated with the spots. Our flare observation occurs at phase 0.74, so the flare eruption could be produced (as have been observed in the largest solar flares) by the interaction of new emerging magnetic flux with old magnetic structures associated to the spot groups present in the star at this phase.
- Acknowledgements.
This work has been supported by the Universidad Complutense de Madrid and the Spanish Dirección General de Investigación Científica y Técnica (DGICYT) under grant PB94-0263.
References
- 1 Bopp B.M., Talcott J.C., 1978, AJ 83, 1517
- 2 Carlos R.C., Popper D.M., 1971, PASP 83, 504
- 3 Catalano S., Frasca A., 1994, 287, 575
- 4 Foing B.H., Char S., Ayres T. et al., 1994, A&A 292, 543
- 5 Frasca A., Catalano S., 1994, A&A 284, 883
- 6 Hatzes A.P., 1995, AJ 109, 350
- 7 Henry G.W., Newsom M.S. 1996, PASP 108, 242
- 8 Huenemoerder D.P., Ramsey L.W., 1987, ApJ 319, 392
- 9 Huenemoerder D.P., Buzasi D.L., Ramsey L.W., 1989, AJ 98, 2264
- 10 Huenemoerder D.P., Ramsey L.W., Buzasi D.L., 1990, Cool star stellar systems and the Sun, Sixth Cambridge Workshop., G. Wallerstein ed.), ASP Conference Series 9, p 236
- 11 Montes D., Fernández-Figueroa M.J., De Castro E., Cornide M., 1995a, A&A 294, 165
- 12 Montes D., Fernández-Figueroa M.J., De Castro E., Cornide M., 1995b, A&AS 109, 135
- 13 Montes D., De Castro E., Fernández-Figueroa M.J., Cornide M. 1995c, A&AS 114, 287
- 14 Nations H.L., Ramsey L.W., 1986, AJ 92, 1403
- 15 Pasquini L., Pallavicini R. 1991, A&A 251, 199
- 16 Pettersen B.R., Evans D.S., Coleman L.A., 1984, ApJ 282, 214
- 17 Pettersen B.R., 1989, A&A 209, 279
- 18 Raveendran A.V., Mohin S., 1995, A&A 301, 788
- 19 Rodonò M., Cutispoto G. 1992, A&AS 95, 55
- 20 Simon T., Linsky J.L., 1980, ApJ 241, 759
- 21 Simon T., Linsky J.L., Schiffer F.H., 1980 ApJ 239, 911
- 22 Strassmeier K.G., Hall D.S., Fekel F.C., Scheck M., 1993, A&AS 100, 173 (CABS)
- 23 Zirin H., 1988, in Astrophysics of the Sun, (Cambridge University Press)