Properties of Simulated Compact Groups of Galaxies
Abstract
We analyze compact groups of galaxies appearing in a galaxy formation simulation dominated by cold dark matter (=1, =0.1). The simulation uses an N-body code to model the behavior of the non-baryonic matter and smoothed particle hydrodynamics to model the baryons. One run includes gas dynamics alone, and the other incorporates star formation as well. Groups identified as physically compact at =0 form originally along filaments and become compact in the final 20% of the simulation; they contain x-ray–luminous diffuse gas well before becoming compact. The component masses, baryon fractions, and gas-to-galaxy mass fractions of the simulated groups are roughly similar to those of Hickson compact groups (HCGs), although they tend to be somewhat more gas-rich and have x-ray temperatures a factor of 3 lower than those seen in HCGs. These discrepancies may be alleviated by adding the effects of energy input into the diffuse group gas by star formation and supernovae.
1 Introduction
Most galaxies are neither completely isolated nor in rich clusters, but instead are found in galaxy groups that contain only a handful of members. Although galaxy groups are very common, they have not been extensively studied due to the difficulty of determining whether a galaxy density enhancement on the plane of the sky is a true group or simply a superposition of field galaxies. Thus, many investigations of groups have focused on “compact groups of galaxies”, particularly those catalogued by Hickson (1982). Hickson compact groups (HCGs) were selected to have high average surface brightness and to be relatively isolated, conditions that increase the probability that the groups are physically compact. Subsequent redshift measurements showed that 92 of the original 100 HCGs contain at least three galaxies with concordant redshifts, strengthening this argument (Hickson et al. (1992)).
HCGs have been observed throughout the electromagnetic spectrum for signs of galaxy-galaxy interaction and other indications of physical compactness (see Pildis, Bregman, & Evrard 1995, hereafter Paper I, for an overview). The results have been contradictory at best: strong hints of interaction (e.g., HI deficits in HCG spiral galaxies, a probable diffuse x-ray–emitting intragroup medium in a subset of groups) coexist with the lack of other interaction signs (e.g., no obviously merged HCG remnants, few to no HCG ellipticals with signs of recent mergers). Furthermore, the analysis of the x-ray observations of these groups is complicated by systematic differences between the reduction procedures of different groups. Depending on the choice of background level and plasma metallicity, as well as other free parameters, the same data can be interpreted to give gas and total masses that differ by up to an order of magnitude (e.g., Paper I, Saracco & Ciliegi (1995); Mulchaey et al. (1996)). While preceding papers in this series (Paper I and Pildis, Bregman, & Schombert 1995, hereafter Paper II) and other recent work have shown that some order can be found in this confusion—for example, that elliptical-rich HCGs tend to have intragroup media while spiral-rich groups don’t, and that HCG ellipticals are not as quiescent as they appear at first glance—in no sense is there a coherent picture of what Hickson compact groups are and how they evolve.
Observations alone can shed only a limited amount of light on the puzzle of Hickson compact groups. While optical and x-ray data can give information about the matter that radiates in those wavebands as well as some indirect indication about quantities such as the total gravitating mass, they cannot provide direct and unambiguous information about invisible baryonic components such as hot gas whose emission is absorbed by Galactic neutral hydrogen or diffuse cold gas, much less non-baryonic matter. Furthermore, while optical signs of interaction in HCGs—such as shells around galaxies and diffuse light in the group potential—imply certain limits on the interaction history of a group, they do not provide many details about that history.
Simulations of galaxy formation and structure evolution can help answer some of these questions. For example, recent simulations by Hernquist, Katz, & Weinberg (1995) have found that galaxies form in filaments, and thus many compact-appearing groups may be filaments of galaxies seen end on. In such cases, even though the galaxies have projected separations of tens of kiloparsecs, they are physically separated by 2–10 Mpc along the filament. While Hernquist et al. did not propose any immediate tests to determine how many Hickson groups are probable projections (redshift-independent distance indicators would test their hypothesis, but such indicators are not sufficiently accurate to use for this purpose), their study illustrates how simulations can explain earlier, seemingly contradictory observations and can help guide future observations in order to test a theory.
One suggestion as to how to discriminate between projected groups and physically compact ones has been made by Ostriker, Lubin, & Hernquist (1995). They claim that their parameter should be a constant for all physically compact groupings, from compact groups up to rich clusters (, where is the projected radius, the bolometric x-ray luminosity, the galaxy luminosity in the blue, and gives the temperature dependence for the x-ray luminosity of a thermal plasma). Using cluster data and the results that were given in Paper I, they conclude that HCGs are either elongated along the line of sight to the extent that they cannot be considered true groups or extremely gas-poor relative to rich clusters.
In order to interpret the observational results from Paper I and Paper II, we analyze some “Hickson-like” groups found in a simulation of galaxy formation in a universe dominated by cold dark (non-baryonic) matter. Such an analysis improves our qualitative understanding of group formation and provides some level of quantitative detail on basic quantities related to their evolution and present structure. Properties such as a group’s baryon fraction, gas-to-stellar mass ratio, and temperature of its x-ray–luminous gas can be compared to observed quantities in HCGs. In addition, the simulations provide the dynamical histories of the groups. If the simulated groups have roughly the same properties as do the HCGs in our sample, then examining the time evolution of the simulated groups will provide insight into how compact groups form and evolve.
2 Simulation Description
2.1 Galaxy Formation Simulation
We model the formation of structure in a flat () universe that is 10% baryons and 90% cold dark matter by mass. We assume a (current) Hubble constant of H0=50 km s-1 Mpc-1, zero cosmological constant, and a biased normalization of the power spectrum =, where is the rms level of fluctuations in spheres of radius Mpc. The volume simulated is a periodic cube, with sides of comoving length 16 Mpc. Although this model does not fit all observations of large-scale structure, it fares best on the scales of galaxies and small groups. The most serious concern is the low global baryon fraction of which may be inconsistent with the high baryon fraction observed in x-ray clusters (White et al. (1993)).
The method used to create the simulation is described in Evrard, Summers, & Davis (1994—hereafter ESD). Our simulation differs from ESD in two important respects: (i) the initial conditions were not constrained to produce a cluster of galaxies and (ii) the simulation was evolved to =0 instead of =1. Other methods and assumptions are identical to ESD. The dark matter dynamics are simulated using the N-body code of Efstathiou & Eastwood (1981), while the baryons are modeled using smoothed particle hydrodynamics (SPH), with thermal pressure, shock heating, and radiative cooling taken into account and primordial elemental abundances assumed. Each mass component is resolved by particles. A minimum temperature of K is imposed for the baryons. The simulation is evolved from to in 2000 equal time steps of years. Due to data storage capacity limitations, we are examining the output from only every fortieth time step, leading to a time resolution of years for this study. The baryon particles each have a mass of M☉, while the dark matter particles are nine times more massive.
The simulation was run twice with the same initial conditions. The first run (designated “GO” for “gas only”) had no star formation; all the baryon particles behaved as a gas. Galaxies, or more precisely, “galaxy-like objects,” are defined here as in ESD: cool (T K) clumps of baryons with mean densities greater than times the current background density of the universe ( cm-3).
The second run (designated “SF” for “star formation”) included star formation by flagging baryonic particles above a particle density cm-3 and below a temperature T K as star-forming. These particles were turned into collisionless “stars” in 1–20 time steps (6.5–130 years) after they were flagged as star-forming, with the length of the delay being determined by a random number generator. The results are not particularly sensitive to the choice of the threshold parameters, as long as one is targeting the highly dissipated baryonic component.
Neither of the runs includes metal enrichment or energy feedback into the intragroup medium by star formation and supernovae. These important effects will be added in future simulations. Each of the above simulations was run on an HP 735 workstation and required roughly one month of CPU time to execute.
2.2 Group Selection and Description
It would be difficult to find compact groups in this simulation using criteria similar to the ones employed by Hickson (1982), since this simulation is of a volume of Mpc3 and the observed space density of HCGs is Mpc-3 (Mendes de Oliveira & Hickson (1991)). This implies that one would have to run 50 simulations or have 50 distinct viewing angles for projected groups (since here) to create even one HCG. Thus, the groups we have chosen should be considered to be simply illustrative of how some types of compact-appearing groups evolve in a CDM universe, rather than a definitive study of all possible HCG-like objects. The similarities we have found between these groups and actual HCGs, however, make a strong case for the relevance of our choices.
Initially, three probable compact groups were chosen from the =0 GO data set as similar to Hickson compact groups in appearance. Group members were first found using a friends-of-friends algorithm with a linking parameter equal to 0.15 times the mean interparticle separation. The center of the group was defined to be the position of the most bound dark matter particle, and all particles within a sphere of overdensity 100 were designated as part of the group. The evolution of those particles was then traced back to the initial redshift. Further examination showed that the smallest of the three groups was too poor to be classified as a Hickson-type compact group, and thus our final sample is comprised of two groups. We will use the nomenclature from the GO simulation as a whole and call them g2 (the larger group) and g4. These groups were recovered (with slightly different masses and locations) in the SF run, so a comparison can be made between the evolution and properties of groups with and without star formation.
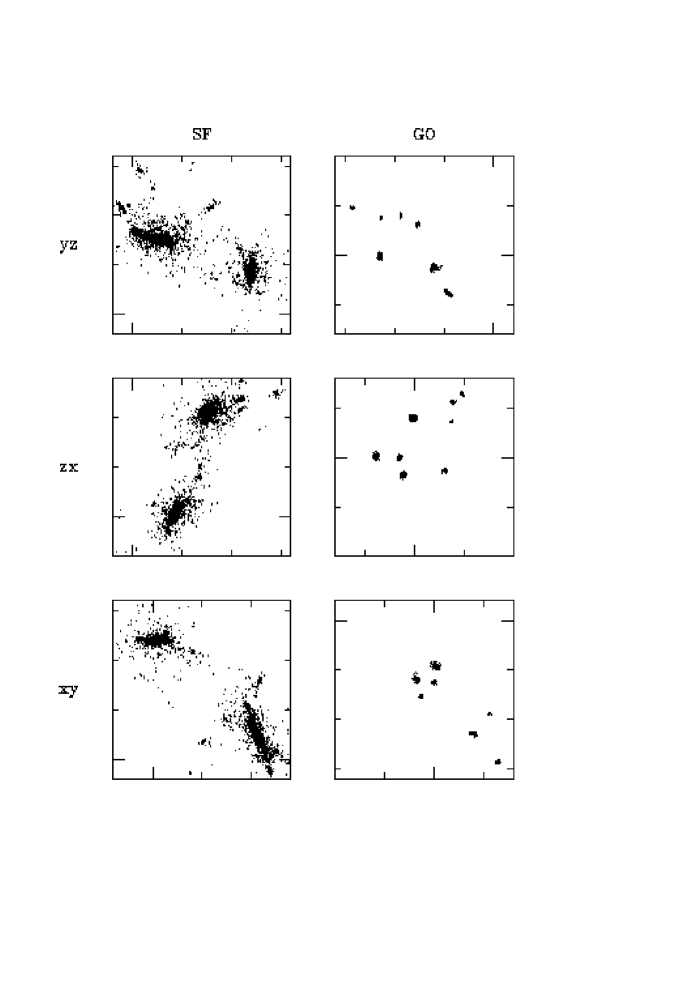
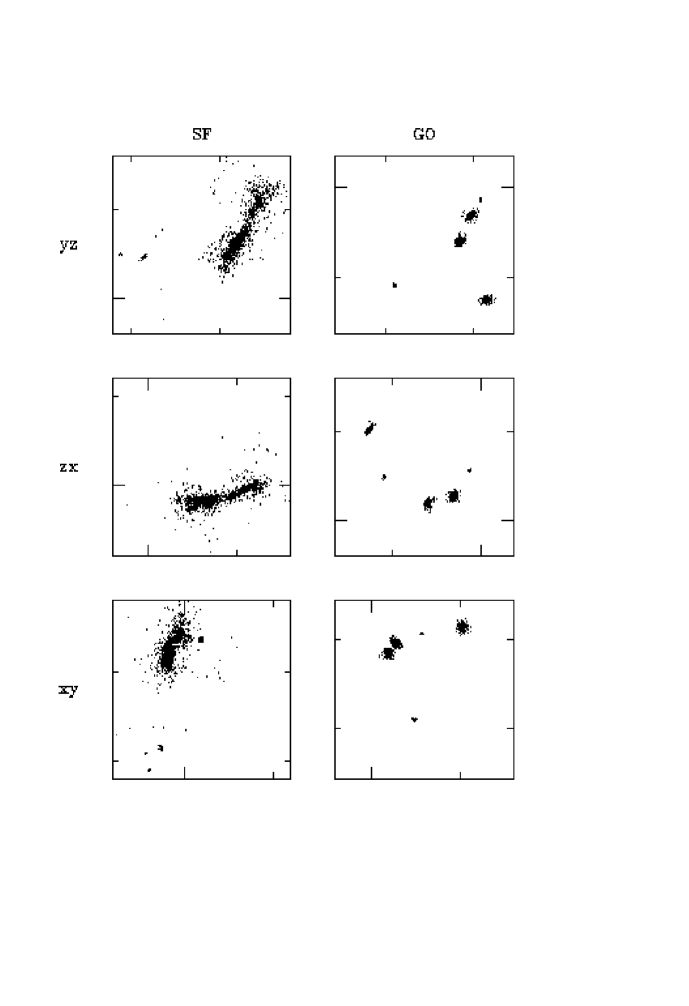
Using a three-dimensional visualization program (the Application Visualization System) to examine the evolution of these groups, we find that both g2 and g4 formed in the same type of environment (see Fig. 1–2). As in the Hernquist et al. (1995) simulation, we find that most of the “galaxy-like objects” in each group are found initially in a single filament. As time passes, however, these objects are seen to stream towards a T-intersection with another, poorer filament (where the larger filament is the crossbar of the T—this is best seen in the xy projection of Fig. 1 and the zx projection of Fig. 2). At the junction of the two filaments, a physically compact group forms in the last 2–3 Gyr of the simulation.
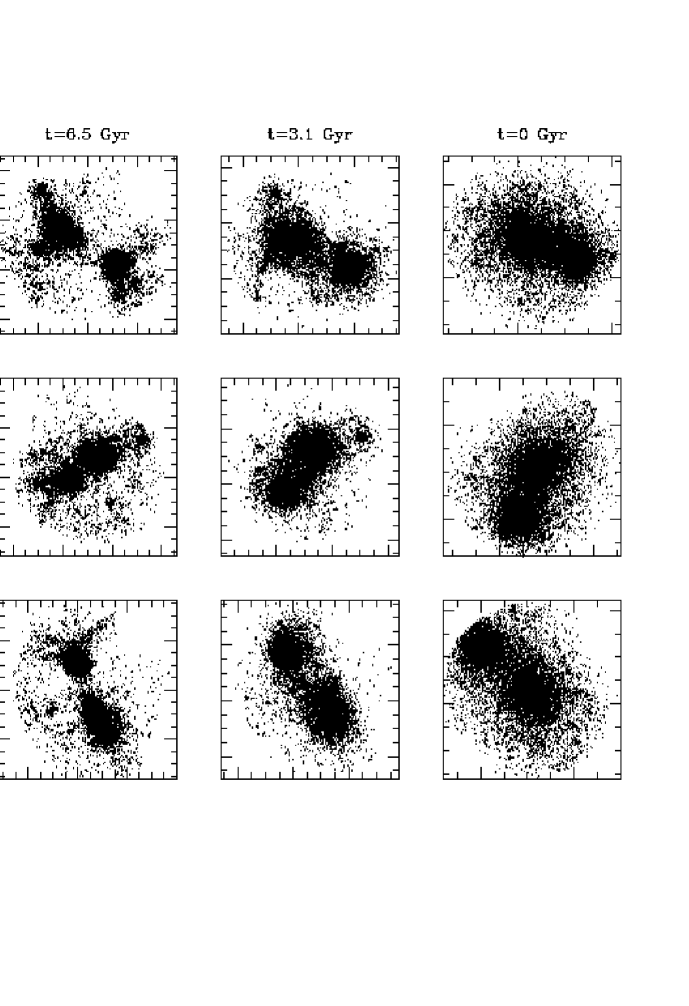
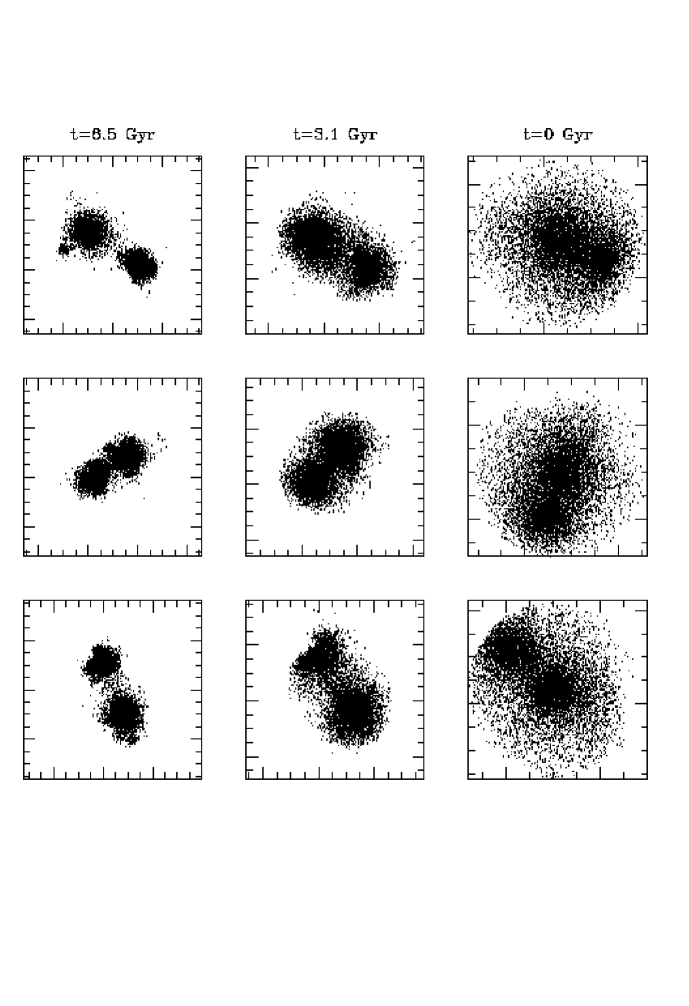
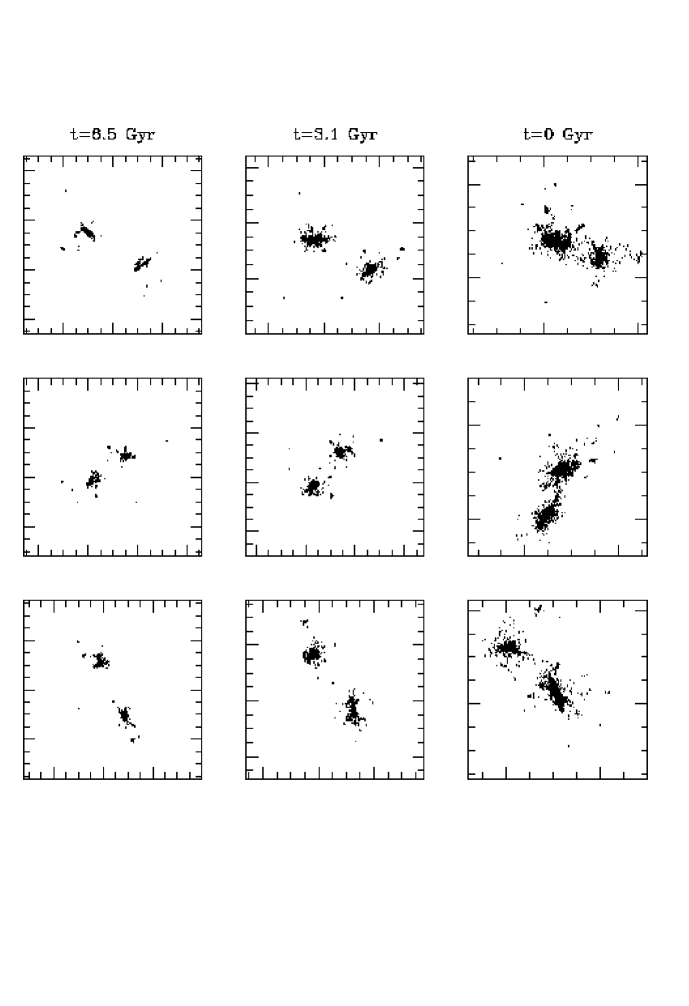
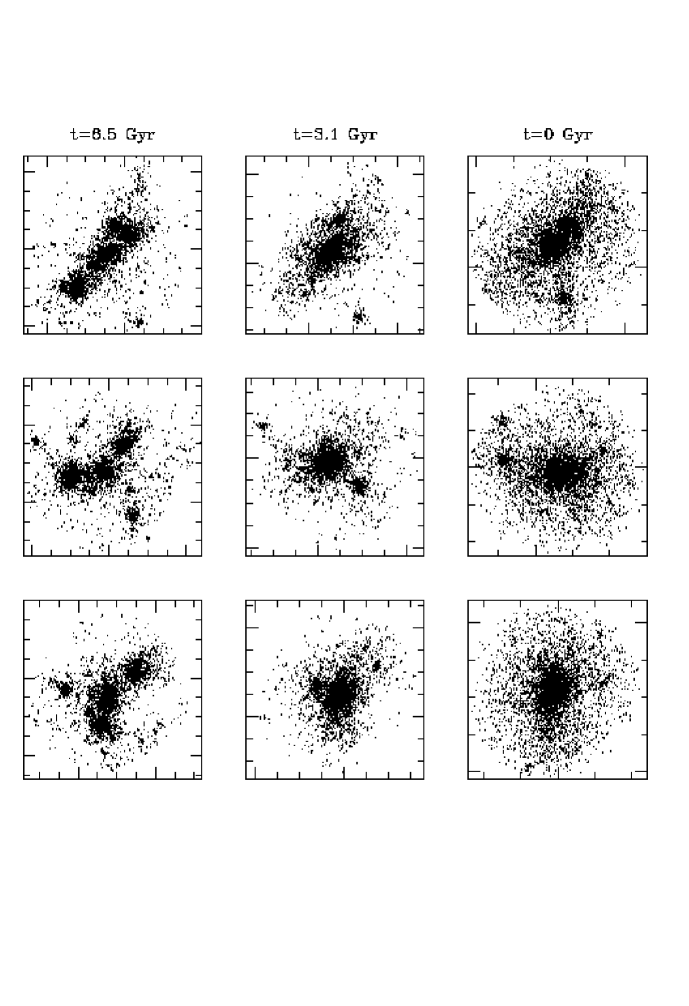
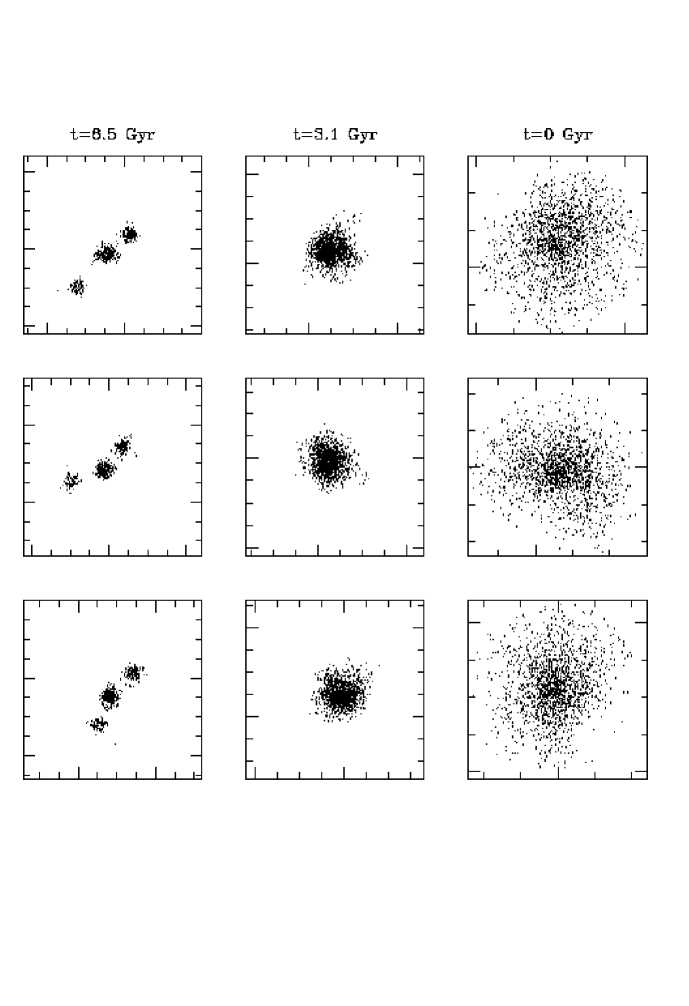
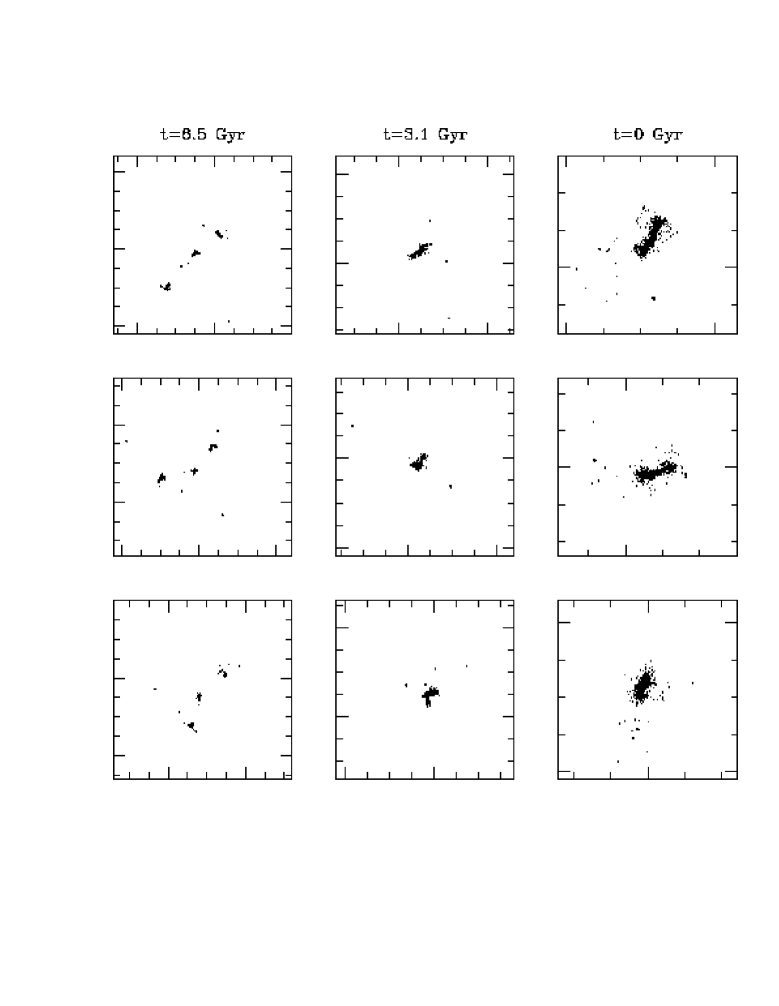
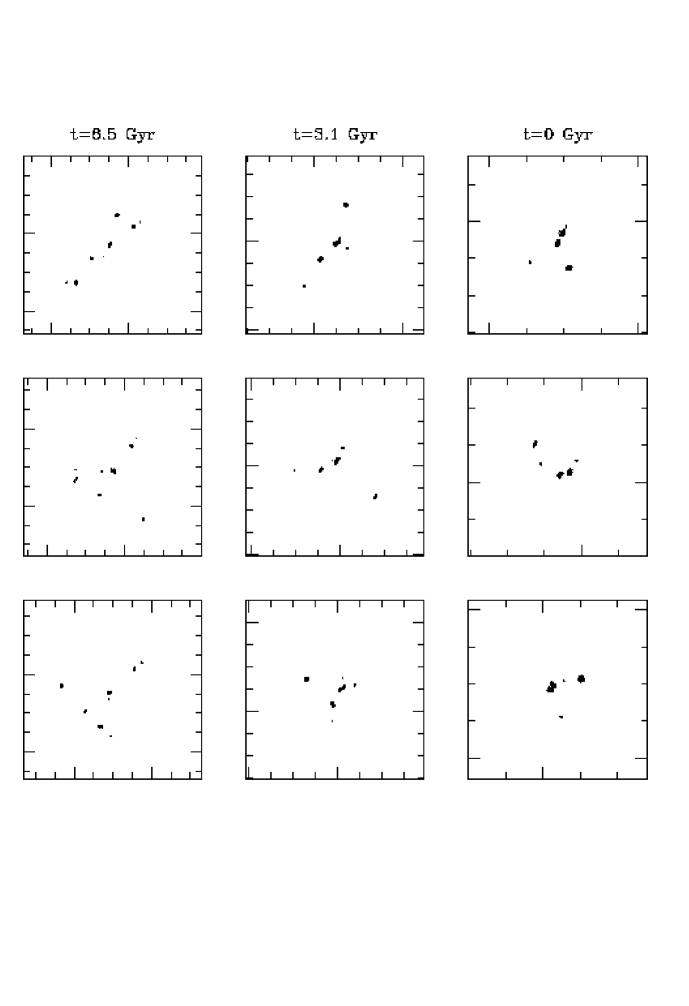
From Figs. 1c and 2c, it appears that “galaxy” mergers occur more readily in the simulation with star formation than without (compare to Figs. 1d and 2d). However, Fig. 3, which gives a magnified view of the group centers, shows that several distinct galaxies lurk under the tidal debris. Comparable numbers of distinct galaxy-like objects are found in the GO and SF runs. In the latter, the collisionless nature of the “stellar particles” leaves them susceptible to being stripped by gravitational tides. This effect is enhanced by the limited spatial resolution of the simulation; real galaxies are more compact and would suffer less tidal mass loss than the simulated galaxies in the SF run.
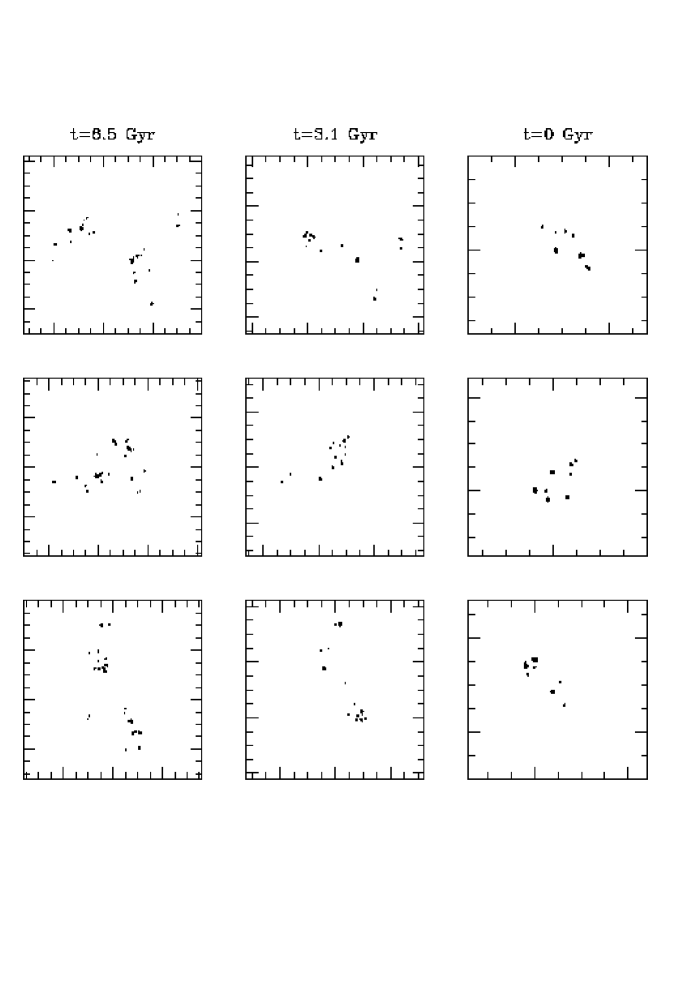
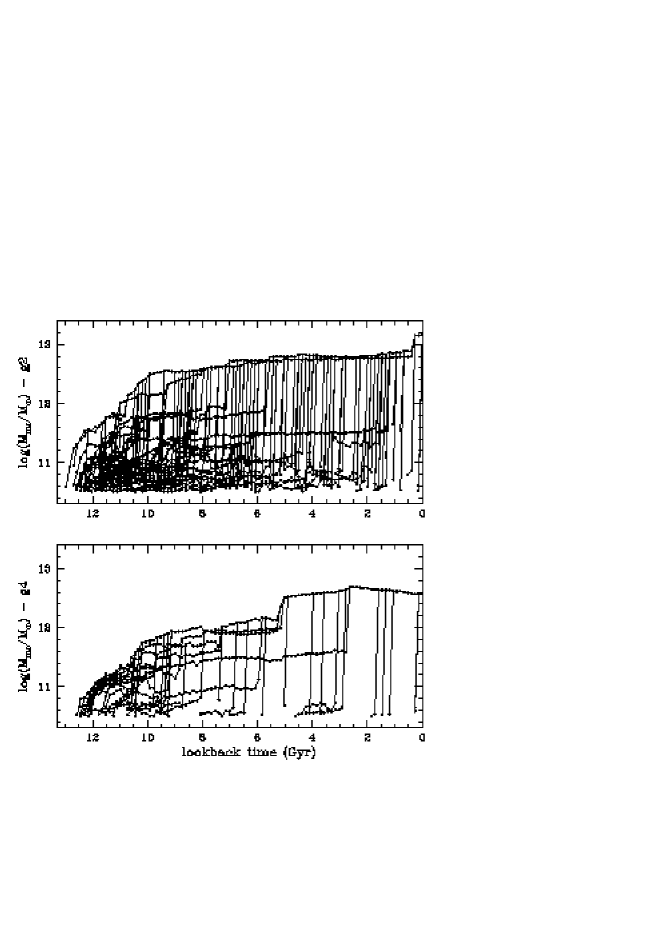
The merger history of the dark matter groups in the SF run as a function of lookback time is shown in Fig. 4. As is seen in Fig. 1, group g2 consists of two large subgroups of equal mass that only begin merging in the final Gyr of the simulation. Group g4 has a significant merger at a lookback time of roughly 5 Gyr, involving three sub-groups differing in mass by less than a factor of 2. A smaller merger of a satellite only of the group mass occurs Gyr from the present. Most of the mass in galaxies is formed in small halos which collapse within the first 2 Gyr of the simulation (at redshifts 2–3). In these compact groups and in smaller subgroupings that form along the filaments, mergers of galaxy-like objects in the GO run occur roughly every years, similar to the timescales seen in other simulations of physically compact groups (Mamon (1987); Barnes (1989); Bode et al. (1993)).
In each group, a few galaxy-like objects continue streaming in along the two filaments to their intersection after a compact group is formed. If left alone for several billion years, the galaxies in each physically compact group would spiral into the center of the common group potential and merge to a single, final remnant. Group g4 is much closer to this stage than is g2; indeed, the two subgroups of g2 are classified as separate Hickson-like groups for several Gyr before their merger at the end of the simulation. Hickson-like groups identified at =0.2 (lookback time of 3.2 Gyr) or =0.5 (lookback time of 6.1 Gyr) are either the progenitors of g4 and g2 or merge into the poor cluster that also forms in the simulation—no isolated merger remnants of halo mass 1013 M☉ are found. The fact that we find no clear “fossil” group remnants may be due to our small simulated volume rather than the inherent rarity of such objects. Larger simulations will test this.
3 Quantitative Analysis and Comparison to Observations
3.1 Mass Fractions
Since the number of particles in each of the groups is fixed as the simulation is evolved, the total mass and the baryon fraction does not change in time. Table 1 lists the total mass and baryon fraction for each group in both runs, as well as the hot gas (T K) and galaxy masses and their ratio at =0. Also given is the “observed” baryon fraction where, as in x-ray–observed HCGs, the only baryons counted are those in galaxies and hot gas. Table 2 lists the same quantities at a radius of 0.2 Mpc, the typical extent of PSPC detections of x-ray emission in HCGs. For comparison, Table 3 lists the similar mass components measured for HCGs in Paper I.
| Group | Mtotal/M☉ | Mgas/M☉ | Mgal/M☉ | Mgas/Mgal | aaThe “observed” baryon fraction counts only galaxy-like objects and hot gas as baryons and the “total” baryon fraction counts all baryons. | aaThe “observed” baryon fraction counts only galaxy-like objects and hot gas as baryons and the “total” baryon fraction counts all baryons. |
|---|---|---|---|---|---|---|
| g2-GO | 38.7% | 7.7% | 7.9% | |||
| g4-GO | 32.6% | 9.0% | 9.4% | |||
| g2-SF | 119% | 8.9% | 9.2% | |||
| g4-SF | 52.9% | 7.9% | 9.1% |
| Group | Mtotal/M☉ | Mgas/M☉ | Mgal/M☉ | Mgas/Mgal | aaThe “observed” baryon fraction counts only galaxy-like objects and hot gas as baryons and the “total” baryon fraction counts all baryons. | aaThe “observed” baryon fraction counts only galaxy-like objects and hot gas as baryons and the “total” baryon fraction counts all baryons. |
|---|---|---|---|---|---|---|
| g2-GO | 21.7% | 8.1% | 8.2% | |||
| g4-GO | 15.5% | 13.7% | 13.8% | |||
| g2-SF | 31.2% | 9.2% | 9.4% | |||
| g4-SF | 17.8% | 10.5% | 10.9% |
| Group | Mgrav/M☉ | Mgas/M☉ | Mgal/M☉ | Mgas/Mgal | |
|---|---|---|---|---|---|
| HCG 12 | 12% | 15% | |||
| HCG 62 | 110% | 5.3% | |||
| HCG 68 | 2.5% | 19% | |||
| HCG 97 | 10% | 12% |
Note. — Adapted from Paper I: Mgrav is the total gravitating mass of a group as determined from X-ray observations and Mgal is the mass in stars as determined from the optical magnitude of a group.
While the total mass increases by factors of 2–4 as one goes from a radius of 0.2 Mpc to the outermost radius of the groups (typically 0.8–1.0 Mpc at an overdensity of 100), the baryon fraction changes very little, declining by under 30% for all groups. The gas-to-galaxy mass ratio, however, roughly doubles at the larger radius in the GO simulation and triples in the SF run. Such changes are expected both theoretically and observationally. Due to dissipation, galaxies cluster more strongly than does the dark matter. Conversely, the hot gas is less bound than either galaxies or dark matter due to mergers, which also explains why the baryon fractions of the groups as a whole are less than the baryon fraction of the simulation (10%). Mergers transfer energy from the dark matter to the gas, resulting in a flatter radial distribution for the gas than the dark matter (Pearce et al. (1994)). X-ray observations of groups and clusters support this hypothesis, finding that galaxies are the most centrally concentrated mass component and hot gas the least concentrated, with dark matter having an intermediate distribution (David et al. (1995)).
At a radius of 0.2 Mpc, the simulated groups have smaller total and galaxy masses than those measured for the HCGs listed in Table 3, but roughly comparable gas masses. The simulated groups also have slightly lower baryon fractions and greater gas-to-galaxy mass ratios than HCGs measured at the same radius. As one moves to larger radii in the simulated groups, the masses move closer to the observed values, but the mass ratios (gas-to-galaxy and baryon fraction) depart more and more from what is seen in HCGs.
We have divided the non-stellar baryons into four classes: cold and dense (i.e., galaxies or galaxy-like objects), cold and diffuse, hot and detectable by , and hot and not detectable by . Table 4 lists the characteristics of each. Both density and temperature are critical in determining whether a particular set of baryons could be detected by the type of x-ray and optical observations described in Papers I and II. Matter must be both cold and dense to form a galaxy, and a diffuse intragroup medium needs to be sufficiently hot to emit detectable x-rays.
| Type | Temperature (K) | Density (cm-3) |
|---|---|---|
| cold, dense | ||
| cold, diffuse | ||
| hot, non- | all | |
| hot, | all |
The evolution of the mass in each of these four components is similar in both groups and both runs (Fig. 5). The initial dominance of the cold, diffuse component is quickly surpassed by that of the cold, dense galaxy-like objects (which are mainly composed of stars in the SF run). The amount of -detectable gas grows steadily through time, while the amount of hot but non--detectable gas rises to a maximum at a lookback time of 6–8 Gyr, then decreases to a level comparable to that in cold, diffuse gas. The exception to this is group g4 in the SF run, which has a moderate jump in -luminous gas at a lookback time of roughly 4 Gyr and a similar drop in the amount of gas not detectable by . These changes are due to the major merger event in g4 which begins at a lookback time of 5 Gyr (see Fig. 4).

Except in g4-SF, all but 5% of the baryons are either in galaxies or hot (-detectable) gas by , with gas-to-galaxies ratios of 39% (g2) and 33% (g4) for the GO run, and 119% (g2) and 53% (g4) for the SF run. These are smaller ratios than those seen in rich groups and clusters (200–600% [Arnaud et al. (1992); David et al. (1990)]) or in the ESD simulation of a medium-sized cluster of galaxies (200%), but are larger than the values for HCGs listed in Table 3. Examining the simulated groups at radii comparable to those of the observed groups reduces but does not eliminate this discrepancy (see Table 2). Since the observed values from x-ray observations depend strongly on the assumed values for the metallicity of the intragroup medium and x-ray background level (Paper I, Mulchaey et al. (1996)) and since the gas-to-galaxy mass ratios in simulations are likely to be altered by the addition of supernova-powered energy feedback, this discrepancy is less important than the confirmation that small groups of galaxies continue the trend of decreasing gas fraction with decreasing mass scale that is seen both theoretically and observationally in clusters of galaxies.
The SF groups have noticibly more mass in hot gas and less in galaxy-like objects than do the GO groups (see also Tables 1 and 2). This difference arises from the lower ambient densities, and therefore longer cooling times, for gas attempting to cool and accrete onto galaxies in the SF run. It must be remembered that supernova feedback from star-forming galaxies, an effect not included in these runs, may significantly affect the dynamics of the hot gas component (White (1991); Metzler & Evrard (1996)).
3.2 X-Ray Properties
Since x-ray measurements of HCGs provide a great deal of information about their physical reality and component masses, a good test of these simulated groups is to explore the properties of the baryons that would emit radiation detectable by the PSPC. Figure 6 shows contour plots of the predicted x-ray flux from the simulated groups in the SF run in a style similar to observational x-ray contour plots. The groups are placed at an assumed redshift , typical of nearby HCGs. Plotted on top of the contours are the positions of the stellar or dark matter particles in the group. The emission from both groups is elongated, similar to that seen in the HCGs described in Paper I (e.g., HCG 12 and 97). The position angle changes from the center, where it is close to that of the galaxy-like objects, to the outer regions, where it follows the dark matter potential. The difference in orientation is an indication of recent dynamical evolution. The x-ray contours do not extend as far out as ones in actual HCGs—the lowest contour displayed is at a level equivalent to of the assumed background of PSPC counts s-1 arcmin-2, while the lowest contours shown in Paper I are at 10% of the background level. To some degree, this may reflect the lack of metal enrichment in the simulation.
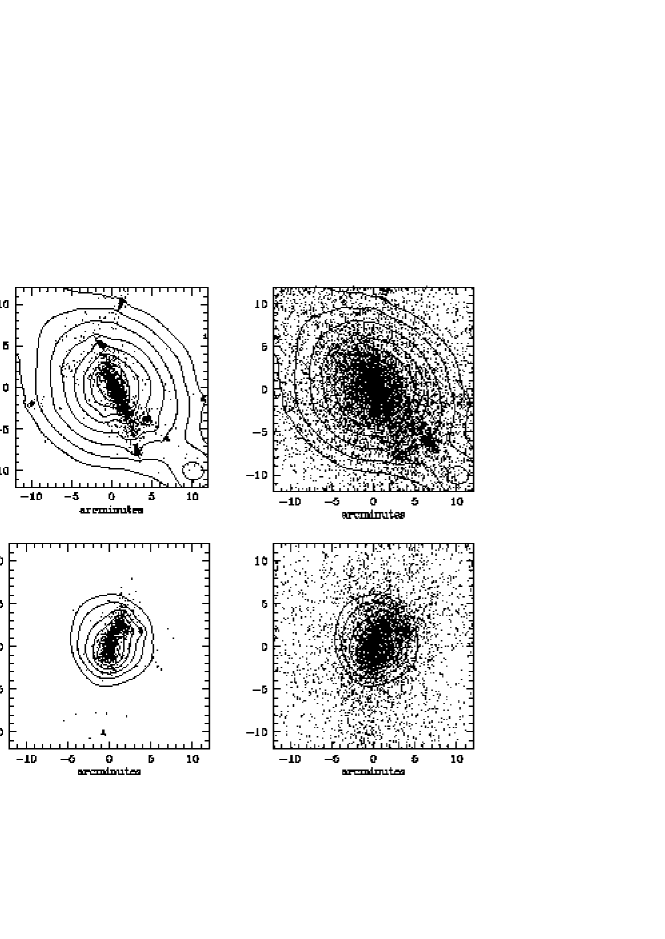
Figure 7 shows the time evolution of the mass in -detectable gas in the groups, as well as two different measures of the temperature of that gas. The gas temperature measured by an x-ray telescope is the “emission-weighted temperature,” where the weighting factor is the volume emission measure (VEM): dV, integrated over the gas, where is the particle density in the hot gas and dV is a volume element. The mass-weighted temperature cannot be determined in actual groups, but it is a more accurate measure of the average temperature of the hot gas.

As is seen in Fig. 5, Fig. 7 shows that the two groups exhibit similar behavior of their mass in x-ray gas: an initial quick rise lasting 2 Gyr, followed by a slow but steady rise until the present, with the SF run producing more hot gas than the GO run. In both runs, group g2 has hot gas 2 Gyr before g4 does and has a greater final gas mass, which is not surprising since g2 is a more massive group.
The two measures of the temperature appear to follow each other closely and to have similar histories in both groups; however, the emission-weighted temperature tends to be somewhat higher than the mass-weighted temperature, and also exhibits larger fluctuations. The run with star formation has gas temperatures that are systematically lower than the GO run, as well as smaller fluctuations. These differences are produced by the exchange of momentum and energy between the hot and cold phases of the gas in the GO run, an effect which does not exist in the SF run due to the dramatically reduced cold, dense gas fraction.
Overall, the groups in both simulations show relatively steady temperatures from the initial appearance of the hot gas until lookback times of 2–4 Gyr, where a sharp rise of 50% is seen, more clearly in the mass-weighted temperature than in the observable emission-weighted temperature. This rise is correlated with the formation of a physically compact group. Group g2-SF is the exception, with a constant to slowly increasing temperature through the last 10 Gyr in lookback time. This lack of a sharp increase in temperature is due to the merger of the two subgroups being delayed slightly in the SF run relative to the GO run. It is likely that such a sharp increase would have been seen if the SF simulation had continued beyond . A decline in temperature is seen in g4 at small lookback times, which may be due to the cooling of gas heated by the merger that occurs at 5 Gyr. The one exception to the overall similarities between the two temperature measures is the behavior of the emission-weighted temperature in g2-GO at lookback times of 5–8 Gyr. This temperature measure follows the rise of the mass-weighted temperature, but with a displacement: it is 1.5 to 2 times higher than the mass-weighted temperature. This implies that the density of some of the hot gas in g2 is unusually high at lookback times of 5–8 Gyr, probably due to the large amount of merging seen in g2 during that epoch. The emission-weighted temperature in g2-SF is also systematically higher than the mass-weighted temperature for most of the simulation, but by a smaller degree since most of the dense gas is turned into stars.
The emission-weighted temperature of the hot gas in these simulated groups is a factor of 2 to 5 lower than the 0.7–1.2 keV temperatures observed for the intragroup medium (IGM) in HCGs (Paper I). The main reason for this difference is likely to be the lack of feedback from the “galaxy-like objects” in the simulation. Star formation in galaxies—specifically, the resulting supernova blasts—leads to the expulsion of some of a galaxy’s interstellar medium into the surrounding group. This gas, which is both hot and enriched with metals from the supernovae (and earlier star formation activity), will heat the IGM and increase its metallicity.
A measure of the importance of star formation and supernovae to the state of the IGM can be found by examining the value of in spatial models of x-ray emission in HCGs, where the surface brightness is described by a hydrostatic-isothermal model of the form
where and are the fitted parameters (Cavaliere & Fusco-Femiano (1976)). Nominally, is the ratio of the “galaxy temperature” (i.e., a temperature derived from the velocity dispersion of the group) to the gas temperature, and the observed values of for HCGs are 0.3–0.6 (Paper I). These values of imply that the measured gas temperatures in HCGs are 1.5–3 times higher than one would expect without some sort of feedback, consonant with the temperature discrepancy between the simulated groups and actual compact groups. This conclusion assumes an isothermal intragroup medium, but observations show that HCGs do not have large temperature gradients (Paper I). In the simulated groups, the values of obtained from the density profiles of the hot gas are 0.8–1.0 for the GO run and 0.5–0.7 for the SF run. Thus, adding star formation does bring the spatial distribution of the hot gas closer to that seen in HCGs, but additional physics (such as feedback) is probably needed to correctly simulate the temperature of the intragroup medium.
The volume emission measure is not only the weighting factor for the measured temperature of a hot plasma, but it is an observable quantity as well, since it is the normalization factor for a thermal x-ray spectrum (when divided by D2, where D is the distance to the object being observed). In a beta model, the VEM is used to determine the central electron density , which is directly proportional to the total mass in x-ray gas.
The VEMs for the Hickson groups analyzed in Paper I are listed in Table 5, along with the range in VEM for g2 and g4 in both runs for the final 0.5 Gyr in lookback time. For the simulated groups, the VEM is calculated at a density contrast of 2000, roughly that at which the HCGs were observed. The group g4-SF has a disproportionately large range due to a small merger event near the end of the simulation (see Fig. 4). In general, the VEMs of the simulated groups are comparable to those of the HCGs. The SF run produced significantly lower VEMs than did the GO run due to the transfer of dense gas into stellar particles. Even with this systematic difference, the range of observed VEMs in HCGs is so large that one cannot determine whether the addition of star formation helps to better simulate actual groups. Also, since the volume emission measure is quite sensitive to high density hot gas, the assumption of primordial metallicity in the simulations may lead to an overestimate of the amount of such gas in HCGs. Line radiation from ionized C and Fe cools high-density hot gas very efficiently, so even a small increase in the metallicity of the intragroup medium would greatly reduce its VEM.
| Group | log (VEM/ cm-3) | Group | log (VEM/ cm-3) |
|---|---|---|---|
| HCG 12 | g2-GO | ||
| HCG 62 | g4-GO | ||
| HCG 68 | g2-SF | ||
| HCG 97 | g4-SF |
As was stated in the Introduction, Ostriker et al. (1995—hereafter OLH) suggest that the parameter is a constant for physically compact galaxy groupings, and thus the low values they calculate for HCGs (two to four orders of magnitude below the cluster values of ) imply that these groups are not physically compact, unless groups are gas-poor relative to clusters. If a group is elongated (i.e., has a large axial ratio), then the assumption of spherical symmetry used in the standard calculation of the gas mass will lead to an underestimate of the true gas mass of the group. The parameter is an effective way of determining whether such an underestimate is occurring. However, as OLH point out, depends not only on a group’s axial ratio, but also on the square of the fraction of mass in hot gas. As was shown in David et al. (1995), Paper I, and Mulchaey et al. (1996), the fraction of the total gravitating mass in a system that is in hot gas increases by at least an order of magnitude as one moves from early-type galaxies to rich clusters, with HCGs being closest to early-type galaxies. This effect is partially due to the x-ray emission being detected at greater radii (smaller density contrasts) in clusters than in poorer systems, and partially to a real deficit of gas in groups as compared to clusters, possibly a result of more efficient galaxy formation. Our simulations show that groups are poorer in gas than are clusters, even when the groups are gravitationally bound and physically compact. A decrease of an order of magnitude in the hot gas mass fraction thus leads to a hundred-fold decrease in (the difference between clusters and elliptical-rich HCGs) without requiring that the groups be less physically compact. Dell’Antonio, Geller, & Fabricant (1995) have also discussed this particular difficulty with applying to groups and poor clusters.
4 Concluding Discussion
The fundamental result of this study is that compact-appearing groups in a simulation of a cold-dark-matter–dominated universe are similar in many ways to actual compact groups. The simulated groups that we analyzed have lower gas-to-galaxy mass ratios than do simulated clusters, and their total and component masses are fairly similar to those measured for HCGs. In addition, the x-ray properties of the simulated groups are in many cases similar to those of x-ray–bright HCGs, even when the simulated groups are not physically compact. An important difference between these groups and HCGs is that the simulated groups are chosen by examining the dark matter distribution at a modest density contrast, then examining the galaxies within them. Much larger simulations will be required before realistic selection (including isolation criteria) from “optical” catalogues will be available.
While the gross similarities between the simulated groups and the x-ray–luminous HCGs discussed in Paper I are striking, there are also some important differences. While this simulation does produce gas-to-galaxy mass ratios nearly an order of magnitude smaller than those of clusters (both simulated and actual), the ratios are not as low as some observed in HCGs. Also, the emission-weighted temperatures for the hot baryons in the simulation are a factor of 2–5 less than the 0.9 keV temperatures measured in Hickson groups. Both these discrepancies may be due to the lack of galactic winds and metallicity enhancement in the simulation, as well as systematic effects that arise in x-ray data reduction such as the choice of gas metallicity and background level (Paper I, Mulchaey et al. (1996)). While incorporating star formation into the simulation did make some observable properties of the simulated groups (such as the spatial structure of the x-ray–luminous gas) more similar to those of HCGs, it increased the differences in other areas (e.g., the temperature of the intragroup medium). However, in most respects, HCGs fall somewhere in between the extremes of the GO and SF runs. The addition of the effects of of energy feedback into the intragroup medium is likely to reduce the remaining discrepancies considerably.
If g2 and g4 can be considered typical x-ray–bright compact groups, then perhaps the best description of how compact groups evolve is a combination of the bound group simulations of Barnes (1989) and the filamentary “false groups” of Hernquist et al. (1995). Until the final 2 Gyr of the simulation (when the groups become physically compact), the galaxy-like objects in each group are found mainly along a single filament. For a viewing angle down that filament, the “galaxies” would appear to be close together and to have concordant redshifts due to their infall to the intersection with a poorer filament, but actually be physically far apart along the filament. At a lookback time of roughly 2 Gyr, the galaxies become physically close, and the group becomes truly compact and somewhat richer as additional galaxies infall from the poorer filament. At this point, the evolution should proceed as in the simulations of Barnes (1989) and others (e.g., Governato et al. (1991); Bode et al. (1993)).
Our results provide no clear method to discriminate between projected and physical groups. The x-ray temperatures of the groups rise to a constant value very early in their evolution, due to shock heating of gas as it falls into galactic potential wells and filaments (Katz et al. (1992)). The behavior of the various baryonic mass components does not appear to be affected by the formation of a physically compact group, either. The rise in the x-ray temperature in the final few Gyr of the simulation is the principal indication of the formation of a physically compact group, but this simulation finds gas temperatures considerably lower than those of HCGs (likely due to the absence of heating from galactic winds), making it difficult to determine what magnitude of a temperature increase should be searched for. As discussed above, the parameter of OLH is not appropriate for gas-poor objects such as compact groups.
While it may be difficult to determine whether an individual group is physically compact, this simulation indicates that, on the whole, many HCGs are likely to be true groups rather than simply projections. Although the groups in this simulation spend more time as filaments than as physically compact groups, filaments would be identified as groups only from a small percentage of viewing angles (20%). Since the groups are compact for over 30% of their (x-ray–luminous) lifetimes, a significant proportion of x-ray–bright HCGs are probably physically compact groups.
A good criterion for distinguishing true groups from projected ones might be found from a greater ensemble of simulated groups. Not only would trends seen with the groups analyzed here become more clear, but examining the evolution of more groups chosen at 0 would illustrate the probable future state of HCGs. Perhaps the final merger products would have some distinctive property that would permit a search for such objects. The addition of supernova-driven galactic winds to the simulations would bring them closer to reflecting reality, and perhaps provide some indication of how one can distinguish projected groups from bound ones. Such simulations would also predict the metallicity of the hot gas in compact groups, a measurement of which will be able to be made with the next generation of x-ray telescopes.
References
- Arnaud et al. (1992) Arnaud, M., Rothenflug, R., Boulade, O. Vigroux, L., & Vangioni-Flam, E. 1992, A&A, 254, 49
- Barnes (1989) Barnes, J. E. 1989, Nature, 338, 123
- Bode et al. (1993) Bode, P. W., Cohn, H. N., & Lugger, P. M. 1993, ApJ, 416, 17
- Cavaliere & Fusco-Femiano (1976) Cavaliere, A. & Fusco-Femiano, R. 1976, A&A, 49, 137
- David et al. (1990) David, L. P., Arnaud, K. A., Forman, W., & Jones, C. 1990, ApJ, 356, 32
- David et al. (1995) David, L. P., Jones, C., & Forman, W. 1995, ApJ, 445, 578
- Dell’Antonio et al. (1995) Dell’Antonio, I.P., Geller, M.J., & Fabricant, D.G. 1995, AJ, 110, 502
- Efstathiou & Eastwood (1981) Efstathiou, G. & Eastwood, J. W. 1981, MNRAS, 194, 503
- Evrard et al. (1994) Evrard, A. E., Summers, F. J., & Davis, M. 1994, ApJ, 422, 11 (ESD)
- Governato et al. (1991) Governato, F., Bhatia, R., & Chincarini, G. 1991, ApJ, 371, L15
- Hernquist et al. (1995) Hernquist, L., Katz, N., & Weinberg, D. H. 1995, ApJ, 442, 57
- Hickson (1982) Hickson, P. 1982, ApJ, 255, 382
- Hickson et al. (1992) Hickson, P., Mendes de Oliveira, C., Huchra, J. P., & Palumbo, G. G. C. 1992, ApJ, 399, 353
- Katz et al. (1992) Katz, N. S., Hernquist, L., & Weinberg, D. H. 1992, ApJ, 399, L109
- Mamon (1987) Mamon, G. A. 1987, ApJ, 321, 622
- Mendes de Oliveira & Hickson (1991) Mendes de Oliveira, C. & Hickson, P. 1991, ApJ, 380, 30
- Metzler & Evrard (1996) Metzler, C. A. & Evrard, A. E. 1996, in preparation
- Mulchaey et al. (1996) Mulchaey, J.S., Davis, D.S., Mushotzky, R.F., & Burstein, D. 1996, ApJ, 456, 80
- Ostriker et al. (1995) Ostriker, J. P., Lubin, L. M., & Hernquist, L. 1995, ApJ, 444, L61 (OLH)
- Pearce et al. (1994) Pearce, F. R., Thomas, P. A., & Couchman, H. M. P. 1994, MNRAS, 268, 953
- (21) Pildis, R. A., Bregman, J. N., & Evrard, A. E. 1995, ApJ, 443, 514 (Paper I)
- (22) Pildis, R. A., Bregman, J. N., & Schombert, J. M. 1995, AJ, 110, 1498 (Paper II)
- Saracco & Ciliegi (1995) Saracco, P. & Ciliegi, P. 1995, A&A, 301, 348
- White (1991) White, R. E. 1991, ApJ, 367, 69
- White et al. (1993) White, S. D. M., Navarro, J. F., Evrard, A. E., & Frenk, C. S. 1993, Nature, 366, 429