SPECTROSCOPY OF LYMAN BREAK GALAXIES IN THE HUBBLE DEEP FIELD11affiliation: Based on obervations obtained at the W.M. Keck Observatory, which is operated jointly by the California Institute of Technology and the University of California, and with the NASA/ESA Hubble Space Telescope, which is operated by AURA, Inc., under contract with NASA
Abstract
We report on the initial results of a spectroscopic investigation of galaxies in the Hubble Deep Field which exhibit spectral discontinuities between the F450W and F300W passbands, indicative of the presence of the Lyman continuum break in the redshift range . We have employed color selection criteria similar to those we have used for selecting high redshift galaxy candidates from ground–based images. We find that, as for the ground–based color selection, the criteria are very successful in selecting high redshift objects. Of the 8 galaxies observed (selected from a list of 23 candidates with magnitudes equivalent to ), 5 have confirmed redshifts in the range , with the remaining 3 being indeterminate because of contamination from nearby brighter objects. As expected, the HST filter system is sensitive to a somewhat broader range of redshifts than our ground–based filter system, and therefore the surveyed volume per unit area on the sky is correspondingly larger. The distribution of candidates on the plane of the sky is clearly non–uniform, consistent with the available ground–based data on the high redshift galaxies. Most Lyman break objects in the Hubble Deep Field exhibit a similar range of morphological properties to the galaxies we have previously identified in other fields, characterized by very compact cores (some with multiple components) with half–light radii of arc seconds, often surrounded by more diffuse and asymmetric “halos”. A few of the brighter HDF Lyman break galaxies, however, have particularly unusual morphologies.
1 INTRODUCTION
The “Hubble Deep Field” (hereinafter “HDF”) (Williams et al. 1996) presents an opportunity to assess the colors and morphologies of galaxies down to unprecedentedly faint magnitude levels. Given that the field was observed across a wide color baseline, including the UV F300W filter, it is a natural place to extend our ongoing studies of the galaxy populations at (Steidel et al. 1995, 1996; Giavalisco et al. 1996; hereinafter Papers III, IV, V) that have been based on the Lyman continuum break entering the UV passband at substantial redshifts, giving the objects colors which distinguish them from the rest of the faint field galaxies . Our ground–based photometric system and selection criteria (see Steidel et al. 1993, 1995 for details) have been shown to be sensitive to galaxies in the redshift range , based on direct spectroscopic follow–up of the candidates using the W. M. Keck telescope (Paper IV). It is possible to use very similar selection criteria– essentially “flat” rest–UV spectra across the observed–frame optical passbands, with a dramatic “drop–out” in the ultraviolet passband– in the HST/HDF photometric system to pick out the candidate high redshift galaxies in the Hubble Deep Field. In this paper, we report the first spectroscopic observations of these “Lyman break” galaxies in the HDF. We have also performed a morphological analysis of these bright candidates following the lines of our previous work presented in Paper V.
2 SAMPLE SELECTION
Given the very small amount of time (a matter of only a few days) between the availablility of the Hubble Deep Field data and our observing run on the W. M. Keck telescope, galaxies were selected as Lyman break candidates in a manner that was not necessarily optimized for the HST filter system. We simply adopted criteria very similar to those used in our ground–based survey. All of the magnitudes on the HST system were converted to “AB” magnitudes (such that a galaxy with equal magnitudes in each passband has a spectrum that is “flat” , i.e. ). We then approximated our ground–based passband, which has an effective wavelength of 6930 Å for a flat–spectrum source, by averaging the F606W and F814W AB magnitudes. For the colors of the objects of interest, this is likely to be very close to a magnitude in both normalization and effective wavelength. (We will call this magnitude hereinafter). We then formed the colors and , and applied a “spectral curvature” criterion,
which is equivalent to requiring that the break across the two bluer passbands is more than 3 times the break across the two redder ones. In addition, we expect that the unabsorbed continua of high redshift galaxies will be very blue (even with the blanketing effect of the Lyman forest, up to redshifts of ), so that we require that . In practice, essentially all of the objects which satisfied the “spectral curvature” criterion also satisfied the “blueness” criterion. All of the colors were measured using the isophotal aperture defined in the Version 1 catalog produced by the HDF team; such apertures are conservatively large for objects as bright as those considered here, and are certainly not optimal for obtaining colors with the highest S/N.
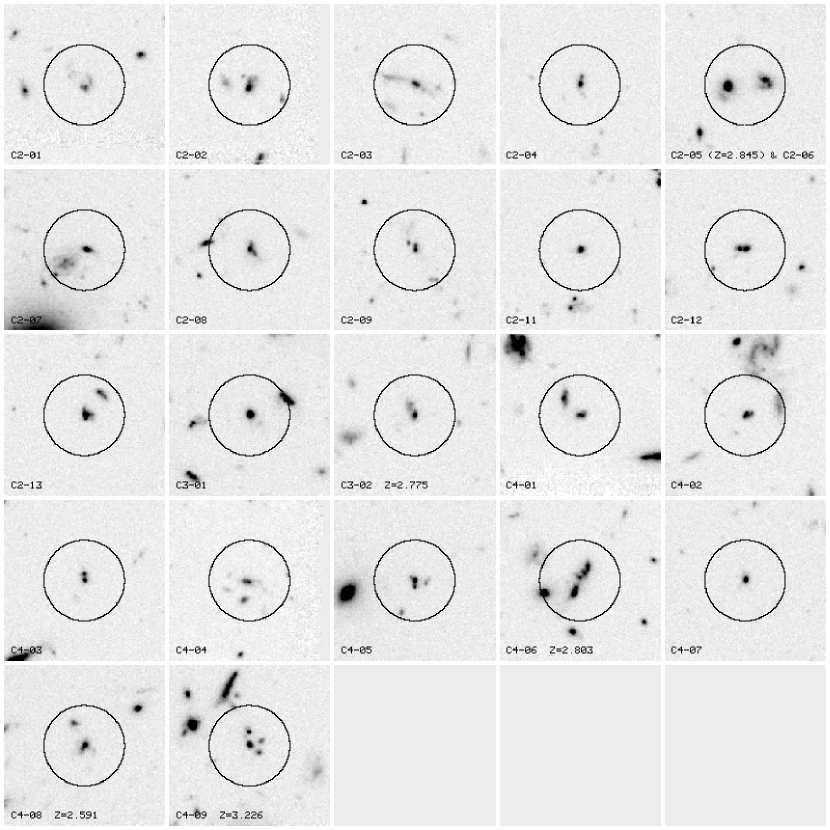
We then took the entire catalog of objects having (this has been shown to be the practical limit for follow–up spectroscopy with Keck, and also ensures that the limits in F300W for Lyman break objects will be extremely robust) and applied the color selection criteria. Figure 1 shows the two–color diagram for all of the HDF objects with , together with the region of this plane satisfying the above color criteria. The filtering resulted in a sample of 25 resolved objects culled from the three detectors of the WFPC2 camera, and one stellar object. Two of the resolved objects were rejected as spurious after close inspection of the HDF images. The colors of the stellar object may have been slightly affected by saturation; a long slit spectrum obtained on the same night as the slit mask observations described below show it to be a subdwarf star. All of the candidates for follow–up spectroscopy, with accompanying photometry and positions, are listed in Table 1111In the original generation of the list of candidates for spectroscopy, an error was made in the conversion of the F606W magnitude to the AB scale, so that the color was measured to be 0.2 magnitudes bluer, and the magnitude 0.2 magnitudes fainter, than the values that are now tabulated. In addition, when the catalog F300W magnitudes did not exceed 1 above sky in the isophotal aperture, we assigned lower limits on the F300W magnitude equivalent to above sky–in some cases this made the break less pronounced than in the original list. As a result, there are objects in Table 1 which no longer satisfy the adopted color criteria completely. We have retained all of the original candidates for spectroscopy in Table 1, however.. A mosaic of all 23 of the galaxies is shown in Figure 2.
We expected a priori that the color selection applied to the HST data set would be sensitive to somewhat lower redshifts than our ground–based criteria, since the Lyman limit of a galaxy is well within the F300W passband for any redshift . To better quantify the expected redshift range encompassed by our selection criteria, we convolved the throughput curves of the HST passbands with the same model galaxy template (Bruzual and Charlot 1993; see Paper III) we have used in our ground–based system, accounting for blanketing in the Lyman alpha forest following the prescriptions of Madau (1995) and by assuming that photons shortward of the Lyman limit in the galaxy rest frame are completely absorbed. This assumption is probably valid, since recent Hopkins Unltraviolet Telescope observations of nearby star forming galaxies have shown no detectable flux emerging shortward of the Lyman limit [Leitherer et al. 1995], and because of the known high opacity of intergalactic H I for redshifts (cf. Paper III, Madau 1995). The model galaxy colors, which should be considered rough estimates, satisfy our criteria for candidate selection in the redshift range , i.e. a much broader range of redshifts than in our ground–based high redshift galaxy selection (). This then explains (in part) the surprisingly large number of Lyman break candidates; whereas we would have expected Lyman break galaxies in the 4.7 square arc minute HDF field of view to based on our ground–based statistic of galaxies per arc square minute (see Paper IV) we see 10 such candidates in the HDF. After accounting for the probed volume, which is larger by a factor of than the equivalent volume probed by the selection criteria (because of the larger redshift range), and the fact that one probes a few tenths of a magnitude fainter in the star–forming galaxy luminosity function at the average redshift probed, these numbers are probably consistent with one another within the errors. A detailed analysis of the luminosity function of Lyman break galaxies in the HDF is postponed to a separate paper.
3 OBSERVATIONS
The spectroscopic observations were obtained on the night of 22 January 1996 (UT) on the W. M. Keck telescope with the Low Resolution Imaging Spectrograph (Oke et al. 1995). Two slit masks were constructed, each containing slits for 8 of the Lyman break candidates in the HDF, plus 15–20 additional slits for galaxies in the HDF “flanking fields”, which were much shorter (1–2 orbit) HST exposures. The candidate objects for spectroscopy were assigned slits based on a weighting scheme that was largely subjective, but was loosely based on apparent magnitude (brighter objects being given larger weight), and efficiency of how many slits could be placed on candidates within the HDF as a function of position angle, etc. The first mask, which is the one actually used for observations, was optimized to have a slit falling roughly along the major axis of one particularly interesting galaxy, C4-06, which also happens to be the brightest candidate in the HDF, and to allow another slit to be placed on C4-09, another interesting candidate with a peculiar morphology.
The weather was far from optimal on the night the observations were made, with variable cirrus and mediocre seeing ( arc seconds FWHM). We obtained a total of 7200s of integration through the first slit mask, in six separate exposures of 1200s each. (This integration represents % of the workable time we experienced in the entire two night observing run.) The telescope was moved small amounts () parallel to the slit direction between each exposure, so that the spectrum of each object fell at 3 independent spatial positions on the Tektronix 2048 2048 detector. We note that this integration time is only about half that obtained for the galaxy spectra which were presented in Paper IV. The spectra were obtained with a 300 line/mm grating blazed at 5000 Å in first order, resulting in a spectral resolution of Å through the 14 slits.
Two of the slits assigned to HDF Lyman break candidates (C4-02 and C2-01 in Table 1) were contaminated by light from nearby mask alignment star holes, so that no useful data were obtained for them. A third galaxy, C3-01, is contaminated by two nearby galaxies at smaller redshifts (see Figure 2) due to the poor seeing and the unfavorable alignment of the slit on the plane of the sky. We have obtained redshifts for the remaining 5 candidate galaxies, and indeed they all fall within the expected range of redshifts.
The spectra of the five confirmed high redshift galaxies in the HDF are presented in Figure 3.
4 THE SPECTRA
The spectra generally span the same general range of properties as those we have obtained previously in other fields at similar redshifts– generally (but not always) weak or absent Lyman emission, sometimes very strong interstellar absorption lines, and when the S/N permits, stellar absorption features of Si IV, C IV, and He II (cf. Paper IV). Again, the present spectra are generally of inferior quality (as compared to those described in Paper IV) due to the adverse weather conditions experienced during the 1996 January Keck observing run.
We draw attention in particular to the spectrum of HDF C4-06, which is a high surface–brightness, but highly elongated galaxy. The interstellar absorption features in this galaxy, at , are stronger than for any other high redshift galaxy we have obtained thus far; they are comparable in strength to the lines in the spectrum of the extremely bright “protogalaxy” candidate found serendipitously by Yee et al. (1996). It is clearly an usual object morphologically (see §5), as most of the color–selected galaxies are quite compact and relatively “round” (Paper V). C4-06 has an aspect ratio of about 5:1, and given the elongated morphology, the strength of the interstellar lines lends credence to a dynamical interpretation of the line widths, as we have suggested in Paper IV. The strongest interstellar lines have equivalent widths of Å in the rest frame, implying a velocity field of more than 1000 km s-1FWHM. Unfortunately, although the object was observed with the slit oriented along the major axis of the galaxy, the seeing was too poor to determine whether this velocity field has a substantial shear or rotation component.
HDF C4-09, at , is another object with a somewhat unusual morphology. It is evidently comprised of 4 distinct, compact components of similar luminosity and separated by only on the plane of the sky. Aside from the number of individual compact components comprising this object, it is not unlike several of the galaxies presented in Paper V which exhibit these “multiple compact” morphologies. (see also §V). We note the apparently very strong Si IV feature in the spectrum in Figure 3, as well as the moderately strong ( Å) Lyman emission line. There is some evidence for a velocity difference in the Lyman line in the two-dimensional spectrum of this object, suggesting that it is probably not the gravitationally lensed images of a single object. There is also no obvious sign of a lensing object to very faint apparent magnitude levels.
HDF C4-08, at , has the strongest Lyman emission (of any non–AGN) of the high objects we have observed spectroscopically to date, with a rest–frame Lyman equivalent width of Å. Morphologically, it is very similar to objects which exhibit weak or absent Lyman (see §V and Figure 2).
HDF C2-05, at , has very weak Lyman emission superposed on a strong absorption that is more evident in the two–dimensional sky–subtracted spectrum than in the 1–d spectrum shown in Figure 3. The redshift is supported by several of the low–ionization interstellar lines that are found to be a common feature of the high redshift galaxy spectra in the far–UV.
HDF C3-02, at , is the least secure of the 5 redshifts presented, and is also the faintest galaxy in terms of apparent magnitude. We base the redshifts mainly on features shortward of 5000 Å, where there are few strong features in the sky, and where apparent absorption features are most likely to be real. However, there are relatively strong apparent absorption features which agree with some of the expected stellar lines (e.g., C IV, Si IV, He II) at longer wavelengths. We plan to obtain additional data on this galaxy in the future to make the redshift assignment more secure.
5 THE MORPHOLOGY OF THE GALAXIES
We have performed an analysis of the light profiles for the HDF Lyman break galaxies as we have done previously for our selected galaxies observed with HST (Paper V). Figure 4 shows radial profile plots of each of the galaxies. Table 2 contains a summary of the measured parameters of the light profiles for each object.
Broadly speaking, and not surprisingly, the HDF Lyman break galaxies are overall very similar in their morphological properties to our previous sample; they are generally characterized by compact morphologies which we have described as consisting of a high surface–brightness “core”, surrounded by much lower surface brightness nebulosities or “halos”. The cores, which often have a central surface brightness of mag arcsec2, are typically resolved and have sizes of – arcsec, corresponding to – (6.1–12.2) kpc with (0.05), with half-light radii of – arcsec, or – (2.4–3.7) kpc. The “halos” are larger in size and are generally irregularly distributed around the cores. The “cores”, which have the roughly the same sizes as the present-day bulges of spiral galaxies and cores of ellipticals, contain a very large fraction of the UV light (and therefore of the star formation) of the galaxies. As we have argued in Paper V, the compact morphologies do not simply result from the well–know surface brightness selection effects inherent in the HST images, since our sample of galaxies selected using ground–based data is overall very similar morphologically.
It is interesting to note that the observed central surface brightnesses are very high; the typical 22-23 mag. arcsec-2 corresponds to a rest–frame surface brightness in the band of 17.7-18.7 mag. arcsec-2 if it is assumed that the spectrum remains essentially flat to rest–frame (this assumption is supported by infrared photometry of a subsample of the galaxies presented in Paper IV) and that the typical redshift is . These numbers are at least ten times higher than the central surface brightness of a typical spiral disk at the present epoch (Freeman 1970).
As in Paper V for the ground–based selected galaxies, we have quantitatively examined the morphology of the HDF galaxies in two ways. To analyze their average radial light profile we fit elliptical isophotes to the HST images. One should fit the center, ellipticity and position angle of each individual isophote. However, the presence of the substructures and the relatively small number of pixels that comprise the image make this method inaccurate, mostly due to the fluctuations in the centers of each isophote. We adopted a procedure wherein we used the center derived from the inner isophote (typically ), and keeping this center fixed, we fit ellipticities and position angles for each isophote. This technique differs slightly from that adopted in Paper V, where we kept ellipticity and position angle fixed to an average value, because the HDF images are considerably deeper and have better angular resolution (thanks to the sub-pixel dithering and processing) than our previous HST images. In practice, we fit each azimuthally–averaged radial profile with both an and an exponential law to determine which of the two best describes each galaxy. Again, the fits are intended to broadly classify the light profiles and are not intended to imply that a particular galaxy rigourously follows a given model. In several cases it is clear that neither analytic profile provides a very good fit, and in such cases the tabulated parameters are clearly without significance. The half–light radii, as in Paper V, were determined from growth curves and not from the parameters of the fitted profiles.
Notes on individual objects:
C2-03: Although this galaxy appears to be elongated, it is only the small knot at the center of the circle in Figure 2 that has the colors expected for a galaxy at . This object would almost certainly have been missed in a ground–based search because of the confusion with the foreground object.
C2-05 and C2-06: Although we have a spectrum of only one of this fairly close pair (the separation is only about 25), they have very similar broadband colors (see Table 1), making it likely that they are at similar redshifts.
C2-07: Here again, it is only the single compact object at the center of the circle in Figure 2 which has the appropriate color signature to be a Lyman break object. This is another case that might have been missed at ground–based resolution.
C4-02, C4-03: A second, fainter compact region is observed in these galaxies.
C4-04: Again, only the object at the center of the circle in Figure 2 has the expected colors of a galaxy with .
C4-05: Another example of a “double core” object.
C4-06: As noted above in §4, this is the brightest among the Lyman break candidates in the HDF, and also the most morphologically peculiar. It is the only high redshift object found using Lyman break color selection that we have seen, in either the HDF or in the fields we studied previously in Paper V, which exhibits a significantly elongated morphology. As can be seen from Table 2, the two “blobs” comprising this object are of very similar apparent magnitude and central surface brightness. It is not beyond the realm of possibility that this object is gravitationally lensed (it is very close to what appears to be a relatively high redshift early–type galaxy).
C4-08: Although this object has much stronger Lyman emission than any of the Lyman break galaxies we have studied spectroscopically to date, it is not appreciably different from typical in terms of its light profile.
C4-09: This object bears some resemblance to an “Einstein cross” gravitational lens configuration. However we consider it more likely that it is just an example of a “multiple compact core” morphology such as we have seen in several instances both in the HDF and in the fields presented in Paper V. There is no evidence for a foreground galaxy centered on the 4 compact components. As discussed in §4, there is also some evidence that the components have slightly different redshifts. These are probably 4 sub–units in the process of merging, or 4 bright star-forming regions within a single, underlying galaxy.
6 DISCUSSION
We have obtained confirming spectra of 5 out of 23 galaxies from the 3 Wide Field Camera chips of the Hubble Deep Field, selected to have and to satisfy color criteria essentially identical to those we have used successfully in our ground–based survey for very high redshift galaxies. The HST data are, as expected, sensitive to a larger range of redshifts than the ground–based photometric system; the 5 redshifts all fall within the expected range based on the simple model used (see Madau et al. 1996 for a color prescription optimized for the HST filter system). Thus, the Lyman break technique for isolating high redshift galaxies is again shown to be extremely efficient.
It is perhaps significant that in the sample of 5 redshifts available thus far, 3 are within km s-1of one another, near redshift . We also point out the distribution of the candidates among the three WFC chips, with 12 on WF2, 9 on WF4, and only 2 on WF3. These two findings indicate the possible presence of large–scale clustering in the distribution of actively star–forming galaxies at high redshifts. Such inhomogeneities and signals of very large scale clustering are also present in our larger–field ground–based data as well, as we will discuss in future work.
We reiterate a conclusion which was reached in Paper V– that the high redshift galaxies are in general very compact, with scales comparable to the cores of present–day luminous galaxies. The bulk of the star formation at high is occuring in very compact regions, of very high surface brightness, and which generally exhibit a relatively high degree of azimuthal symmetry.
We view the spectra presented in this paper as further evidence of the effectiveness of using the Lyman continuum break criterion for isolating well-defined populations (essentially volume limited) of high redshift galaxies. There is a great deal of science that may be done, from studies of the luminosity function of galaxies at extreme redshifts, to studies of large–scale structure, using the high resolution images and extremely accurate colors afforded by the Hubble Deep Field data alone. These avenues are all being explored at the moment.
References
- (1)
- (2) Bruzual, G, & Charlot, S. 1993, ApJ, 405, 538
- (3) Freeman, K.C. 1970, ApJ, 160, 811
- (4) Giavalisco, M., Steidel, C. C., & Machetto, F. 1996, ApJ, in press (Paper V)
- (5) Leitherer, C., Vacca, W. D., Conti, P.S., Filippenko, A.V.,& Sargent, W.L.W. 1996, ApJ, in press
- (6) Leitherer, C., Ferguson, H. C., Heckman, T.M., & Lowenthal, J.D. 1995, ApJ, 454, L19
- (7) Madau, P. 1995, ApJ, 441, 18
- (8) Madau, P., Ferguson, H.C., Dickinson, M., Giavalisco, M., Steidel, C.C., & Fruchter, A.S. 1996, AJ, submitted
- (9) Oke, J.B., et al. 1995, PASP, 107,3750
- (10) Steidel, C.C., & Hamilton, D. 1992, AJ, 104, 941 (Paper I)
- (11) Steidel, C.C., & Hamilton, D. 1993, AJ, 105, 2017 (Paper II)
- (12) Steidel, C.C., Pettini, M., & Hamilton, D. 1995 (Paper III), AJ, 110, 2519
- (13) Steidel, C.C., Giavalisco, M., Pettini, M., Dickinson, M., & Adelberger, K. 1996, ApJ, in press (Paper IV).
- (14) Williams, R.E., et al. 1996, AJ, submitted
- (15) Yee, H.K.C., Ellingson, E., Bechtold, J., Carlberg, R.G., & Cuillande, J.-C., AJ, in press
| Object | F450W | F300WF450W | (J2000) | (J2000) | z | |
|---|---|---|---|---|---|---|
| C2-01 | 25.19 | 0.95 | 2.25 | 12 36 45.30 | 62 13 47.89 | |
| C2-02 | 24.30 | 0.13 | 1.87 | 12 36 44.01 | 62 14 10.81 | |
| C2-03 | 25.00 | 0.33 | 1.77 | 12 36 45.84 | 62 14 12.73 | |
| C2-04 | 25.21 | 0.33 | 1.67 | 12 36 50.22 | 62 13 30.74 | |
| C2-05 | 23.58 | 0.41 | 1.74 | 12 36 48.23 | 62 14 17.59 | 2.845 |
| C2-06 | 24.35 | 0.33 | 1.65 | 12 36 48.16 | 62 14 19.42 | |
| C2-07 | 25.17 | 0.15 | 1.96 | 12 36 49.93 | 62 13 52.99 | |
| C2-08 | 24.84 | 0.38 | 2.37 | 12 36 50.02 | 62 14 02.08 | |
| C2-09 | 25.18 | 0.76 | 2.44 | 12 36 51.13 | 62 13 49.77 | |
| C2-11 | 25.21 | 1.07 | 2.13 | 12 36 52.66 | 62 13 40.06 | |
| C2-12 | 24.77 | 1.05 | 2.15 | 12 36 53.34 | 62 13 30.39 | |
| C2-13 | 24.60 | 0.21 | 1.89 | 12 36 54.98 | 62 13 48.05 | |
| C2-14 | 21.08 | 0.98 | 2.79 | 12 36 52.73 | 62 14 33.04 | star |
| C3-01 | 24.37 | 0.33 | 1.63 | 12 36 54.63 | 62 13 15.82 | |
| C3-02 | 24.89 | 0.10 | 1.62 | 12 36 51.24 | 62 12 28.34 | 2.775 |
| C4-01 | 25.30 | 0.30 | 2.54 | 12 36 49.59 | 62 12 20.76 | |
| C4-02 | 25.12 | 1.11 | 2.09 | 12 36 48.54 | 62 12 16.86 | |
| C4-03 | 25.25 | 0.25 | 2.95 | 12 36 46.84 | 62 12 27.13 | |
| C4-04 | 25.23 | 0.87 | 2.33 | 12 36 48.21 | 62 11 46.94 | |
| C4-05 | 24.89 | 0.26 | 2.94 | 12 36 43.18 | 62 12 39.92 | |
| C4-06 | 23.48 | 0.86 | 2.39 | 12 36 45.26 | 62 11 53.78 | 2.803 |
| C4-07 | 25.22 | 0.37 | 1.72 | 12 36 42.32 | 62 12 33.56 | |
| C4-08 | 24.37 | 0.51 | 2.57 | 12 36 41.58 | 62 12 39.92 | 2.591 |
| C4-09 | 24.21 | 1.11 | 2.24 | 12 36 41.14 | 62 12 04.00 | 3.226 |
| Name | Redshift | aaMagnitude in a arcsec radius aperture, on the scale | bbMagnitude in a arcsec radius aperture, on the scale | ccIsophotal magnitude, on the scale | FitddFunction which better models the radial profile: d=; e=exp; p=point-source | eeFit scale length: for ; for exp. In arcsec | ffCore half-light radius in arcsec, from direct photometry | ggTotal half-light radius in arcsec, from direct photometry | a/b |
|---|---|---|---|---|---|---|---|---|---|
| C2-01 | 26.23 | 25.30 | 25.19 | e | 0.19 | 0.24 | 0.25 | 1.53 | |
| C2-02 | 25.33 | 24.79 | 24.30 | d | 1.13 | 0.22 | 0.27 | 1.46 | |
| C2-03 | 25.99 | 25.11 | 25.00 | e | 0.56 | 0.24 | 0.25 | 2.13 | |
| C2-04 | 25.82 | 25.21 | 25.21 | e | 0.17 | 0.16 | 0.16 | 2.12 | |
| C2-05 | 2.845 | 24.23 | 23.61 | 23.58 | d | 0.80 | 0.16 | 0.16 | 1.23 |
| C2-06 | 25.46 | 24.35 | 24.35 | d | 0.38 | 0.27 | 0.27 | 1.19 | |
| C2-07 | 25.51 | 25.17 | 25.17 | p? | 0.13 | 0.13 | 2.00 | ||
| C2-08 | 25.69 | 24.84 | 24.84 | d | 0.25 | 0.22 | 0.22 | 1.64 | |
| C2-09 | 26.12 | 25.27 | 25.18 | d | 0.72 | 0.22 | 0.25 | 1.81 | |
| C2-11 | 25.49 | 25.13 | 25.21 | p? | 0.13 | 0.13 | 1.16 | ||
| C2-12 | 25.57 | 24.77 | 24.77 | d | 0.29 | 0.20 | 0.20 | 1.86 | |
| C2-13 | 25.25 | 24.60 | 24.60 | e | 0.32 | 0.18 | 0.18 | 1.20 | |
| C3-01 | 24.74 | 24.37 | 24.37 | p? | 0.13 | 0.13 | 1.56 | ||
| C3-02 | 2.775 | 25.83 | 24.99 | 24.89 | d | 1.73 | 0.25 | 0.25 | 2.13 |
| C4-01 | 25.79 | 25.30 | 25.30 | e | 0.10 | 0.16 | 0.16 | 1.42 | |
| C4-02 | 25.65 | 25.15 | 25.12 | e | 0.08 | 0.16 | 0.16 | 1.20 | |
| C4-03 | 25.93 | 25.25 | 25.25 | e | 0.13 | 0.18 | 0.18 | 1.91 | |
| C4-04 | 26.05 | 25.23 | 25.23 | d | 0.98 | 0.22 | 0.22 | 2.12 | |
| C4-05 | 25.71 | 24.99 | 24.89 | e | 0.19 | 0.22 | 0.22 | 1.29 | |
| C4-06a | 2.803 | 24.99 | 24.13 | 23.48 | e | 0.17 | 0.22 | 0.55 | |
| C4-06b | 2.803 | 25.41 | 24.25 | 23.48 | e | 0.54 | 0.29 | 0.65 | |
| C4-07 | 25.56 | 25.22 | 25.22 | p? | 0.13 | 0.13 | 1.41 | ||
| C4-08 | 2.591 | 25.42 | 24.70 | 24.37 | d | 0.66 | 0.20 | 0.27 | 2.91 |
| C4-09 | 3.226 | 25.33 | 24.28 | 24.21 | d | 0.15 | 0.36 | 0.38 | 1.45 |