COMPTEL detection of the high-energy -ray source 2CG 135+01
Abstract
We present an analysis of COMPTEL observations made between November 1991 and May 1994 of 2CG 135+01, a bright -ray source located near the Galactic plane. At energies above 1 MeV, an excess consistent with the position of 2CG 135+01 is detected in the sum of the observations, at flux levels which are a factor of below those published in the past. The detection significance of this excess, when the possible presence of underlying Galactic diffuse emission is neglected, is for 3 degrees of freedom. The differential photon spectrum in the 1–30 MeV energy range can be described by a power law with a spectral index of . Due to the uncertainties involved in modelling the Galactic-disk diffuse emission underneath the source, the absolute flux levels must be considered uncertain by a factor of two. They are consistent with the extrapolation of the time-averaged spectrum of 2CG 135+01 measured with EGRET, thereby strengthening the identification. No significant temporal correlation between the -ray emission and the monitored radio emission of the possible counterpart radio source GT 0236+610 (showing a 26.5 day modulation) is found.
Key words: Gamma rays: observations – Stars: individual: 2CG 135+01 – Stars: individual: GT 0236+610
1 Introduction
With a flux above 100 MeV of photons cm-2 s-1, the -ray source 2CG 135+01 is one of the brightest unidentified high-energy Galactic-plane sources in the second COS-B catalogue (Hermsen et al. 1977; Swanenburg et al. 1981). 2CG 135+01 attracted attention when its position was found to be consistent with that of the radio source GT 0236+610, which exhibits strong radio outbursts of a non-thermal character (Gregory & Taylor 1978). Long-term radio observations of GT 0236+610 subsequently revealed a 26.496-day periodicity in these outbursts (Taylor & Gregory 1982, 1984), of which the amplitude is possibly modulated by a 4-year period (Gregory et al. 1989; Paredes et al. 1990). The decay of the radio flux during outbursts is reminiscent of synchrotron emission from an expanding cloud of relativistic electrons (Taylor & Gregory 1984). In a high-resolution map obtained two days post-outburst from VLBI measurements at 6 cm, the object appears to consist of two components separated by (Massi et al. 1993). Optically, GT 0236+610 has been identified with LS I , which has a spectrum typical of an early-type B star (Hutchings & Crampton 1981; Maraschi et al. 1981; Paredes & Figueras 1986) and exhibits the near-infrared excess commonly observed for Be-type stars (D’Amico et al. 1987; Hunt et al. 1994). Recent modelling of the JHK-band light curves of LS I has shown that the onsets of the radio outbursts roughly coincide with the inferred periastron passage (Martí & Paredes 1995). The source has also been detected in X-rays (Bignami et al. 1981; Goldoni & Mereghetti 1995). The X-ray spectrum is rather hard compared to those of normal B stars, but is similar to spectra observed for Be/X-ray binaries.
In recent observations made with EGRET on board the Compton Gamma-Ray Observatory (CGRO), a source designated 2EG J0241+6119 was detected on several occasions (Thompson et al. 1995). This source, whose position is consistent with that of 2CG 135+01 and which is roughly as bright, is generally assumed to be the COS-B source. The improved position of the -ray source established by the EGRET detection of 2EG J0241+6119 (a 95% error radius of ) is consistent with that of GT 0236+610 (located at ) and has strengthened the proposed identification with the radio source. In addition, the nearby QSO 4U 0241+61 (located at ), which was also contained in the relatively large COS-B error region, is now firmly rejected (von Montigny et al. 1993).
A detection of the 26.496 day periodicity in -rays would remove any remaining doubt about the identification with GT 0236+610, but neither COS-B nor EGRET has yet detected such flux variations. Note that the 26.496-day periodicity inferred from radio observations of GT 0236+610 has possibly been detected at infrared and optical wavelengths as well (Mendelson & Mazeh 1989; Paredes et al. 1994), with smaller flux variations towards shorter wavelengths. At UV wavelengths and in X-rays, where the positional accuracy is good enough to allow a confident identification with GT 0236+610, orbital-phase related flux variations have not been detected up to recently (Bignami et al. 1981; Howarth 1983; Goldoni & Mereghetti 1995). The factor of increase of the X-ray flux in the light curve measured with ROSAT during the monitoring of one orbital cycle (Taylor et al. 1996) may be the first evidence of orbital-modulated X-ray emission.
Despite the firm detections of GT 0236+610 up to X-rays and of 2CG 135+01 above 100 MeV, the situation around 1 MeV is less clear. When we compare the spectral index measured for GT 0236+610 with ROSAT (: Goldoni & Mereghetti 1995) with that measured for 2CG 135+01/2EG J0241+6119 with EGRET (: Fierro 1995), it is evident that a spectral break must occur in between. This naturally also holds if the two sources are not related. A simple extrapolation of the measured power laws to the MeV energy range predicts fluxes in the range of , which is close to the detection threshold of COMPTEL. A preliminary analysis of COMPTEL observations of the 2CG 135+01 field, based on three observations made between November 1991 and August 1992, did not reveal evidence for such a strong source but showed the presence of a weak excess consistent with the position of 2CG 135+01 (van Dijk et al. 1994).
2 Instrument and Observations
COMPTEL (Schönfelder et al. 1993) is a -ray telescope on board CGRO, sensitive in the 0.75–30 MeV range. It has a wide field of view of steradian, a source location accuracy of and an energy resolution ranging from at 1 MeV to at 6 MeV. Incoming photons first Compton scatter on an electron in the upper layer of detectors (D1) through an angle after which they are completely or partially absorbed in the lower detector layer (D2).
The COMPTEL data consist of events which are defined as coincident interactions in the two detector layers. These events are binned in a 3-dimensional data space, of which the first two dimensions denote the coordinates and of the direction of the scattered photon. The third dimension, the calculated scatter angle , follows from the well-known Compton formula and is equal to the true scatter angle only if the electron and photon are completely absorbed in D1 and D2 respectively.
Given a celestial intensity distribution, the expected distribution of events in the 3D data space is the convolution of the intensity distribution with the instrument response function, which is the product of a 3D point-spread function (PSF) and a total exposure. The latter has been subdivided into a 3D geometry function and a 2D exposure function for practical reasons. Throughout this paper we used PSFs obtained from Monte Carlo simulations, taking into account the full spherical response representation.
Table1 gives a log of the observations which were used for the analysis presented here. Unfortunately, during most of these observations, the angular distance between the source and the pointing direction was not favorable.
| Obs | Time | Phase | |
|---|---|---|---|
| 15 | 1991, Nov. 28–Dec. 12 | 0.096-0.631 | 22.2 |
| 31 | 1992, Jun. 11–Jun. 25 | 0.499-0.023 | 29.3 |
| 34 | 1992, Jul. 16–Aug. 06 | 0.820-0.610 | 27.2 |
| 211 | 1993, Feb. 25–Mar. 09 | 0.272-0.725 | 11.4 |
| 319.0 | 1994, Mar. 01–Mar. 08 | 0.197-0.464 | 28.1 |
| 319.5 | 1994, Mar. 15–Mar. 22 | 0.727-0.990 | 27.0 |
| 325 | 1994, Apr. 26–May 10 | 0.311-0.840 | 15.2 |
3 Analysis

The COMPTEL data were analysed in the standard energy ranges 0.75–1, 1–3, 3–10 and 10–30 MeV, as well as in a combined 1–30 MeV energy range. Significance and flux maps were produced using the maximum-likelihood ratio (MLR) method. For a description of the application of this method to COMPTEL data, the reader is referred to de Boer et al. (1992). The errors quoted in this paper are statistical only, i.e. they do not include the estimated systematic flux uncertainty.
3.1 Model fitting and the instrumental background model
To account for flux contributions from nearby point sources and the underlying Galactic diffuse emission, the MLR analysis allows for the inclusion of data-space models in addition to an instrumental background model. Such data-space models are created by folding the celestial intensity distribution, a simple delta function for point sources, through the instrument response.
The basic principle of the instrumental background model used here is described by Bloemen et al. (1994). It is created by fitting -templates, obtained from the scaled geometry function, to the event data space itself. This background model has recently been improved upon by iteratively correcting the -templates for contributions from fitted models of detected celestial sources. The modification becomes important when there are strong sources (e.g., the Crab or large-scale diffuse emission) in the field of view. In the first iteration of the model fitting, no correction is performed. If a positive signal is found for one or more models, a second iteration can be performed during which the -templates are corrected for the -dependent model contributions. This procedure is repeated until the scale factors of the fitted models converge.

The effective exposure function for the observations listed in Table1 covers a large part of the sky and extends beyond . We therefore must take into account the non-negligible influence of the events originating from the Crab ( in the 1–30 MeV range compared to for 2CG 135+01) on the background model by including a data-space model for the Crab. For this set of observations, the situation is particularly confusing because the signals of the Crab and of a source at the position of 2CG 135+01/2EG J0241+6119 are at a maximum in the same region of the data space (the region where the geometry function peaks, see Fig.1). When models for both the Crab and for 2CG 135+01/2EG J0241+6119 are included simultaneously, this sometimes causes the Crab flux to be underestimated and the 2CG 135+01/2EG J0241+6119 flux to be overestimated in the first iteration of the background modelling. In general, iterations are needed to correct for this effect.
4 Results
4.1 Spatial analysis
When all the observations in Table1 are summed, an excess consistent with the position of 2CG 135+01 is found at energies above 1 MeV. Below 1MeV an upper limit is obtained. Fig.2 shows the location contours for the 1–30 MeV energy range; the maximum of the excess has a MLR value of 50.9. This corresponds to a point-source detection significance of for 3 d.o.f. (neglecting the possible presence of underlying Galactic diffuse emission), while at the position of 2CG 135+01 it is (1 d.o.f.). In the standard energy ranges 1–3 MeV, 3–10 MeV and 10–30 MeV, the peak MLR values are 24.4, 18.8 and 10.3 respectively. In the individual observation periods the signal is either weak or not detected at all.
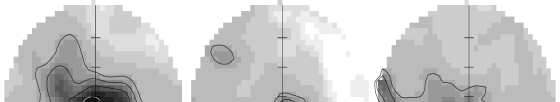
In Fig.3a, the significance maps for the standard energy ranges above 1MeV are shown. In each of these maps, an excess consistent with the position of 2CG 135+01 can be observed. The significance in the highest energy range is marginal (), while below 3 MeV the excess is broader than expected for a single point source. When a data-space model for a source at the position of 2CG 135+01/2EG J0241+6119 is included, we obtain the residual maps as shown in Fig.3b. None of the remaining excesses by itself is formally significant at the level for a free search, but the number of excesses yield it unlikely that all are just statistical fluctuations. One of the possible celestial components, that of the Galactic diffuse emission, is discussed in Section4.4. A possible contribution from point sources, however, cannot be excluded. Most noticeable is the weak emission around in the 1–3 MeV map in Fig.3, which is completely due to a strong () excess observed during Obs.325. It is not seen in any other energy range nor in any other COMPTEL observation (see also Bhattacharya & Owens 1994). After a correction for a minimum number of trials (4 energy intervals, 7 observations), its significance in Obs.325 is only slightly larger than , which does not confidently exclude a statistical background fluctuation as origin. However, located only away from 2CG 135+01/2EG J0241+6119 (but not consistent with the position of the latter at the level), the apparent source has a non-negligible influence on the flux derived for the COMPTEL source in the mosaic of the observations and thus has to be accounted for.
4.2 Spectral analysis
The analysis in the previous section was performed with PSFs for an assumed power-law photon spectrum with . Since the fluxes and likelihoods depend only slightly on the assumed input spectrum, this was not a bad approximation. In order to find the power-law index that fits the data best, the MLR analysis has been repeated using PSFs with various values for until the ratios of the fluxes measured in different energy ranges are consistent with the assumed input spectrum.
Such flux ratios were calculated using PSFs with indices ranging from 1.4 to 2.8. In the model fitting we included a data-space model for the Crab in each energy range, while for the 1–3 MeV range we also included a model for the nearby excess P1 to correct for its influence on the flux derived for the COMPTEL source. In Table2 we show the results for the extreme values of index as well as for . Also listed are the expected ratios for power-law spectra with these indices.
| Index | (1-3/3-10) | (3-10/10-30) | (1-3/10-30) |
|---|---|---|---|
| 1.4 | |||
| 1.44 | 1.74 | 2.51 | |
| 2.0 | |||
| 2.86 | 3.50 | 10.00 | |
| 2.8 | |||
| 7.03 | 8.98 | 63.10 |
| [MeV] | Flux | |
|---|---|---|
| no diff. models | incl. diff. models | |
| 0.75–1 | ||
| 1–3 | ||
| 3–10 | ||
| 10–30 | ||
Although the measured ratios are not very sensitive to the assumed input spectrum, the expected ratios differ considerably. The indices that fit the COMPTEL data best are and for the and hardness ratios respectively. They are consistent with a single power law across the entire COMPTEL energy range with and amplitude . Adopting this spectral index, the time-averaged COMPTEL fluxes and upper limits are given in the second column of Table3. The upper limit in the 0.75–1 MeV range is inconsistent with the power law at the level, which suggests that there is a spectral break in the COMPTEL energy domain. Note that at 1 MeV, the COMPTEL flux levels are a factor of below those reported in the past for the emission from this celestial region (Coe et al. 1978; Perotti et al. 1980).
4.3 Temporal analysis
We performed a search for flux variations correlated with the orbital period of GT 0236+610. For this the data for each energy range were binned and analysed in 5 phase bins of width 0.2, assuming an orbital period of days with phase 0 at JD 2,443,366.775 (Taylor & Gregory 1984). In the phase bins that contained a contribution from Obs. 325, we again included a point-source model for the excess observed in that observation in the 1–3 MeV range (see Section4.1). The radio lightcurves differ significantly from cycle to cycle and the phase of the peak outburst is seen to vary by more than . Therefore, this approach may fail to detect correlations of the weak -ray flux with the orbital period if the -ray flux variations occur, like the radio-flux variations, at irregular phases. Note that the error on the orbital period corresponds to a total relative phase shift during the observations given in Table1 of only 1%, but that the absolute phase may be wrong by , corresponding to .

The results of this analysis are shown in Fig.4. In each energy range, a -fit with a constant distribution has been used to determine if there is evidence for orbital-phase related flux variations. The values thus obtained are 5.49, 6.10 and 3.38 for 4 d.o.f., indicating that the COMPTEL data do not show evidence for flux variations correlated with the orbital phase. Due to the large statistical flux errors, however, and the above-mentioned possibility of peak fluxes occurring at irregular phases, -ray variability similar to that observed in X-rays with ROSAT (Taylor et al. 1996) cannot be excluded.
4.4 The Galactic diffuse emission
So far in the analysis we have not taken into account the possible contribution of diffuse emission from the Galactic disk. If this component, which is dominant at energies above 100 MeV, is indeed not negligible at COMPTEL energies in this region of the sky, then the flux of the COMPTEL source could be significantly lower than derived above. Furthermore, Monte Carlo simulations have shown that weak diffuse emission from a Galactic-disk distribution may result in several weak point-source-like excesses at low latitudes, similar to those observed in Fig.3.
4.4.1 The diffuse models
The classical interpretation of the Galactic diffuse emission above 100 MeV is that it is dominated by -decay, resulting from nuclear interactions between cosmic-ray (CR) particles and nuclei of the interstellar gas (for an overview see Bloemen 1989). Below 100 MeV, the main contribution is thought to come from bremsstrahlung losses of low-energy CR electrons interacting with the interstellar gas. In both cases, the celestial -ray distribution is expected to correlate approximately with that of the interstellar gas, as mapped by HI and CO surveys (the latter component assumed to be a tracer of ). Studies performed with SAS-2 and COS-B data () have shown that such a correlation indeed exists (e.g., Fichtel & Kniffen 1984; Bloemen 1989). It should be noted that the assumptions about the CR density distribution, e.g., whether or not it is coupled to matter, differ among the various studies. Another component () that is thought to contribute to the Galactic diffuse emission both below and above 100 MeV is inverse Compton radiation from high-energy CR electrons scattering on the interstellar radiation field. The relative contribution of this component near the Galactic plane probably does not exceed 5%–10% at energies near 100 MeV (see Bloemen, 1989, for an overview).
Recent analyses revealed that the COMPTEL data show evidence for a broader latitude distribution than those of the HI and CO models. It remains uncertain, however, whether this should indeed be attributed to IC emission. Furthermore, an emission component that correlates with the CO distribution appears to be lacking in the COMPTEL energy regime (Strong et al. 1996; Bloemen et al. 1996), except perhaps for the 10-30 MeV energy range (van Dijk 1996). Also, it should be noted that part of the inferred diffuse intensities may be due to unresolved, weak point sources. Clearly, the problem of the Galactic diffuse emission at COMPTEL energies requires further study. Here we will use the current understanding to discuss the possible implications for the quantities derived in Sections4.2 and 4.3.
4.4.2 Implications for derived quantities
In order to assess the possible influence of the Galactic diffuse emission underneath the COMPTEL source on the derived source flux, we repeated the MLR analysis presented above including data-space models for the interstellar gas, using the same HI and CO surveys that were used in the COS-B studies (Bloemen 1989) and adapting the model for the IC distribution from Strong & Youssefi (1995). Firstly, we fitted only the HI and IC models, fixing the HI emissivities and the scaling factors for the IC models at the values found by Strong et al. (1996). As a result, the fluxes in the 1–3 MeV and 3–10 MeV ranges are reduced by a factor of (third column in Table3). Above 10 MeV, the flux drops below significance. The photon spectral index derived from these reduced 1–3 MeV and 3–10 MeV fluxes is consistent with that derived in Section4.2, although not very constraining. Since the errors on the fluxes have remained roughly constant, the temporal analysis from Section4.3 is expected to yield even lower -values and was therefore not repeated.
Secondly, we investigated a worst-case scenario in which the CO model is added to the HI and IC models with a fixed value for the CO-to- conversion factor . Although correlations of the -ray emission with the CO distribution have not been found for COMPTEL data, fixing at the value found above 100 MeV gives an estimate of the error made in case the CO component is present, but for some reason is not recognized. The inclusion of the CO model is found to result in a small decrease of the 1–3 MeV and 3–10 MeV fluxes inferred for the COMPTEL source of less than .
The effect of including the models for the Galactic diffuse emission on the parameters derived for the COMPTEL source can only be considered to be crudely estimated. It is therefore likely that the fluxes given in the second column of Table3 are overestimated, but due to the uncertainties in modelling the Galactic diffuse emission, the fluxes given in the third column of Table3 should be interpreted with caution as well.
5 Discussion
5.1 Identification of the COMPTEL source
The celestial distributions of neither the HI nor the IC models can mimic a point-source-like feature at the position of 2CG 135+01. So, despite the uncertainties in the absolute flux levels of the COMPTEL source due to the unknown contribution of the Galactic diffuse emission, the mere presence of a source consistent with the position of 2CG 135+01 is evident. If we extrapolate the time-averaged high-energy -ray spectrum measured for 2CG 135+01/2EG J0241+6119 (Fierro 1995; lines labeled ‘EGRET’ in Fig.5), we find that the COMPTEL fluxes prior to the correction for the Galactic diffuse emission (points labeled ‘COMPTEL’ in Fig.5) are consistent with the extrapolations. When the models for the Galactic diffuse emission are included, the fluxes are still consistent, but appear to be somewhat low (points labeled ‘COMPTEL(D)’). Although this may indicate that the contribution of the diffuse emission is overestimated, a spectral break is expected to occur somewhere in this energy range.
The extrapolations of the X-ray spectra measured for GT 0236+610 (lines labeled ‘ROSAT’ in Fig.5) and for the quasar 4U 0241+61 (the dashed lines) do not reject any of the two being the possible counterpart of the COMPTEL source. There are several arguments, however, which favour GT 0236+610 being the counterpart. Firstly, 4U 0241+61 has only been detected up to (Turner & Pounds, 1989) and is not seen with EGRET . On the other hand, both ROSAT and EGRET have reported detections coincident with GT 0236+610, with location uncertanties that leave little room for other counterparts (Goldoni & Mereghetti 1995; von Montigny et al. 1993; Thompson et al. 1995). Secondly, the only active galactic nuclei (AGNs) that have been detected with COMPTEL (and EGRET) up to now are those which are radio loud and have flat radio spectra. This is consistent with the findings from an analysis of EXOSAT ME data by Lawson et al. (1992), who found a steeper average 2–10 keV spectrum for radio-quiet QSOs (photon index ) than for radio-loud QSOs (). Although 4U 0241+61 has been shown to contain a compact radio core with an inverted radio spectrum, the radio flux of at 5 GHz is rather low (Apparao et al. 1978) and has only been detected at radio wavelengths because it is relatively nearby (). Unless 4U 0241+61 behaves very differently from other radio-quiet QSOs at MeV energies, it is not likely that its spectrum extends into the COMPTEL energy range.
Apart from GT 0236+610 and 4U 0241+61, there are no other sources in the SIMBAD data base that can be regarded potential counterparts, in the sense that there are no strong non-thermal X-ray or high-energy -ray emitters nearby. A possible contribution from the large molecular complex W3 at , as part of the Galactic diffuse emission, was estimated to have a small impact (Section4.4.2).
5.2 Comparison with theory
The previous sections have shown that the identification of the COMPTEL source with 2CG 135+01 is likely, but that the absolute flux levels are uncertain by a factor of two. Here we will address the possible implications for the main theoretical models for 2CG 135+01/GT 0236+610, assuming for now that the radio source and the -ray source are indeed one and the same.
Based on the presence of a compact object (Hutchings & Crampton 1981), two basic models exist to explain the variable radio emission and the possible high-energy emission of the Be/X-ray binary GT 0236+610. In the supercritical accretion (SA) model (Taylor & Gregory 1982, 1984; Taylor et al. 1992), a neutron star is in an eccentric orbit around the Be star, accreting from the slow high-density equatorial wind of the latter. For suitable chosen values of the wind parameters and the eccentricity, the radio outbursts arise from the energetic particles produced during the supercritical accretion that occurs near periastron passage. The four-year modulation and the varying phases of the peak radio fluxes may be explained by a varying speed of the equatorial wind of the Be star (Martí & Paredes 1995). However, it is not clear why the X-ray luminosity during outbursts is several orders of magnitudes below that for other Be/X-ray binaries (Taylor et al. 1996).
Maraschi & Treves (1981), on the other hand, proposed the so called young-pulsar model, in which the outbursts and high-energy emission originate in the shock front that results from the collision of the stellar-disk wind and the relativistic pulsar wind. Such a model has also been used for the highly non-thermal 1–200 keV emission detected from the Be star/pulsar system PSR1259–63 containing a 47 ms radio pulsar (Tavani, Arons & Kaspi 1994; Tavani et al. 1996). In the case of the PSR1259–63 system, accretion onto the surface of the neutron star is inhibited by the strong radiation pressure from the pulsar’s electromagnetic and relativistic particle wind. The high-energy emission is produced by synchrotron and inverse-Compton emission of shock accelerated particles. Shock-powered high-energy emission is of general importance in pulsar binaries and the 2CG 135+01 system may belong to the category of hidden pulsars (Tavani 1995).
Both types of models involve a neutron star in an eccentric orbit around the Be star and predict, to some degree, time variability of the -ray emission correlated with the orbital period. The COMPTEL data on the other hand are consistent with a constant flux, but the large statistical errors on the COMPTEL fluxes (Table3) do not allow for tight constraints on the variability. At -ray energies above 100 MeV, the chance that the flux from 2CG 135+01/2EG J0241+6119 is constant between observations is only 0.1% (Fierro 1995), while an increase by a factor of was observed within a single observation (Kniffen et al., in preparation). In the young-pulsar model of emission, orbital modulation of the high energy emission depends on the poorly understood pitch angle evolution of radiating shock-accelerated particles of the pulsar wind. Upstream of the shock, the particles flow radially away from the pulsar and therefore initially have a nonisotropic velocity distribution. For large values of the ratio of the electromagnetic and plasma flow energies upstream, the shocked particles acquire preferential directions of motion (Gallant et al. 1992) and a dependence of the -ray emission on orbital phase might be observed. If, on the other hand, this ratio is low, the onset of the Weibel instability may isotropize the downstream flow and therefore the -ray emission (Weibel 1959; Hoshino et al. 1992). Note that in both of these cases, the shock-powered emission may be more dependent on the varying conditions of the pulsar cavity being compressed by the gaseous outflow from the companion star (Tavani, Arons & Kaspi 1994).
The COMPTEL measurements presented here imply a luminosity in the 1–30 MeV energy range of ( if the models for the diffuse emission are included). Together with the ROSAT and EGRET measurements, this implies a total luminosity above 0.1 keV of . For comparison, the inferred total energy in the relativistic electrons responsible for the radio outbursts, which typically last several days, is only (Taylor & Gregory 1984). A high-energy luminosity near may be powered by shock emission of a relativistic pulsar wind, as observed in the case of the plerionic Crab Nebula and for the binary Be star/pulsar system PSRB1259–63 (Tavani et al. 1996). Here, the deduced spindown luminosity of the underlying pulsar would be of the order of for a conversion efficiency into the -ray band of about 10% (similar to the conversion efficiencies observed for the Crab Nebula and for PSRB1259–63). The possible spectral break observed for 2CG 135+01 in the MeV energy range may, when more accurately determined, be used to constrain parameters such as the kinetic energy of the particles and the electromagnetic energy flux upstream.
6 Conclusions
We have detected a COMPTEL source consistent with the position of 2CG 135+01/2EG J0241+6119 in the energy range 1–30 MeV. The flux at 1 MeV is roughly two orders of magnitude below the values reported in the past for a source in this celestial region. The COMPTEL spectral shape is consistent with the spectral break expected from extrapolations of the ROSAT and EGRET observations of GT 0236+610 and 2CG 135+01/2EG J0241+6119 respectively. -Ray observations with higher spatial resolution, or showing correlated variability, are necessary to prove unambigously the association between the radio source GT 0236+610 and the -ray source 2CG 135+01.
-
Acknowledgements.
We thank J.van Paradijs for his helpful comments on an earlier version of the manuscript. We acknowledge the constructive comments from the referee G.F.Bignami, which have improved the readability of the paper. R.van Dijk acknowledges the support by the Netherlands Foundation for Research in Astronomy (NFRA), with financial aid from the Netherlands Organisation for Scientific Research (NWO). The COMPTEL project is supported by the German government through DARA grant 50 QW 90968, by NASA under contract NAS5-26645 and by the Netherlands Organisation for Scientific Research (NWO). M.Tavani acknowledges the support by the NASA grant no.NAG 5-2729. This research has made use of data obtained through the High Energy Astrophysics Science Archive Research Center Online Service, provided by the NASA-Goddard Space Flight Center. This research has also made use of the Simbad database, operated at CDS, Strasbourg, France.
References
- 1 Apparao K.M.V.et al., 1978, Nat 273, 450
- 2 Bhattacharya D., Owens A., 1994, ApJ 430, 371
- 3 Bignami G.F.et al., 1981, ApJ 247, L85
- 4 Bloemen H., 1989, ARA&A 27, 469
- 5 Bloemen H.et al., 1994, ApJS 92, 419
- 6 Bloemen H.et al., 1996, in preparation
- 7 D’Amico N.et al., 1987, A&A 180, 114
- 8 de Boer H.et al., 1992, in: Data Analysis in Astronomy IV, eds.V. Di Gesù et al. (New York: Plenum Press), Vol 59, p241
- 9 Coe M.J., Quenby J.J., Engel A.R., 1978, Nature 274, 343
- 10 Fichtel C.E., Kniffen D.A., 1984, A&A 134, 13
- 11 Fierro J.M., 1995, Ph.D.Thesis, Stanford University
- 12 Gallant Y.A.et al., 1992, ApJ 391, 73
- 13 Goldoni P., Mereghetti S., 1995, A&A 299, 751
- 14 Gregory P.C., Taylor A.R., 1978, Nat 272, 704
- 15 Gregory P.C.et al., 1989, ApJ 339, 1054
- 16 Hermsen W.et al., 1977, Nat 269, 494
- 17 Hoshino M.et al., 1992, ApJ 390, 454
- 18 Howarth I.D., 1983, MNRAS 203, 801
- 19 Hunt L.K., Massi M., Zhekov S.A., 1994, A&A 290, 428
- 20 Hutchings J.B., Crampton D., 1981, PASP 93, 486
- 21 Lawson A.J.et al., 1992, MNRAS 259, 743
- 22 Maraschi L., Treves A., 1981, MNRAS 194, 1P
- 23 Maraschi L., Tanzi E.G., Treves A., 1981, ApJ 248, 1010
- 24 Martí J.& Paredes J.M., 1995, A&A 298, 151
- 25 Massi M.et al., 1993, A&A 269, 249
- 26 Mendelson H., Mazeh T., 1989, MNRAS 239, 733
- 27 Paredes J.M., Figueras F., 1986, A&A 154, L30
- 28 Paredes J.M., Estalella R., Rius A., 1990, A&A 232, 377
- 29 Paredes J.M.et al., 1994, A&A 288, 519
- 30 Perotti F.et al., 1980, ApJ 239, L49
- 31 Schönfelder et al., 1993, ApJS 86, 657
- 32 Strong A.W., Youssefi G., 1995, Proc.24th ICRC, 3, 48
- 33 Strong A.W.et al., 1996, in proceedings of the 3rd Compton Symposium (Munich), in press
- 34 Swanenburg B.N.et al., 1981, ApJ 243, L69
- 35 Tavani M., 1995, in The Gamma-Ray Sky with GRO and SIGMA, eds.M.Signore, P.Salati & G.Vedrenne (Dordrecht: Kluwer), p.181
- 36 Tavani M., Arons J., Kaspi V.M., 1994, ApJ 433, L37
- 37 Tavani M.et al., 1996, A&AS, in press
- 38 Taylor A.R., Gregory P.C., 1982, ApJ 255, 210
- 39 Taylor A.R., Gregory P.C., 1984, ApJ 283, 273
- 40 Taylor A.R.et al., 1992, ApJ 395, 268
- 41 Taylor A.R.et al., 1996, A&A 305, 817
- 42 Thompson D.J.et al., 1995, ApJS 101, 259
- 43 Turner T.J., Pounds K.A., 1989, MNRAS 240, 833
- 44 Turner T.J.et al., 1991, ApJ 381, 85
- 45 van Dijk R.et al., 1994, AIP Conf.Proc.304, 324
- 46 van Dijk R., 1996, Ph.D.Thesis, University of Amsterdam
- 47 von Montigny C.et al., 1993, IAU Circ.5708
- 48 Weibel E.S., 1959, Phys.Rev.Lett.2, 83
- 49 Worrall D.M.et al., 1980, ApJ 240, 421