A Precision Age Determination CITA-96-6 CWRU-P6-96
Technique for Globular Clusters
Abstract
Globular cluster age estimates based on the absolute magnitude of the main sequence turn-off () are generally considered to be the most reliable from a theoretical viewpoint. However, the difficulty in determining in observed colour-magnitude diagrams leads to a large error in the derived age. In this paper, we advocate the use of the absolute magnitude of the point which is brighter than the turn-off and 0.05 mag redder () as a precision age indicator. It is easy to measure this point on observed colour-magnitude diagrams, leading to small observational error bars. Furthermore, an extensive Monte Carlo calculation indicates that the theoretical uncertainty in is similar to . As a result, ages derived using are at least a factor of 2 more precise than those derived using . This technique is applied to the globular cluster M68 and an age of Gyr is derived (assuming ), indicating that M68 is a ‘young’ globular cluster. A homogeneous set of globular cluster age estimates with this precision would provide unprecedented insight into the formation of the Galactic halo.
keywords:
globular clusters: general — methods: data analysis — stars: evolution — stars: interiors — stars: Population II1 Introduction
There are a number of different techniques which may be used to determine the age of a globular cluster (GC). All of these methods rely on comparing some aspect of theoretical stellar evolution models to the observations. Thus, in order to evaluate the reliability of the various age indicators, one must be aware of the uncertainties in theoretical stellar evolution models. The correct treatment of convection in stellar models is an area of active research (e.g. Kim et al. 1995, 1996; Demarque, Guenther & Kim 1996a,b) and remains the largest possible source of error in stellar models. For this reason, properties of the stellar models which depend on the treatment of convection are the most uncertain. The main sequence and red giant branch stars in GCs have surface convection zones, and so the predicted radii (and hence, colours) are subject to large theoretical uncertainties. The helium burning stars (horizontal branch, and asymptotic giant branches) are convective in the energy generation regions, and so even the predicted lifetimes and luminosities of stars in this phase of evolution are somewhat uncertain. An additional consideration when considering the reliability of stellar models is that observed CNO abundances in stars on the red giant branch indicate that some form of deep mixing occurs in these stars, which is not present in the models (e.g. Langer et al. 1983; Kraft 1994; Chaboyer 1995). This indicates that the red giant branch models are in need of revision. In contrast, low mass main sequence models are in excellent agreement with the observations. Indeed, inversions of solar models which use the observed -modes indicate that the run of density and sound speed in solar models agree with the Sun to within 1% [Basu et al. 1996].
The relative reliability of the age-luminosity relationship for low mass stars is well known, and it is for this reason that the absolute magnitude of main sequence turn-off () results in GC ages with the smallest theoretical error (e.g. Renzini 1991). Operationally, is defined to be the magnitude of the bluest point on the main sequence. (Since this definition involves the use of colour is not strictly independent of the uncertainties in stellar radii.) Unfortunately, the turn-off region has nearly the same colour over a large range in magnitude. This leads to difficulties measuring observationally, due to the scatter in the observed points around the turn-off. Observers typically quote errors of order 0.10 mag in , which leads to an error in the derived age around Gyr (e.g. (Sarajedini & King 1989; Chaboyer, Demarque & Sarajedini 1996, hereafter CDS). This large error in the derived age of any individual GC is a great obstacle in furthering our understanding of galaxy formation. This problem has lead Sarajedini & Demarque (1990) and VandenBerg, Bolte & Stetson (1990) to advocate the use of the difference in colour between the main sequence turn-off and the base of the giant branch () as an age indicator. This method has the advantage that the colour of the turn-off and the base of the giant branch can be accurately determined in observed colour-magnitude diagrams (CMDs), and is independent of the distance modulus. As a result, this method can lead in principle to very precise age estimates (of order Gyr). However, the theoretical colours are subject to large uncertainties and only yields reliable relative age differences between clusters of a similar metallicity (see, however, the case of M68 and M92 (§3) for which fails).
In this paper, we advocate the use of a point which is brighter than the turn-off, and 0.05 mag redder in B–V (hereafter referred to as ). This point is easy to measure in observational data and has a small theoretical uncertainty. As it still requires knowledge of the distance modulus, complements the technique in providing precision age estimates for GCs. In §2, a Monte Carlo set of isochrones is described and analyzed in order to estimate the theoretical error associated with and . The well studied GC M68 is used to illustrate the relative precision of ages derived using and in §3. Finally, §4 summarizes the results of this work and suggests that observers should quote in their papers in addition to . Simple formulae are provided to determine GC ages, given and .
2 Theoretical Analysis
The basic problem in measuring is that the turn-off region is nearly vertical in the HR diagram. Thus, the colour of the main sequence turn-off is well defined, but its magnitude is not. As stars evolve off the main sequence they quickly expand, and so points somewhat brighter than the turn-off are more horizontal in the HR diagram. Thus, it is easy to measure the magnitude of , and ages derived using will have small observational error bars. The main reason for using as an age indicator is that it is widely perceived to be the most robust of the theoretical age estimators. Thus, ages derived using have small theoretical ‘error bars’. The key question then is whether the theoretical uncertainty in is similar to that in . If that is the case, then there would be no reason to use in GC age estimates.
The theoretical error in may be estimated by constructing a series of isochrones under a variety of assumptions. In a study designed to provide an estimate of the error associated with GC ages Chaboyer, Demarque, Kernan & Krauss (1996, hereafter CDKK) calculated 1000 independent sets of isochrones. These isochrones were constructed via a Monte Carlo analysis, whereby the various input elements needed to compute a stellar model and isochrone (such as opacity, mixing length, etc.) were picked at random from distributions based on a careful analysis of the recent literature. Table 1 provides an outline of the various input parameters and their distribution. Further details are provided in CDKK. This Monte Carlo study was designed to yield a set of isochrones which span the range of relevant uncertainties in modern stellar evolution calculations.
| Parameter | Distribution | Comment |
| mixing length | (stat.) | fits GC observations |
| helium diffusion coefficients | 0.3 – 1.2 (syst.) | possible systematic error dominate |
| nuclear reaction rates | see CDKK | |
| OPAL high temperature | (stat.) | comparison of OPAL |
| opacities | & LAOL opacities | |
| surface boundary condition | grey or Krishna-Swamy (1966) | |
| colour table | Green et al. (1987) or Kurucz (1992) | |
| primordial 4He abundance | (syst.) | possible systematic error dominate |
| oxygen abundance, [O/Fe] | (stat.) | |
| (syst.) | ||
In the original work, each set of isochrones consisted of 45 isochrones in the age range 8 – 22 Gyr, with metallicities and . We have supplemented this with additional calculations with and to span the majority of the GC metallicity range. The three lowest metallicity isochrones in the original set assumed that the helium abundance was equal to its primordial value (). The higher metallicity isochrones in the new calculations allowed for some helium enrichment, assumed to be , where is the mass fraction of heavy elements. In addition, the isochrone assumed that the oxygen enhancement was one-half (in dex) of that in the more metal-poor isochrones. In total, about stellar evolutionary runs were performed, involving the calculations of nearly 8 million stellar models.
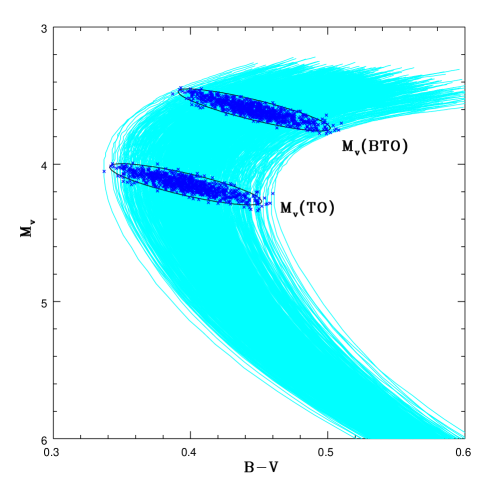
The Monte Carlo set of 14 Gyr, isochrones is shown in Figure 1, with the turn-off and brighter points highlighted. This figure demonstrates the very wide range in colour which is possible in theoretical isochrones, given the uncertainties in present stellar models and isochrone construction. As expected, the range is rather small. The 1- (68% confidence limits) range in is mag. The 1- range in is nearly identical, mag. This analysis has been repeated for the other metallicities, and in all cases the spread in was found to be quite similar to the spread in . The mean 1- range was mag in , and mag in . This analysis was repeated on a subset of 400 Monte Carlo isochrones with ages of 10 and 18 Gyr and similar results were obtained. This strongly suggests that the theoretical error associated with ages derived from will be similar to those derived from .
This issue may be addressed directly by comparing the spread in derived ages for a given value of and . Using the standard set of isochrones described in the next paragraph, values of and were chosen which yielded an age of 15 Gyr. These fixed values of and (along with the corresponding metallicity) were used as input parameters for a program which determined the corresponding ages in each of our 1000 independent sets of isochrones. The resulting set of 1000 and ages were analyzed. The dispersion in age was only slightly larger for ages derived using as compared to . For example, the 1- dispersion at was Gyr for the ages versus Gyr for the ages derived using . This indicates that the theoretical uncertainty in ages derived using is similar to the theoretical uncertainty in ages derived using .
Given that has a similar theoretical uncertainty to the next important issue to address is the sensitivity of to age changes. In order to evaluate this issue, a single set of isochrones was constructed, with our best estimate for the input physics111High temperature opacities from Iglesias & Rogers (1991); low temperature opacities from Kurucz (1991); nuclear reaction rates from Bahcall & Pinsonneault (1992) and Bahcall (1989); an equation of state which includes the effects of Coulomb interactions [Guenther et al. 1992, Chaboyer & Kim 1995]; helium diffusion coefficients from Michaud & Proffitt (1993) multiplied by 0.75; a grey model atmosphere was used for the surface boundary conditions, a near solar mixing length of and the colour transformation of Green, Demarque & King (1987) was used to transform the isochrones to the observational plane. and composition. For the primordial helium abundance, a value of was chosen. The effect of the enhancement of the -capture elements (O, Mg, Si, S, and Ca) was taken into account by modifying the relationship between and , as prescribed by [Salaris, Chieffi & Straniero 1993]. Over the range a value of was employed [Nissen et al. 1994], while at , was assumed. In this set of isochrones, the points and were determined and fit to a simple quadratic of the form
| (1) |
where is the age in units of Gyr. The coefficients of the fit at each metallicity are given in Table 2. These coefficients are valid for derived ages in the range 8 – 22 Gyr.
| 2.261 | 0.1641 | 1.886 | 0.1452 | ||||
| 2.513 | 0.1506 | 1.996 | 0.1521 | ||||
| 2.596 | 0.1626 | 2.190 | 0.1546 | ||||
| 2.981 | 0.1343 | 2.449 | 0.1503 | ||||
| 3.063 | 0.1288 | 2.563 | 0.1529 | ||||
Figure 2 plots a subset of the standard set of isochrones for ages of 10, 14, 18 Gyr, and (the same metallicity as in Fig. 2). This figure graphically illustrates that and have similar sensitivity to age changes. The sensitivity of and as age indicators may be evaluated analytically by taking the derivative of eq. 1. A good age indicator will have a large derivative, as this implies a small change in results in a large change in age. The ratio of the derivatives in eq. 1 between to was calculated for all 5 metallicities and found to vary between 0.9 to 1.2. This indicates that has a similar sensitivity to age changes as over the entire metallicity range tested. Given that has a similar theoretical uncertainty to , and that both are equally sensitive to age changes, and that it is easier to measure in observational databases, is clearly a superior age diagnostic.

3 Application to Observations
In order to determine ages using either or , the distance modulus to the cluster must be known. There are two main techniques which may be used to determine the distance to a GC: (1) main sequence fitting to local sub-dwarfs with well measured parallaxes, and (2) using the observed magnitude of the horizontal branch (HB) combined with a relationship for the absolute magnitude of the HB (derived using RR Lyrae stars). Unfortunately, there is only one sub-dwarf with a well measured parallax (error in the absolute magnitude less than 0.05 mag), Groombridge 1830 [van Altena, Lee & Hoffleit 1995], so the application of main sequence fitting to GCs is still rather uncertain. Until improved sub-dwarf parallaxes become available, the use of the HB to set the distance scale to globular clusters will remain popular. The HB has the advantage that the difference in magnitude between the main-sequence turn-off and the horizontal branch () is independent of reddening. Thus, is a widely used age determination technique, which uses as its age diagnostic (e.g. CDS). Although there are significant uncertainties in the absolute magnitude of the RR Lyrae stars (used to determine in the theoretical calibration), CDS have shown that many statements can be made regarding the relative GC ages which are independent of the RR Lyrae calibration. This is very important, as the error in the absolute ages is dominated by the error in the distance modulus (CDKK). To exploit the merits of as an age indicator on observations, we suggest the use of a modified approach, using the difference in magnitude between and the HB, in order to study relative GC ages, and the formation of the Galactic halo.
The well studied GC M68 [Walker 1994] provides an ideal database to test this new age determination technique. This is a relatively metal-poor cluster with [Zinn & West 1984]. Its HB morphology is predominantly blue but significantly redder than other clusters with comparable metallicity. This led Zinn (1993) to classify M68 as a relatively young halo cluster (see also Da Costa & Armandroff 1995). From Table 5 of Walker (1994), the mean V magnitude of the RR Lyraes is , where the uncertainty is the standard error of the mean. There is also an error in the photometric zero-point, but that is not included here because will be combined with V(TO) making the error in the absolute photometric scale irrelevant. For the theoretical HB magnitude, the preferred relationship of CDS and CDKK, was arrived at after a review of the current literature. Recent HST data [Ajhar et al. 1996] indicates that the slope is shallow, suggesting that may be a somewhat better choice. However, as emphasized by CDS, most statements regarding relative GC ages are independent of the particular choice of .
Walker (1994) measured a turn-off magnitude of , and hence . Due to the difficulty in determining the turn-off point, Walker (1994) elected to increase his error in to mag. Using our standard set of isochrones and the age of M68 is Gyr using the larger error, and Gyr with the smaller error bar in . If the shallower slope for is chosen (), an age of is derived. This age is 18% younger than that derived by CDS, using the same relation. The difference in age is due to the different input physics used to construct the isochrones. CDS ignored the effects of diffusion (7% increase in age), the Coloumb correction to the equation of state (7%) and assumed a somewhat smaller -element enhancement (, 4%).
In order to derive the age using , an objective technique was used to measure . A fifth order polynomial () was fitted to the stars in the region of the turnoff using a 2- rejection scheme. This polynomial yields and . The error in V(BTO) is determined by constructing a histogram of the V deviations from the fit using stars within mag in () of the point. A gaussian is then fitted to the histogram. The standard deviation of this gaussian divided by the square root of the number of data points used is then the 1- error in . Application of this technique to the M68 data [Walker 1994] results in . Note that the error in is an order of magnitude smaller than the error in V(TO).
Combining the above value of with the mean RR Lyrae magnitude results in which implies an age of Gyr. Due to the extremely high precision in the determination of the error in the age is dominated by the error in metallicity ( dex), and not by the error in measuring . If the error in is increased to mag, then the error in the age increases slightly to Gyr. An error of order in allows for a greater error in the determination of the HB level, and is perhaps more typical of most data in the literature. This example clearly demonstrates that ages derived using are at least a factor of two more precise those derived using .
CDKK constructed a sample of 17 metal-poor GCs (mean ), which were believed to be old based on or the horizontal branch morphology. The mean age of these 17 GC using our standard set of isochrones is Gyr. Note that the error in the age of M68 is smaller than the error in the mean age of 17 GCs determined using . The difference in age between M68 and these old clusters is Gyr, showing that M68 is indeed a young GC for its metallicity. This statement could not be made using the data and demonstrates the usefulness of using to probe relative GC ages. As high precision age estimates become available for other metal-poor GCs, it will become possible to test the assumption of CDKK that the 17 GCs in their sample had the same age.
In their study, VandenBerg et al. (1990) determined that the difference in colour between the turn-off and the base of the red giant branch was the same for M68 and M92. This implied that M68 had the same age as M92 and other metal-poor GCs. This is somewhat surprising, in light of the young age for M68 determined via . To explore this question further, we have performed a detailed comparison of the CMDs for M92 and M68 using the deep M92 photometry of Stetson & Harris (1988), the M92 RR Lyrae photometry of Carney et al. (1991), and the M68 photometry from Walker (1994). This comparison reveals that, while VandenBerg et al. (1990) showed that M68 and M92 have nearly identical values, the and values of M68 differ by approximately 0.1 magnitude as compared with those of M92. Thus, whereas appears to indicate that these two clusters have identical ages (to within 0.3 Gyr), V shows that M68 is 2 Gyr younger than M92. Salaris et al. (1993) and Zinn (1993) have shown that, in general, ages derived via and are in good agreement. However, Salaris et al. (1993) also point out that M68 is one of a small number of clusters for which this is not the case, in accordance with our result. This implies that age is not the only variable which differs between these two clusters. It is not clear what this other variable could be. It could simply be different compositions (such as ), or it could be something more exotic (such as rotation, or convection) which differs between stars in these two clusters. This is an interesting issue which we are currently investigating. Our ability to distinguish such small differences between the V values of M68 and M92 is a testament to the improvements made in the reduction and calibration of globular cluster photometry and the use of the age diagnostic.
4 Summary
An extensive Monte Carlo analysis indicates that the theoretical uncertainty in is similar to . The sensitivity of to age changes is similar to . The objective fitting technique described in §3 indicates that the error in measuring in observational data is mag, at least an order of magnitude smaller than the error typically quoted in V(TO). Hence, is a superior age indicator to . We suggest that observers should measure as outlined in §3, and provide this value as a routine part of the analysis of GC CMDs. A calibration of age as a function of (for B–V data) is presented in eq. 1 and Table 2. A similar calibration for V–I data is presented in appendix A.
The use of as an age indicator requires a knowledge of the distance modulus. We suggest the use of the absolute magnitude of the horizontal branch so that ages can be derived using the difference in magnitude between the horizontal branch, and V(BTO), . This leads to an age for M68 () of Gyr, assuming . The error in the derived age is dominated by the error in metallicity. This is an internal error, useful in comparing relative ages, and does not include the error due to the uncertainty in the calibration. However, as shown by CDS, many statements concerning relative ages are true independently of the choice of . For example, M68 is significantly younger (Gyr) than the mean age of 17 other low metallicity GC. This statement is true over the full range in calibrations quoted in the literature. If the age of M68 had been determined using the published value of V(TO), it would not be possible to state that M68 is a young GC, due to the large error in the derived age (Gyr). This demonstrates the unique advantage of using to probe relative GC ages, which should lead to new insights into the formation of the Milky Way.
Acknowledgments
L.M.K. was supported by the Department of Energy and funds provided by Case Western Reserve University. A.S. was supported by NASA grant number HF-01077.01-94A from the Space Telescope Science Institute, which is operated by the Association of Universities for Research in Astronomy, Inc., under NASA contract NAS5-26555.
Appendix A Application to () Data
The discussion of this paper (and calibration presented in Table 2) has centered on the use of () data. However the use of to measure ages can be easily extended to other colours. Increasingly, observers have obtained GC CMDs using V, (). The point may be defined as the magnitude of the point which is brighter than the turn-off, and 0.05 mag redder in (). This will not correspond exactly to the same point defined in () data, but will be in a similar region of the HR diagram. In order to facilitate the use of with () data, Table 3 presents the fitting coefficients which can be combined with eq. 1 to obtain the age of a GC, given in V, () data.
| 1.971 | 0.1452 | ||
| 2.148 | 0.1395 | ||
| 2.228 | 0.1524 | ||
| 2.462 | 0.1482 | ||
| 2.578 | 0.1507 |
References
- [Ajhar et al. 1996] Ajhar, E.A. et al. 1996, AJ, 111, 1110
- [Basu et al. 1996] Basu, S., Christensen-Dalsgaard, J., Schou, J., Thompson, M.J. & Tomczyk, S., 1996, Ap. J., in press
- [Bahcall 1989] Bahcall, J.N. 1989, Neutrino Astrophysics (Cambridge: Cambridge Univ. Press)
- [Bahcall & Pinsoneault 1992] Bahcall, J.N. & Pinsonneault, M.H. 1992, Reviews of Modern Physics, 64, 885
- [Carney et al. 1992] Carney, B. W., Storm, J., Trammell, S. R. & Jones, R. V. 1992, PASP, 104, 44
- [Chaboyer 1995] Chaboyer, B. 1995, in Stellar Evolution: What Should Be Done?, eds. A. Noels, D. Fraipont-Caro, M. Gabriel, N. Grevesse & P. Demarque (Liège: Institut d’Astrophysique), 345
- [CDS] Chaboyer, B., Demarque, P. & Sarajedini, A. 1996, ApJ, 459, 558
- [Chaboyer et al. 1996] Chaboyer, B., Demarque, K., Kernan, P.J. & Krauss, L.M. 1996, Science, 271, 957
- [Chaboyer & Kim 1995] Chaboyer, B. & Kim, Y.-C. 1995, ApJ, 454, 767
- [Da Costa & Armandroff 1995] Da Costa, G.S. & Armandroff, T. 1995, AJ, 109, 2533
- [Demarque, Guenther & Kim 1996a] Demarque, P., Guenther, D.B. & Kim, Y.-C. 1996a, ApJ, submitted
- [Demarque, Guenther & Kim 1996b] Demarque, P., Guenther, D.B. & Kim, Y.-C. 1996b, in Stellar Evolution: What Should Be Done?, eds. A. Noels, D. Fraipont-Caro, M. Gabriel, N. Grevesse & P. Demarque (Liège: Institut d’Astrophysique), 279
- [Green, Demarque & King 1987] Green, E.M., Demarque, P. & King, C.R. 1987, The Revised Yale Isochrones & Luminosity Functions (New Haven: Yale Univ. Obs.)
- [Guenther et al. 1992] Guenther, D.B., Demarque, P., Kim, Y.-C. & Pinsonneault, M.H. 1992, 387, 372
- [Iglesias & Rogers 1991] Iglesias, C.A. & Rogers, F.J. 1991, ApJ, 371, 408
- [Kim et al. 1995] Kim, Y.-C., Fox, P.A., Sofia, S. & Demarque, P. 1995, ApJ, 442, 422
- [Kim et al. 1996] Kim, Y.-C., Fox, P.A., Demarque, P. & Sofia, S. 1996, ApJ, 461, 000 (in press)
- [Krishna-Swamy 1966] Krishna-Swamy, K.S. 1966, ApJ, 145, 176
- [Kurucz 1991] Kurucz, R.L. 1991, in Stellar Atmospheres: Beyond Classical Models, ed. L. Crivellari, I. Hubeny, D.G. Hummer, (Dordrecht: Kluwer), 440
- [Kurucz 1992] Kurucz, R.L. 1992, in IAU Symp. 149, The Stellar Populations of Galaxies, ed. B. Barbuy, A. Renzini, (Dordrecht: Kluwer), 225
- [Kraft 1994] Kraft, R.P. 1994, PASP, 106, 553
- [Langer et al. 1983] Langer, G.E., Kraft, R.P., Carbon, D.F., Friel, E. & Oke, J.B. 1986, PASP, 98, 473
- [Michaud & Proffitt 1993] Michaud, G. & Proffitt, C.R. 1993, in Inside the Stars, IAU Col. 137, ed. A. Baglin & W.W. Weiss (San Fransico: PASP), 246
- [Nissen et al. 1994] Nissen, P., Gustafsson, B., Edvardsson, B. & Gilmore, G. 1994, A&A, 285, 440
- [Renzini 1991] Renzini, A. 1991, in Observational Tests of Cosmological Inflation, eds. T. Shanks, et al. , (Dordrecht: Kluwer), 131
- [Salaris, Chieffi & Straniero 1993] Salaris, M. Chieffi,A. & Straniero, O. 1993, ApJ, 414, 580
- [Sarajedini & Demarque 1990] Sarajedini, A. & Demarque, P. 1990, ApJ, 365, 219
- [Sarajedini & King 1989] Sarajedini, A. & King, C.R. 1989, AJ, 98, 1624
- [Stetson & Harris 1988] Stetson, P. B. & Harris, W. E. 1988, AJ, 96, 909
- [van Altena, Lee & Hoffleit 1995] van Altena, W.A., Lee, John Truan-liang, & Hoffleit, D. 1995, The General Catalogue of Trigonometric Parallaxes (Yale University Observatory: New Haven, CT)
- [VandenBerg, Bolte & Stetson 1990] VandenBerg, D.A., Bolte, M. & Stetson, P.B. 1990, AJ, 100, 445
- [Walker 1994] Walker, A.R. 1994, AJ, 108, 555
- [Zinn 1993] Zinn, R. 1993, in The Globular Cluster-Galaxy Connection, eds. G.H. Smith & J.P. Brodie (San Francisco: ASP), 38
- [Zinn & West 1984] Zinn, R. & West, M. 1984, ApJS, 55, 45