A candidate gravitational lens in the Hubble Deep Field
Abstract
The discovery of HDF J123652+621227, a candidate gravitational lens in the HDF, is reported. This lens may be multiply imaging several optical sources at different redshifts. If follow-up spectroscopy of the lens and the brightest image confirms this hypothesis, observations of this system alone can be used to obtain an estimate of the redshift distribution at extremely faint flux levels.
1 Introduction
Cosmologically distant galaxies ought to act as multiply imaging gravitational lenses for a fraction of background sources (Turner, Ostriker & Gott 1984; Blandford & Narayan 1992; Schneider, Ehlers & Falco, 1992). This prediction is being borne out by surveys of flat spectrum radio sources (Patnaik et al 1992; Myers et al 1995) and optical surveys (Maoz et al 1992; Glazebrook et al 1994; Ratnatunga et al 1995). The incidence and character of strong gravitational lenses provide an important constraint on the source redshift distribution and world model at magnitudes too faint for direct spectroscopy (Kneib et al 1994; Kochanek 1992).
Recent Hubble Space Telescope (HST) observations of the Hubble Deep Field (HDF; Williams et al 1995) permit the optical lensing rate to be estimated in a uniform manner, using a single observation. The HDF images are the deepest images in the visible ever taken: U, B, V and I-band images with point-source detection limits near 27, 29.5, 29.5 and 28.5 mag, respectively. Approximately 2500 faint ‘‘galaxies’’ can be identified over 4 square arcmin, so the total number on the whole sky amounts to sources, a number roughly thirty times the product of the local bright galaxy density and the volume of an Einstein-de Sitter Universe out to . Possible explanations of this excess include fading (Babul & Rees 1992) or merging (Guiderdone & Rocca-Volmerange, 1991) of galaxies, counting multiple sub-galactic star formation sites within a common potential well as individual galaxies (Katz 1992; Colley et al 1996), or extreme cosmological models with large amounts of comoving volume per unit luminosity distance (Fukugita et al 1990). An important means of distinguishing between explanations is to determine the redshift distribution of these sources.
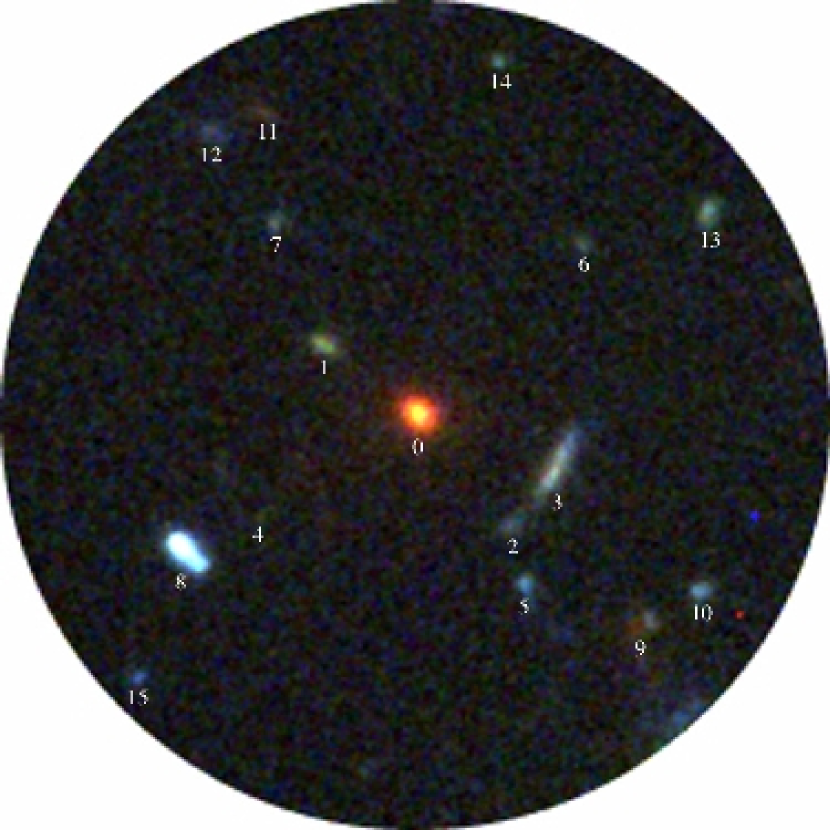
In the HDF, cases of multiple imaging are expected (e.g., Turner et al 1984; Miralda-Escudé & Lehar 1992); the actual number constrains the redshift distribution of the very faint sources observed in the HDF relative to brighter populations (such as quasars) for which both the lensing rate and the redshift distribution are better known. This measurement can be used to constrain the redshift distribution of sources at much fainter levels than the limits of current spectroscopic surveys. We have begun a partially automated search for multiply imaged sources derived from that used in the CLASS survey (Myers et al 1995). After inspection of two dozen candidate lens systems, the most probable case was found to be HDF J123652+621227. This system consists of 16 components, all within 5 arcsec of a red, mag elliptical galaxy (component 0, hereafter c. 0) at RA , Dec (J2000), identified as the lens candidate (Figure 1). The most striking of these companion images are a thin, mag tangential arc (c. 3) on one side and a mag counterimage (c. 1) on the other. This configuration is seen in other gravitational lenses, e.g., FSC10214+4724 (Eisenhardt et al 1996). It occurs when a source is located close to a cusp of the lens mapping in the source plane (Blandford & Narayan 1992; Schneider et al 1992). In addition to the arc and counterimage, there are a number of other faint sources surrounding c. 0 which may be multiply imaged. If this hypothesis is confirmed by follow-up observations, this lens system alone will provide significant constraints on faint source redshift distributions, because the redshifts of all the lensed and unlensed components nearby c. 0 can be estimated or at least constrained with lens models.
2 Models
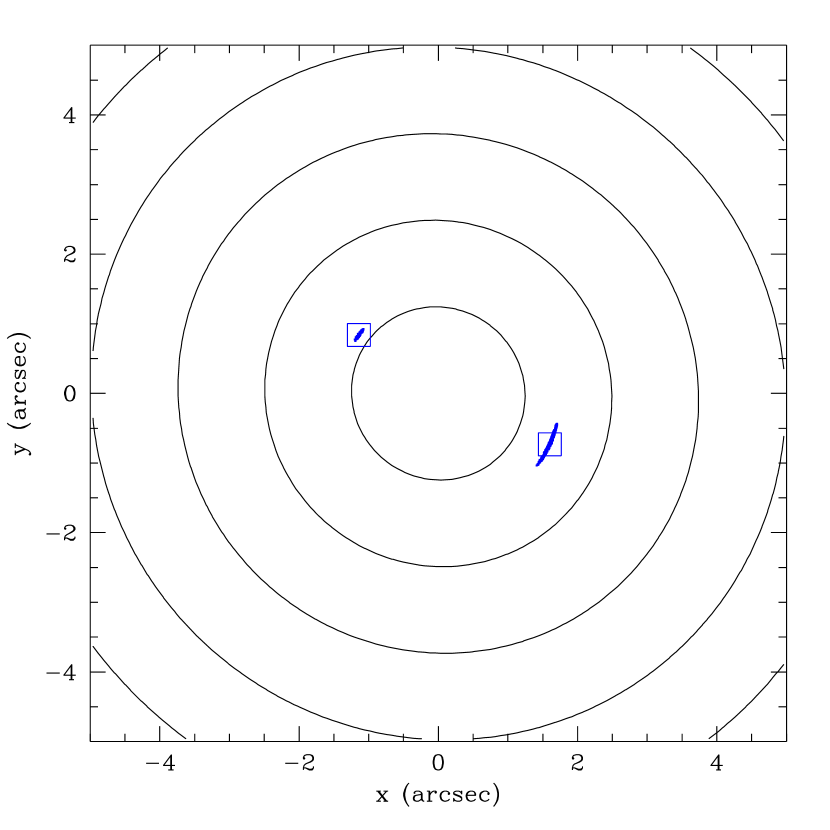
A simple lens model is made for the locations and relative magnifications of cc. 1 and 3, based on a circular disk background source (denoted A) of radius being lensed by c. 0, with the lens modeled with a three-parameter, singular isothermal elliptical potential (Kochanek 1991; Blandford & Narayan 1992; Schneider et al 1992)
| (1) |
Here is a coordinate system on the sky with the lens center at ; is the deflection angle; is the asymptotic critical radius, or radius of the Einstein ring in the absence of any ellipticity or external shear; sets the ellipticity of the potential and sets the orientation. The best-fit model, which reproduces the observed positions, relative fluxes, and relative tangential lengths of cc. 1 and 3 well, is shown in Figure 2. In addition to the quality of the fit, this model is also compelling because the derived orientation of the surface potential agrees within measurement error ( deg) with the position angle of c. 0 and because c. 2 can also be accommodated in this model by introducing a second source, A′, close to A but with a different color. Its counterimage is near c. 1 but too faint to be observed. In the circular-source model, c. 1 is tangentially elongated while it is marginally extended in the radial direction in the HDF images. This discrepancy can be ameliorated by making the background source elliptical. In addition, cc. 1 and 3 have slightly different colors. We attribute this to the differential magnification of spatially distinct (and hence differently colored) regions of the source given that it lies very close to a caustic in the source plane. Such differential magnification is important in arc-counterimage systems (cf., Eisenhardt et al 1996). Both of these problems would be eliminated if c. 3 were modeled as a ‘‘naked cusp’’ (Schneider et al 1992) in which case there would be no counterimage and c. 1 would be a foreground galaxy, probably associated with c. 0, and possibly providing some of the large shear required to make the naked cusp geometry.
Parameter is related to 1-D velocity dispersion by , where is the ratio of the angular diameter distance from lens to source to the angular diameter distance from observer to source, which depends on cosmological parameters and lens and source redshifts. In this model , with tending to its lower bound as , i.e., as the redshift of c. 0 becomes much smaller than the redshift of source A.
Looking out to larger angular radii from c. 0, it is striking that the two reddest objects (cc. 9 and 11) in the vicinity of c. 0 have the same colors as one another, lie at comparable radii from c. 0 but on opposite sides, along the major axis of c. 0, the line of maximum lensing probability (Schneider et al 1992). It is possible to generalize the lens model to accomodate this pair and at least one other by adding additional sources at different redshifts and angular positions behind c. 0. The lens potential is augmented with a two parameter, external shear (Kochanek 1991) to make
| (2) |
which allows for a potential ellipticity which varies with radius. For each new source an additional, independent parameter is the angular diameter distance ratio . In decreasing order of probability of being multiply imaged, several pairs of components are discussed below:
-
1.
cc. 9 and 11 both have colors of mag, placing them among the reddest 300 images in the HDF. Their source is designated B. The images can be fit in position and relative magnification as a gravitational lens pair with only minimal changes to the base lens potential with .
-
2.
cc. 5 and 7, assigned source C, can be fit in position but less well (to within a factor ) in relative magnification with . The addition of new potential parameters allow this observable to be reproduced accurately (albeit with a decrease in the simplicity of the model).
-
3.
We find that the positions of cc. 10 and 12 cannot be fit to better than arcsec in any simple model. We therefore propose that they do not comprise a gravitational lens pair but rather have separate single sources with . This is consistent with these components having significantly different colors.
-
4.
The positions of cc. 8 and 13 can be reproduced within the model using a single source. However, the magnification ratio differs from the observed value by a factor . We therefore conclude that either these are two independent sources or that c. 8 is blended with a brighter foreground source. Either explanation is consistent with the observed color differences, and in either case the majority of the flux from c. 8 must be coming from .
-
5.
In the absence of obvious counterimages of similar color, we expect that cc. 4, 6, 14 and 15 are not multiply imaged.
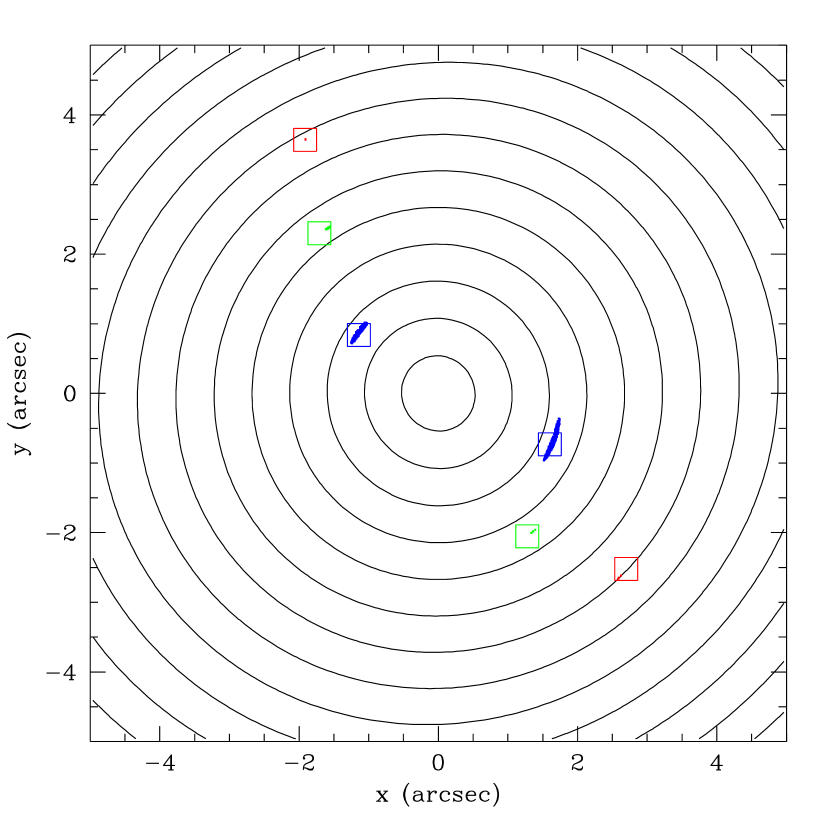
Figure 3 shows a model fit to all the likely multiple image pairs from the above list. If indeed cc. 9 and 11 are a pair multiply imaged by c. 0, then the velocity dispersion of c. 0 rises to with tending to its lower limit as . However, because cc. 9 and 11 are detected in the U band, which ought to lie longward of the Lyman continuum, source B may have (Guhathakurta, Tyson & Majewski 1990; Steidel et al 1996).
The colors of the elliptical lens galaxy c. 0 can be compared with spectral energy distributions of local elliptical galaxies (Coleman, Wu & Weedman 1980) to estimate a photometric redshift. For this purpose, visible fluxes from the HST data and a preliminary near-infrared flux of mag (Soifer, B. T., Matthews, K. & Armus, L., private communication; Cowie, L. L., private communication) were used; the best-fit redshift for c. 0 is --. (The uncertainty is somewhat greater because we have ignored evolution.) We will adopt , and in what follows. When , for any source redshift, implying if only cc. 1 and 3 are a gravitational lens pair and if cc. 9 and 11 are also a lens pair. Using the Faber-Jackson (Faber & Jackson 1976) and fundamental plane (Bender, Burstein & Faber 1992) relations we estimate the velocity dispersion to be if the elliptical galaxy is at z=1 and if the galaxy is at z=1.5. These numbers are dependent on cosmography and k-corrections which do not take into account evolution. Thus, the properties of local elliptical galaxies suggest that c. 0 is not massive enough to account for these wide-separation multiple image systems (cc. 9, 11 and 5, 7). On the other hand, this object is selected for multiple imaging, not flux, so it may be associated with a much larger mass distribution than its central light profile would suggest. It is possible that c. 0 is surrounded by a poor cluster like Q 0957+561 (Angonin-Willaime, Soucail & Vanderreiest, 1994) but that the other members galaxies are either too faint or too spread out in solid angle to be identified with c. 0.
3 Predictions
The low-lens-mass hypothesis (i.e., cc. 1 and 3 comprise the only gravitational lens pair) requires while the high-lens-mass hypothesis (cc. 9, 11, and 5, 7 are also pairs) requires , only possible if . If the observed redshifts of cc. 0 and 3, both of which may be obtained in spectroscopic observations currently underway with the Keck Telescope (Cohen, J. G., private communication; Cowie, L. L., private communication; Koo, D. C., private communication; Steidel, C. C., private communication) are consistent with high lens mass, there will be a small but fair sample of distant, faint galaxies (sources A, B and C) whose redshifts and luminosities can be inferred and with which constraints on faint source redshift distributions can be derived by, e.g., maximum likelihood methods. It is emphasized that sources close to c. 0 which are not multiply imaged are just as important in constructing such constraints as those that are multiply imaged. Furthermore, we note that in the high-lens-mass case, two of the multiply imaged sources (B and C) would be too faint to be detected were they not magnified, so some information is obtained about extremely faint sources, for which we have no a priori distance information. Although the distance ratios are relatively insensitive to the cosmography (Schneider et al 1992), it is conceivable that a multi-source lens might be found where redshifts are measured for several images at different radii or where the very existence of images at large radii allows us to constrain or even determine the world model (Soucail & Fort 1991). Finally, not only does the gravitational lens magnify the flux of the background sources, it also elongates them tangentially; the derived radii of sources A, B and C under the trial model are , and pc respectively. This may provide a strong clue as to the nature of these objects.
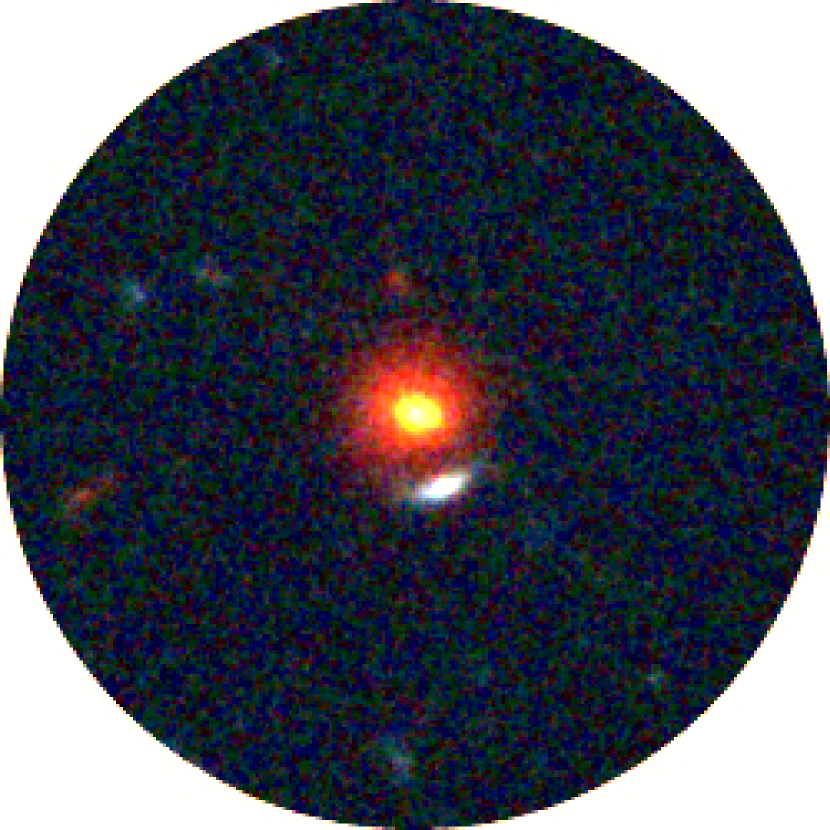
There are three possible further tests of the lensing hypotheses. First, multiply imaged components must have similar infrared colors and optical--radio spectral indices. Observations are underway to obtain ultra-deep imaging of the HDF field at 2 (Neugebauer, G., et al., in preparation) and 5 GHz (Fomalont, E. B., private communication). Greater sensitivity in the infrared should ultimately be achieved with Keck adaptive optics or HST/NICMOS. Secondly, it is surprising that in this field, HDF J123652+621227 alone shows evidence for multiply-imaging many sources. We have suggested that c. 0 may be either a more massive galaxy than is apparent from the HDF image, or associated with a small cluster. It may be possible to substantiate this with deep Keck/LRIS imaging, which may be more sensitive than HST to low surface brightness features. Thirdly, the existence of other galaxies in the HDF similar to c. 0 allows us to identify other potential lenses and to repeat this procedure. By far the best candidate after HDF J123652+621227 is HDF J123656+621221, shown in Figure 4. If we are able to identify several more instances of strong galaxy-galaxy lensing in this or other fields, we will be able to derive better estimates of evolving galaxy luminosity functions. This would be a large step toward solving the puzzle of the excess faint sources.
References
- (1)
- (2) Angonin-Willaime, M.-C., Soucail, G. & Vanderriest, C., 1994, A&A, 291, 411
- (3) Babul, A. & Rees, M. J., 1992, MNRAS, 255, 346
- (4) Bender, R., Burstein, D. & Faber, S. M., 1992, ApJ, 399, 462
- (5) Blandford, R. D. & Narayan, R., 1992, ARA&A, 30, 311
- (6) Coleman, G. D., Wu, C. C. & Weedman, D. W., 1980, ApJS, 43, 393
- (7) Colley, W. N., Rhoads, J. E., Ostriker, J. P. & Spergel, D. N., 1996, astro-ph/9603020
- (8) Eisenhardt, P. R., Armus, L., Hogg, D. W., Soifer, B. T., Neugebauer, G. & Werner, M. W., 1996, ApJ, 461, 72
- (9) Faber, S. M. & Jackson, R. E., 1976, ApJ, 204, 668
- (10) Fukugita, M., Yamashita, K., Takahara, F. & Yoshii, Y., 1990, ApJ, 361, L1
- (11) Glazebrook, K., Lehar, J., Ellis, R., Aragon-Salamanca, A. & Griffiths, R., 1994, MNRAS, 270, L63
- (12) Guhathakurta, P., Tyson, J. A. & Majewski, S. R., 1990, ApJ, 357, L9
- (13) Guiderdone, B. & Rocca-Volmerange, B., 1991, A&A, 252, 435
- (14) Katz, N., 1992, ApJ, 391, 502
- (15) Kneib, J.-P., Mathez, G., Fort, B., Mellier, Y., Soucail, G. & Longaretti, P.-Y., 1994, A&A, 286, 701
- (16) Kochanek, C. S., 1991, ApJ, 373, 354
- (17) Kochanek, C. S., 1992, ApJ, 384, 1
- (18) Maoz, D., Bahcall, J. N., Schneider, D. P., Doxsey, R., Bahcall, N. A., Filippenko, A. V., Goss, W. M., Lahav, O. & Yanny, B., 1992, ApJ, 386, L1
- (19) Miralda-Escudé, J. & Lehar, J., 1992, MNRAS, 259, 31P
- (20) Myers, S. T., et al., 1995, ApJ, 447, L5
- (21) Patnaik, A. R., Browne, I. W. A., Wilkinson, P. N. & Wrobel, J. M. 1992 MNRAS 254 655
- (22) Ratnatunga, K. U., Ostrander, E. J., Griffiths, R. E. & Im, M., 1995, ApJ, 453, L5
- (23) Schneider, P., Ehlers, J., and Falco, E. E., 1992, Gravitational lenses, Springer-Verlag, New York
- (24) Soucail, G., Fort, B., 1991, A&A, 243, 23
- (25) Steidel, C. C., Giavalisco, M., Pettini, M., Dickinson, M. & Adelberger, K., 1996, ApJ, 462, L17
- (26) Turner, E. L., Ostriker, J. P. & Gott, J. R., 1984, ApJ, 284, 1
- (27) Williams, R., et al, 1995, BAAS, 27, 1294
- (28)