06 (13.25.5; 08.02.3; 02.02.1; 02.01.2)
D.J. Crary
1100 Days of BATSE Observations of Cygnus X-1
Abstract
We have examined the power spectral behavior of Cyg X–1 using approximately 1100 days of BATSE data. These data have been searched for correlations between different power spectral features, and for correlations between power spectral features and energy spectral parameters derived from BATSE occultation analysis.
keywords:
X-rays: stars – binaries: general1 Introduction
A data base has been created combining 1100 days of Cyg X–1 observations with BATSE, from JD 2 448 387 to 2 449 480 (May 11, 1991 to May 8, 1994). It includes observations of fast variability (0.01–0.488 Hz) as well as flux measurements (45–140 keV) and energy spectral fits. The goal of this work is to look for correlations between various parameters derived from power spectral, flux, and energy spectral measurements. This work is part of a larger on-going project to systematically study the power spectral behavior of all black-hole candidate sources observed with BATSE.
In Section 2 we describe the methods used for creating the power spectra and the results of the occultation analysis. In Section 3 we show that correlations occur between several quantities derived from the energy spectral and power spectral fits, and briefly discuss these results.
2 Observations
The BATSE occultation analysis technique has been described elsewhere (Harmon et al. [1993]). For this study, the corrected detector count rates for Cyg X–1 have been fit to a power law in the energy range 45–140 keV, and a total flux (photons ) has been calculated for the same energy band. Typically 15–30 measurements are made each day. From these data we produced daily averaged flux and photon spectral index values.
To quantify the rapid variability, we have created power spectra from the 1.024 second time resolution large area detector (LAD) count rate data, using two energy channels covering the range 20–50 and 50–100 keV. These data were filtered to eliminate bursts, then searched for segments with 512 contiguous time bins (524.288 seconds without gaps) when the source was above the Earth’s limb. Each segment was fit to a quadratic polynomial and the fit residuals converted to a power density spectrum (PDS) using standard fast Fourier transform techniques. The PDS was normalized to squared fractional r.m.s. amplitude per unit frequency, according to the method described by Miyamoto et al. ([1994]), using the raw daily averaged detector count rates in the 20–100 keV energy band obtained from the occultation analysis. Interference from other black hole candidate sources (e.g., GRO J171924, GRO J0422+32 and GX 3394) was eliminated by selection of only those detectors in which these sources did not appear.
Using similar 524.288 second intervals obtained when the source was occulted by the Earth, we have determined that the quadratic detrending of the raw data yields a background (source occulted) power level consistent with a pure Poisson process for frequencies between 0.01 Hz and the Nyquist frequency (0.488 Hz). The results obtained are consistent with those obtained using a full background model developed by Rubin et al. ([1993]).


It is well known that the power spectrum of Cyg X–1 has a characteristic shape (Belloni & Hasinger [1990]); the spectrum is flat below a ‘break’ frequency, , and has a power law form above . We have attempted to parameterize the shape of these spectra by fitting to a function, P, of the form
| (1) |
Here is the amplitude of the low frequency part of the spectrum, , and is related to the slope of the power spectrum just above the break frequency. Figure 1 shows three randomly selected spectra and the fits obtained using this functional form. We also calculated the fractional r.m.s. amplitude from the power spectral density for the frequency range 0.01–0.488 Hz.
3 Results
The three power spectral fit parameters (, , ), the fractional r.m.s. amplitude, the the total flux, and photon power-law index were plotted against one another to study the relationships between these quantities. Some of the results are shown in Figs. 2 and 3.
The strongest correlation is observed between the break frequency () and the r.m.s. amplitude (Fig. 2). The fractional r.m.s. amplitude monotonically decreases as the increases. These observations are similar to the results of Belloni & Hasinger ([1990]) based on 13 observations from the EXOSAT archive at lower energies ( 2–20 keV).
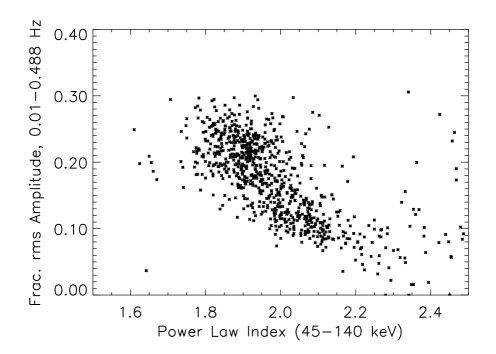
Figure 3 shows a plot of fractional r.m.s. amplitude vs. spectral index of a power law fit in the 45–140 keV band. A correlation is also seen in these data. The energy spectrum generally becomes softer as the r.m.s. amplitude decreases. The fractional r.m.s. amplitude is in the range 8–30% during these observations. The origin of this effect is not well understood. A more detailed study of the type presented here is in preparation.
Acknowledgements.
This project was performed within NASA grant NAG5-2560 and supported in part by the Netherlands Organization for Scientific Research (NWO) under grant PGS 78-277. FvdH acknowledges support by the Netherlands Foundation for Research in Astronomy with financial aid from NWO under contract number 782-376-011. JvP acknowledges support from NASA grant NAG5-2755.References
- [1990] Belloni, T. & Hasinger, G., 1990, A&A 227, L33
- [1993] Harmon, B.A. et al. 1993, in: Friedlander, M., Gehrels, N., Macomb, D., AIP Conf. Proc. 280, Compton Gamma-Ray Observatory. AIP Press, New York, p. 313
- [1994] Miyamoto, S. et al., 1994, ApJ 435, 398
- [1993] Rubin, B.C. et al. 1993, in: Friedlander, M., Gehrels, N., Macomb, D., AIP Conf. Proc. 280, Compton Gamma-Ray Observatory. AIP Press, New York, p. 1127