Extreme X-ray Variability In The Narrow-Line QSO PHL 1092
Abstract
A ROSAT observation of the narrow-line Fe 2 QSO PHL 1092 shows rapid variability that requires an efficiency of at least 0.13, exceeding the theoretical maximum for an accretion disk around a non-rotating black hole. Plausible explanations for this high efficiency incorporate anisotropic emission and/or accretion onto a rapidly rotating black hole, the latter recently suggested by Kwan et al. as a mechanism for generating PHL 1092’s strong Fe 2 lines by mechanical heating in an accretion disk. The soft X-ray luminosity of PHL 1092 had also increased by a factor of 21 over the weak Einstein detection, to more than ergs s-1. Its photon spectral index of 4.2 is among the steepest of any AGN. These X-ray properties are characteristic of narrow-line Seyfert 1 galaxies, of which PHL 1092 is evidently a very luminous member. Narrow-line QSOs also extend a significant correlation between X-ray luminosity and X-ray spectral index which we have found among a large sample of optically-selected, narrow-line Seyfert 1 galaxies observed by ROSAT.
keywords:
galaxies: active — galaxies: Seyfert — quasars: individual (PHL 1092, PG 1404+226) — X-rays: galaxies1 Introduction
Narrow-line Seyfert 1 galaxies (NLS1s, Osterbrock & Pogge 1985; Goodrich 1989) are defined by their optical emission-line ratios and widths: [O 3]/H and FWHM H km s-1. NLS1s also tend to have strong permitted Fe 2, Ca 2 and O 1 8446 emission lines (Persson 1988), as well as high-ionization lines that are typical of Seyfert 1 galaxies. Their high X-ray luminosities were first noted by Remillard et al. (1986) and Halpern & Oke (1987). With ROSAT, NLS1s were discovered to have unprecedented X-ray properties (but first see Remillard et al. 1991). Their X-ray spectra are much softer than those of ordinary Seyfert 1 galaxies (Brandt et al. 1994; Boller, Brandt, & Fink 1996; Pounds, Done, & Osborne 1995), and they display rapid, large-amplitude variability as well as extreme long-term changes (Boller et al. 1993; Brandt, Pounds, & Fink 1995; Grupe et al. 1995a,b). New members of this class found in the ROSAT All-Sky Survey by Moran, Halpern, & Helfand (1996) all have Fe 2 emission to some degree. The latter paper further argues the need for a NLS1 class.
It has long been known that there are high-luminosity analogs of this class, the prototype of which is I Zw 1 (e.g., Phillips 1976), which also have weak forbidden lines, narrow permitted lines, and strong Fe 2. One of the most extreme narrow-line Fe 2 QSOs is PHL 1092 (Bergeron & Kunth 1980, 1984; Kwan et al. 1995). Its Fe 2 4570/H ratio is 5.3, and its line widths are only km s-1 (Bergeron & Kunth 1984). Only a weak X-ray detection of PHL 1092 was made by Einstein (Wilkes et al. 1994). Supported by the results of a ROSAT observation of PHL 1092, we argue that the NLS1s and their QSO analogs can be understood as a single phenomenon, the “I Zw 1” objects. In addition to sharing their extreme X-ray behavior, PHL 1092 might illuminate fundamental puzzles about this distinctive class.
2 Observations and Results
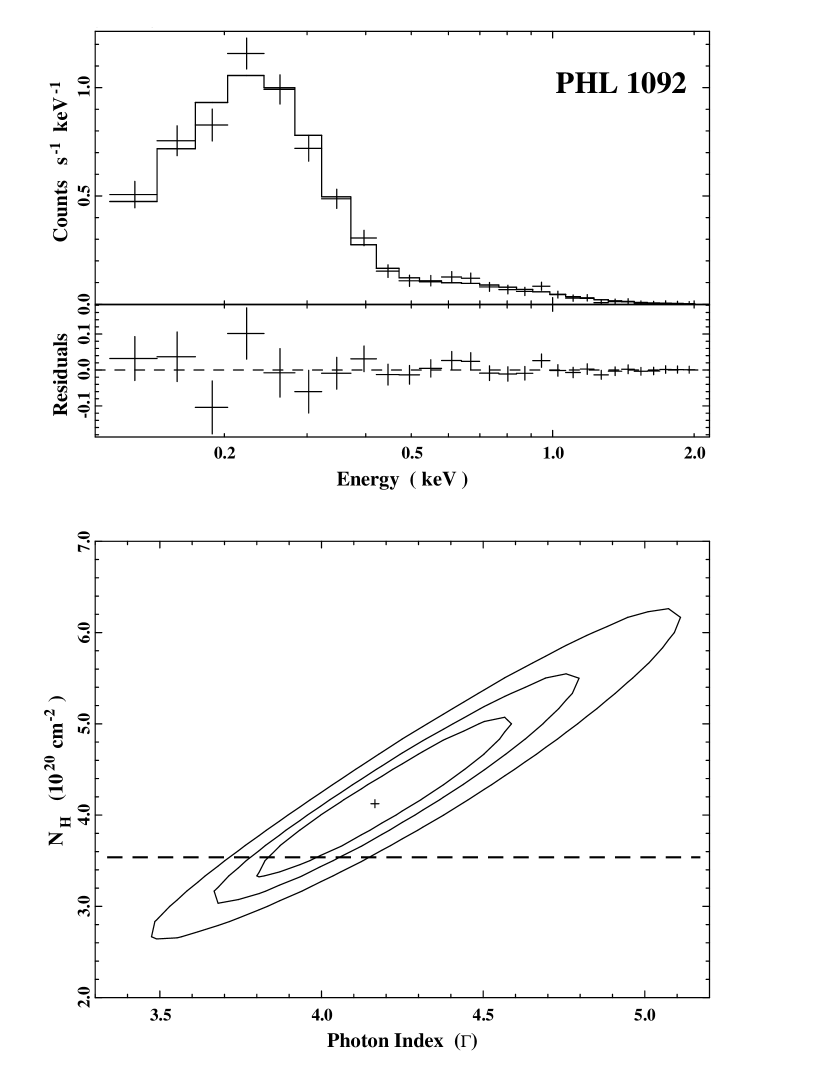
An archival ROSAT PSPC observation of PHL 1092 was reduced in the standard way using the PROS version 2.3 X-ray analysis package and XSPEC for spectral fitting. A summary of the observation is presented in Table 1. Only counts in Pulse Invariant (PI) channels 0.11–2.01 keV were used. A power law fitted the spectrum very well, with photon index (90% confidence), luminosity (5.4 ) erg s-1 and consistent with the Galactic 21 cm value (Murphy et al. 1996). Although this spectrum is very steep, it is not unusual for the NLS1 class (Boller et al. 1996; Forster 1996). Figure 1 shows the fitted PSPC spectrum of PHL 1092, the residuals from the power-law fit, and the confidence contours of the fitted parameters. Other simple models, such as blackbody or thermal bremsstrahlung, significantly underpredicted the Galactic . Blackbody plus power-law and bremsstrahlung plus power-law models did not improve on the single power-law fit, and more complicated models were not justified by the results of an test. The rapid X-ray variability of PHL 1092 during the observation rules out the possibility of a thermal bremsstrahlung component providing the bulk of the X-ray luminosity (see §3.2).
| TABLE 1 | ||||
| PSPC OBSERVATION OF PHL 1092 | ||||
| Observational details Power-law modela | ||||
| 4.17 | ||||
| (ph cm-2 s-1 keV-1) | (2.52 ) | |||
| 0.396 | (cm-2) | (4.13 ) | ||
| (cm | () | () | 0.541 (25) | |
| Date | 1992 Jan 19–22 | (ergs cm-2 s | ||
| Tobs (s) | 7613 | (ergs s | (5.42 ) | |
| Counts s | 0.283 0.008 | |||

Figure 2 shows the light curve of this PSPC observation, which is spread over three days. There was a highly significant increase in flux by a factor of 4 sometime during the intial two-day period, followed by a decrease of about 20% in 6000 s, albeit at a lower level of significance. Small changes in the hardness ratio possibly occurred as well. Because the luminosity is so large, ergs s-1, these X-ray variations stretch the limits that can be achieved by an isotropic source powered by accretion onto a non-rotating black hole as expressed by the relation (Fabian 1979; Fabian & Rees 1979), where is the time scale and the amplitude of variability. The required radiative efficiency would be for the initial (unresolved) increase by a factor of 4, and possibly as high as 0.61 if the subsequent variation in 6000 s is real. Values of larger than 0.057, the limit for an accretion disk in the Schwarzschild metric, require either accretion onto a Kerr black hole, or modification of the assumptions implicit in the Fabian-Rees relation, for example invoking anisotropic emission. The addition of a blackbody of temperature eV to the power-law model, although not justified statistically by an test, reduces the X-ray luminosity to ergs s-1, but this still requires the radiative efficiency to exceed 0.062 for the initial increase. The blackbody plus power-law model is very poorly constrained. The 90% confidence limit on the parameters of the single power-law model indicate a similar lower limit to the X-ray luminosity, ergs s-1.
In addition to its rapid variability, PHL 1092 was a much brighter ROSAT X-ray source than would have been expected from the weak Einstein IPC detection in July 1979. In a 6389 s IPC observation, only counts were collected, corresponding to a probable keV luminosity of ergs s-1 (Wilkes et al. 1994). Although part of the factor of discrepancy between the Einstein and ROSAT peak luminosities is undoubtedly due to the extremely steep spectral index of PHL 1092 and the different bandpasses of the two instruments, the Einstein count rate is still a factor of 21 smaller than would be predicted by folding the ROSAT fitted spectrum through the IPC response (using PIMMS, see Table 2).
3 Discussion
3.1 Long-term Variability
Long-term X-ray variability by more than a factor of 10 is rare among AGNs, and the most dramatic examples seem to be members of the I Zw 1 class. Table 2 is a compilation of such reports from the recent literature, involving intercomparisons among HEAO 1, Einstein, EXOSAT, and ROSAT. All but E1615+061 satisfy the I Zw 1 definition. We have also added the narrow-line QSO PG 1404+226 (FWHM H = 880 km s-1, Fe 2/H =1.01, Boroson & Green 1992) based on the ROSAT data of Ulrich & Molendi (1996), which indicates a brightening by a factor of 13 from the Einstein flux (assuming the PSPC photon index of 3.57 applies to both observations). One case we have not included is that of PG 1211+143, as we could not verify the claim of Yaqoob et al. (1994) that the ROSAT X-ray flux from this narrow-line QSO increased by a factor of 16 since the Einstein observations. Instead, we find that for the steep ROSAT PSPC spectrum (, Forster 1996), which is
| TABLE 2 | |||||
|---|---|---|---|---|---|
| LONG-TERM X-RAY VARIABILITY IN AGNs | |||||
| Name | Date | Counts s-1 | Date | Counts s-1 | |
| (0.16 – 3.5 keV) | (0.1 – 2.0 keV) | ||||
| PHL 1092 | 1979 July | 1992 Jan | 0.28 | 20.9 | |
| PG 1404+226 | 1981 Jan | 1991 July | 0.63 | 13.1 | |
| RASS | |||||
| Name | Date | Counts s-1 | Date | Counts s-1 | |
| WPVS 007 | 1990 Nov | 0.98 | 1993 Nov | ||
| IC 3599 | 1990 Dec | 4.90 | 1991 Dec | ||
| HEAO 1 A-2 | |||||
| Name | Date | (ergs s-1) | Date | (ergs s-1) | |
| E1615+061 | 1977 Aug | 1985 July | |||
similar to the Einstein IPC result ( in PHA channels 1–6 only, Bechtold et al. 1987), the change in intrinsic luminosity in this object is only a factor of 3.
The mechanism of the extreme X-ray variability remains unknown. Although part of the reason for such dramatic variability in steep-spectrum objects could be changes in spectral shape that move the bulk of the bolometric luminosity in and out of the observed bandpasses (e.g. the tail of an accretion disk spectrum, Marshall et al. 1996), there is no strong evidence that this is a sufficient or general explanation. The spectrum of IC 3599 was steeper in its low state (Brandt et al. 1995; Grupe et al. 1995a), while the opposite was the case for E1615+061 (Piro et al. 1988). The object with the largest amplitude of variability, WPVS 007, showed no significant change in hardness ratio (Grupe et al. 1995b). A decrease in the H luminosity of IC 3599 by a factor of 10 in less than a year (Mannheim et al. 1996) is perhaps independent evidence that the total ionizing luminosity of this object does vary by a large factor. On the other hand, there were no significant changes in the optical continuum flux or Fe 2 line intensities in PHL 1092 between optical spectra coincidentally taken in 1979 August (Bergeron & Kunth 1980, 1984) one month after the Einstein observation, and in 1992 September (Kwan et al. 1995) eight months after ROSAT observed the QSO in its X-ray high state.
3.2 Rapid Variability
The study of rapid X-ray variability in AGNs has a long tradition (e.g. Barr & Mushotzky 1986; Feigelson et al. 1986; Green, McHardy, & Lehto 1993; Mushotzky, Done, & Pounds 1993; Papadakis & Lawrence 1995). The most extreme cases of variability outside of blazars are again seen in I Zw 1 objects. Examples are given in Table 3, in which the first four entries are I Zw 1 objects, and the last two are blazars. IRAS 13224–3809 varied by a factor of 2 on time scales of 800 s (Boller et al. 1993), and the QSO PKS 0558–504 (M, Remillard et al. 1986) showed a hard X-ray flare with a rise time of 180 seconds during a Ginga observation in 1989 (Remillard et al. 1991). These two objects have strong, narrow Fe 2 emission lines (Fe 2/H = 1.83 and 1.56, FWHM H = 650 and 1500 km s-1, respectively, for IRAS 13224–3809 and PKS 0558–504), and the ROSAT spectrum of IRAS 13224–3809 is also very steep (, Boller et al. 1993).
| TABLE 3 | |||||
|---|---|---|---|---|---|
| RAPID CHANGES IN X-RAY LUMINOSITY | |||||
| Name | Instrument | L | t | Reference | |
| (ergs s-1) | (s) | ||||
| PHL 1092 | 6000 | 0.61 | 1 | ||
| ” | 0.13 | 1 | |||
| IRAS 13224–3809 | 800 | 0.09 | 2 | ||
| PKS 0558–504 | 180 | 1.6 | 3 | ||
| 3C 279 | 2700 | 1.45 | 4 | ||
| H 0323+022 | 30 | 25 | 5 | ||
Estimated lower limits on the efficiency implied by the observed variations in X-ray flux are also given in Table 3. The observed X-ray variability in PHL 1092 is not the most rapid seen among AGNs but it is unusual in an object of such high X-ray luminosity. This has implications for the assumptions usually made about the accretion process and the generation of X-rays from the inner regions of an accretion disk. The Fabian-Rees relation assumes that the flux released from conversion of mass to energy is isotropically emitted from a spherically symmetric, homogeneous region where no bulk relativistic motions occur, while the upper limit of 0.057 for the efficiency applies to the particular case of a thin accretion disk around a non-rotating black hole. In PHL 1092 and similar objects, it is likely that either the radiation is emitted anisotropically, or the accretion disk extends to smaller radius as a result of rotation of the black hole.
Blazars also show rapid variability and high X-ray luminosity, and many models of their broad-band energy distribution invoke bulk relativistic motion of the emitting plasma. It is much less compelling to apply such a model to I Zw 1 objects, as their similarity to blazars doesn’t extend much past their X-ray variability. I Zw 1s are generally radio quiet, are weakly polarized in the optical (Goodrich 1989), and have strong optical emission lines. The rapid response of the Balmer lines to the ionizing continuum in IC 3599 (Mannheim et al. 1996) indicates that dense emission-line clouds can indeed exist close to the nucleus in these objects, and argues against the hypothesis that a steep X-ray spectrum destroys the emission-line clouds through the lack of a two-phase photoionization equilibrium (Guilbert, Fabian, & McCray 1983).
3.3 Narrow-Line Seyferts and QSOs as a Class
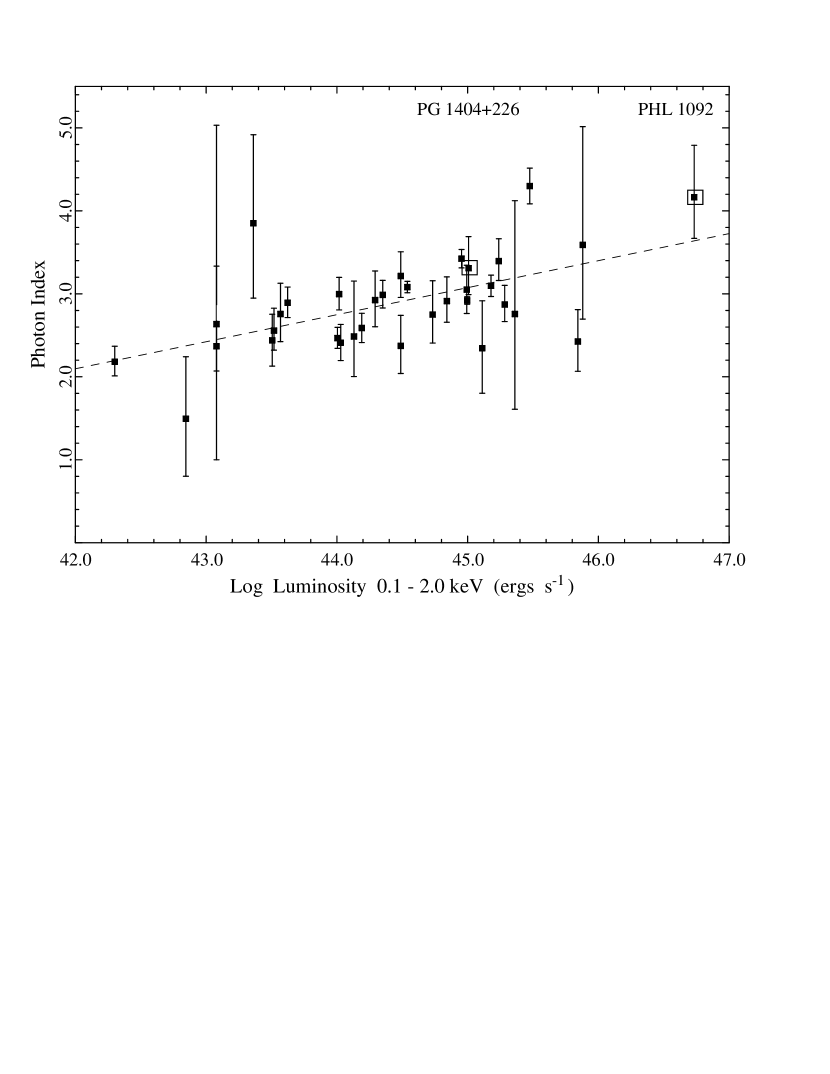
While analyzing the ROSAT spectra of a large sample of optically selected I Zw 1 objects, we discovered a significant ( 99% probability) correlation between their intrinsic soft X-ray luminosity and their X-ray spectral slope. This correlation is presented in Figure 3; the data are discussed in detail by Forster (1996). The correlation exists across four orders of magnitude in X-ray luminosity and is highly significant even if PHL 1092 is excluded from the sample. The position of PHL 1092 in this diagram argues for it to be regarded as a high-luminosity but otherwise typical member of the I Zw 1 class. The rather shallow dependence of the photon index over many orders of magnitude in luminosity argues for a weak dependence of spectral shape on some fundamental parameter, possibly the mass of the black hole.
Another interesting question involves the relationship between the objects discussed here and the elusive “type 2 QSOs” (high-luminosity counterparts of Seyfert 2 galaxies). Independent of any orientation-dependent unification schemes, their small [O 3]/H ratios,
rapid X-ray variability, and lack of X-ray obscuration disqualify the I Zw 1 objects as luminous Seyfert 2s. Neither does it seem likely that they are the “pole-on” parent population of Seyfert 2 galaxies in unification models, because the majority of hidden Seyfert 1 galaxies revealed in polarized light do not have strong permitted Fe 2 lines (Tran 1995), while Fe 2 emission is a hallmark of the I Zw 1 class.
It remains, then, to ask if there are any high-luminosity counterparts of Seyfert 2 galaxies. Limiting the discussion to X-ray sources, we are aware of only four such candidates. The oft-mentioned Einstein source 1E 0449–184 (, Stocke et al. 1982) is not a secure example because its classification is based solely on the absence of broad H. Its H line has never been examined, and its Mg 2 line does appear to be broad (Stocke et al. 1983). A more recent candidate, IRAS 20181–2244 (, Elizalde & Steiner 1994), selected from the ROSAT All-Sky Survey, was subsequently shown with better spectroscopy to be a I Zw 1 object (Moran et al. 1996), and not even the most luminous one among 20 similar objects in that survey. The latest candidates are the ROSAT source RX J13434+0001 at (Almaini et al. 1995), and an source at (AX J08494+4454, Ohta et al. 1996), but their faintness and high redshift do not yet allow evaluation in comparable detail to that of the better studied low-redshift objects. A fifth candidate, the hyperluminous IRAS galaxy P09104+4109 (), was at first thought to be the most luminous hidden AGN in X-rays based on its spectrum from (Fabian et al. 1994). However, a subsequent HRI image showed that the bulk of the X-ray emission is extended, and probably all originates in a massive cooling flow (Fabian & Crawford 1995). So while there are many ultraluminous IRAS galaxies with optical spectra like Seyfert 2 galaxies, there is little, if any, evidence that they are luminous X-ray sources. In any case, it appears that QSOs of the I Zw 1 class must be more numerous than any “type 2 QSOs.”
Finally, one of the oldest unsolved mysteries in the study of AGNs is the “Fe 2 problem”. Photoionization models cannot account for the Fe 2/H ratio in those objects in which it is largest. Consequently, mechanical sources of heating have been postulated. Kwan et al. (1995) recently proposed a scenario for PHL 1092 in which Fe 2 (and Fe 1) emission is produced in an accretion disk at low temperature by the dissipation of orbital energy as the material is forced to corotate with magnetic field lines tied to a Kerr black hole. Quite independently, we find evidence from the X-ray variability of PHL 1092 and similar objects that a Kerr black hole may be needed to account for their high efficiency. For this proposed link to be consistent, however, the Fe 2 emitting region in the outer disk must be largely shielded from view of the luminous photoionizing source at the nucleus.
4 Summary
We analyzed the ROSAT PSPC observation of the luminous Fe 2 QSO PHL 1092, and conclude that it deserves to be classified as a luminous narrow-line Seyfert 1 galaxy for the following reasons:
1) Its optical emission-line spectrum conforms with the NLS1 classification (Osterbrook & Pogge 1985; Goodrich 1989).
2) Its soft X-ray spectrum is extremely steep, with photon index , very similar to the spectrum of the NLS1 IRAS 13224–3809.
3) The large amplitude variability of its X-ray emission over long time scales is similar to that of WPVS 007 (Grupe et al. 1995b) and PG 1404+226, both of which are NLS1s with ultra-soft X-ray spectra and strong Fe 2 emission.
4) Its rapid X-ray variability requires high efficiency, similar to the behavior of IRAS 13224–3809, and especially PKS 0558–504, which are also I Zw 1 objects.
We also found a correlation between X-ray spectral index and X-ray luminosity which may eventually help to constrain models of accretion in I Zw 1 objects. The possibility that rotating black holes may be implicated in the explanation of both the unusual X-ray and optical properties of this class is suggested.
Acknowledgements.
This work was support by NASA grant NAG 5-1935 and has made use of the NASA/IPAC Extragalactic Database (NED) which is operated by the Jet Propulsion Laboratory, California Institute of Technology, under contract with the National Aeronautics and Space Administration. This research has also made use of data obtained through the High Energy Astrophysics Science Archive Research Center Online Service, provided by the NASA-Goddard Space Flight Center. This paper is contribution No. 587 of the Columbia Astrophysics Laboratory.References
- (1)
- (2) Almaini, O., Boyle, B.J., Griffiths, R.E., Shanks, T., Stewart, G.C., & Georgantopoulos, I. 1995, MNRAS, 277, L31
- (3)
- (4) Bechtold, J., Czerny, B., Elvis, M., Fabbiano, G., & Green, R.F. 1987, ApJ, 314, 699
- (5)
- (6) Barr, P., & Mushotzky, R.F. 1986, Nature, 320, 421
- (7)
- (8) Bergeron, J., & Kunth, D. 1980, A&A, 85, L11
- (9)
- (10) Bergeron, J., & Kunth, D. 1984, MNRAS, 207, 263
- (11)
- (12) Boller, Th., Trümper, J., Molendi, S., Fink, H., Schaeidt, S., Caulet, A., & Dennefeld, M. 1993, A&A, 279, 53
- (13)
- (14) Boller, Th., Brandt, W.N., & Fink, H. 1996, A&A, 305, 53
- (15)
- (16) Boroson, T.A., & Green, R.F. 1992, ApJS, 80, 109
- (17)
- (18) Brandt, W.N., Fabian, A.C., Nandra, K., Reynolds, C.S., & Brinkman, W. 1994, MNRAS, 271, 958
- (19)
- (20) Brandt, W.N., Pounds, K.A., & Fink, H. 1995, MNRAS, 273, L47
- (21)
- (22) Elizalde, F., & Steiner, J.E. 1994, MNRAS, 268, L47
- (23)
- (24) Fabian, A.C. 1979, Proc.Roy.Soc.London Ser A, 366, 449
- (25)
- (26) Fabian, A.C., & Rees, M.J. 1979, in X-ray Astronomy, Proc. COSPAR Symp. (Oxford:Pergamon Press)
- (27)
- (28) Fabian, A.C., et al. 1994, ApJ, 436, L51
- (29)
- (30) Fabian, A.C., & Crawford, C.S. 1995, MNRAS, 274, L63
- (31)
- (32) Feigelson, E.D., et al. 1986, ApJ, 302, 337
- (33)
- (34) Forster, K. 1996, in preparation
- (35)
- (36) Goodrich, R.W. 1989, ApJ, 342, 224
- (37)
- (38) Green, A.R., McHardy, I.M., & Lehto, H.J. 1993, MNRAS, 265, 664
- (39)
- (40) Grupe, D., Beuermann, K., Mannheim, K., Bade, N., Thomas, H. -C., de Martino, D., & Schwope, A. 1995a, A&A, 299, L5
- (41)
- (42) Grupe, D., Beuerman, K., Mannheim, K., Thomas, H.-C., Fink, H.H., & de Martino, D. 1995b, A&A, 300, L21
- (43)
- (44) Guilbert, P.W., Fabian, A.C., & McCray, R. 1983, ApJ, 266, 466
- (45)
- (46) Halpern, J.P., & Oke, J.B. 1987, ApJ, 312, 91
- (47)
- (48) Kwan, J., Cheng, F.-Z., Fang, L.-Z., Zheng, W., & Ge, J. 1995, ApJ, 440, 628
- (49)
- (50) Makino, F., et al. 1989, ApJ, 347, L9
- (51)
- (52) Mannheim, K., Grupe, D., Beuermann, K., Thomas, H.-C., & Fink, H.H. 1996, in Proc. Röentgenstrahlung from the Universe, Würzburg, Germany
- (53)
- (54) Marshall, H.L., Carone, T.E., Shull, J.M., Malkan, M.A., & Elvis, M. 1996, ApJ, 457, 169
- (55)
- (56) Moran, E.C., Halpern, J.P., & Helfand, D.J. 1996, ApJS, in press
- (57)
- (58) Murphy, E.M., Lockman, F.J., Laor, A., & Elvis, M. 1996, ApJS, preprint
- (59)
- (60) Mushotzky, R.F., Done, C., & Pounds, K. A. 1993, ARA&A, 31, 717
- (61)
- (62) Ohta, K., Yamada, T., Nakanishi, K., Ogasaka, Y., KII, T., & Hayashida, K. 1996, ApJ, 458, L57
- (63)
- (64) Osterbrock, D.E., & Pogge, R.W. 1985, ApJ, 297, 166
- (65)
- (66) Papadakis, I.E., & Lawrence, A. 1995, MNRAS, 272, 161
- (67)
- (68) Persson, S.E. 1988, ApJ, 330, 751
- (69)
- (70) Phillips, M.M. 1976, ApJ, 208, 37
- (71)
- (72) Piro, L., Massaro, E., Perola, G.C., & Molteni, D. 1988, ApJ, 325, L25
- (73)
- (74) Pounds, K.A., Done, C., & Osborne, J.P. 1995 MNRAS, 277, L5
- (75)
- (76) Remillard, R.A., Bradt, H.V., Buckley, D.A.H., Roberts, W., Schwartz, D.A., Tuohy, I.R., & Wood, K. 1986, ApJ, 301, 742
- (77)
- (78) Remillard, R.A., Grossan, B., Bradt, H.V., Ohashi, T., Hayashida, K., Makino, F., & Tanaka, Y. 1991, Nature, 350, 589
- (79)
- (80) Stocke, J., Liebert, J., Maccacaro, T., Griffiths, R.E., & Steiner, J.E. 1982, ApJ, 252, 69
- (81)
- (82) Stocke, J.T., Leibert, J., Gioia, I.M., Griffiths, R.E., Maccacaro, T., Danziger, I.J., Kunth, D., & Lub, J. 1983, ApJ, 273, 458
- (83)
- (84) Tran, H.D. 1995, ApJ, 440, 565
- (85)
- (86) Ulrich, M.H., & Molendi, S. 1996, ApJ, 457, 77
- (87)
- (88) Wilkes, B.J., Tananbaum, H., Worrall, D.M., Avni, Y., Oey, M.S., & Flanagan, J. 1994, ApJS, 92, 53
- (89)
- (90) Yaqoob, T., Serlemitsos, P., Mushotzky, R., Madejski, G., Turner, T.J., & Kunieda, H. 1994, PASJ, 46, L173
- (91)