Identification of a high redshift cluster in the field of Q2345+007 through deep BRIJK’ photometry††thanks: Based on observations collected at the Canada-France-Hawaii Telescope at Mauna Kea, Hawaii, USA
Abstract
This paper describes new results on the identification of the complex gravitational lens responsible for the double quasar Q2345+007. A gravitational shear field was detected recently about 45′′ away from the QSO, centered on an excess of faint blue galaxies. The redshift distribution is still unknown, so the mass and the photometric properties of the deflector are still a matter of debate. We present deep photometric data obtained in the near-IR (J and K’), which are used together with preexisting optical BRI photometry to build spectral energy distributions for all the objects of the field, and to derive a photometric redshift estimate by comparison with synthetic spectrophotometric data. We propose a statistical method to analyse the redshift distribution, based on the cumulative histogram of the redshift ranges allowed for the different objects. An excess of galaxies at a redshift of is clearly detected in the field of Q2345+007, with a 2D distribution showing a maximum located at the center of the weak shear field. Besides, the redshift inferred for this cluster is also compatible with that found for an absorption system in the spectrum of the B component of the quasar. We interpret this overdensity of objects as a distant cluster of galaxies responsible for the gravitational shear field. Two other redshift concentrations are studied: which corresponds to the spectroscopic redshift of three galaxies but for which no strong excess of objects is identified, and , where an excess of galaxies is also detected, but with a rather smooth 2D distribution over our field of view. We also discuss the existence of other possible excesses of galaxies at redshift planes compatible with the absorption systems detected in the spectra of the QSOs. Most cluster-member candidates at are undergoing a star-formation process or are burst systems where the star formation stopped between 1 and 3 Gyr ago.
Key words: Galaxies: clustering – Quasars: general – – Cosmology: observations – dark matter – gravitational lensing
1 Introduction
Since its discovery (Weedman et al. 1982), the nature of the double quasar Q2345+007 has been a controversial matter. The spectra of both quasars and their redshifts are very similar (), therefore the gravitational lensing hypothesis was suggested at once (Foltz et al. 1984). The distance between the two quasars is , a value so high to be explained by a single galaxy deflector that Subramanian & Chitre (1984) suggested a double lens model. The best model they found was that of a galaxy in the central part of a cluster at a redshift close to 1. Nevertheless, the first deep visible images of the field did not show any trace of a lens candidate around the two images of the QSO (Tyson et al. 1986). This negative result leaded Tyson et al. to conclude that the mass to light ratio for the lens might be at least 1000, a value which is compatible with the hypothesis of a massive halo of dark matter suggested by Narayan et al. (1984). Conversely, Steidel & Sargent (1990) and Weir & Djorgovski (1991) concluded that the double quasar is probably a physical pair. Nevertheless, after a careful analysis of both spectra, Steidel & Sargent (1991) showed that they are really similar in many respects (the redshift, the emission lines as well as the absorption lines) and they definitely favour the gravitational lens hypothesis. Besides, the metal absorption systems identified in both spectra, at redshifts ranging from to , allow to suspect the presence of lens candidates at these redshifts. The close neighbourhood of the quasar was also studied in the near IR, up to a magnitude , in a recent paper by McLeod et al. (1994), but the detection of a lens candidate was still negative.
All the works reviewed before to search for the lens deflector assume implicitely that the main deflector must be located close to the two QSO images. In a different approach, Bonnet et al. (1993) reported the detection of a shear field due to the weak gravitational distortion of the background sources by a mass distribution compatible with that of a cluster of galaxies. Its center is located about away from the double QSO, close to two bright galaxies identified at a redshift of . Moreover, several arclets candidates were also identified, reinforcing the hypothesis of a strong deflecting mass. Deeper optical imaging confirmed the suspected excess of faint blue galaxies associated with the lens (Mellier et al. 1994, Fischer et al. 1994). All these authors argued that its redshift could be higher than 1 because of the low surface brightness and color indices, and even as large as 1.5 if the excess is associated with the absorbing systems of the QSOs. But a precise value for the redshift cannot be inferred from their observations. A secondary small clump of blue galaxies was found close to the double quasar. As there are absorption lines in the spectra of both quasars at , this value for the redshift was considered as the most convincing one.
The galaxies in excess in the field of Q2345+007 are so faint that they are hardly observable in spectroscopic mode, and the redshift estimate of the deflecting agents is still a matter of debate. In this paper, we propose a different approach by using deep near-IR J and K’ photometry of the field in complement of the existing deep B,R and I photometry. We show that from this spectral information, which covers a wide wavelength range, and a careful analysis of the photometric errors, it is possible to infer a more constrained photometric redshift for each object in the field. The observed spectral energy distribution (hereafter SED) is compared with the predictions for different redshifts and spectromorphological types of galaxies. If detectable, a cluster along the line-of-sight must appear as an excess of objects at a particular value of the redshift distribution with respect to an empty field. A discussion about the properties and limits of such a photometric-redshift technique can be found in previous papers by Couch et al. (1983) and Ellis et al. (1985). Recently, Belloni et al. (1995) have applied successfully a similar photometric method to study the population of galaxies in a distant cluster at . Although the photometric redshift has limitations in the case of individual objects, we show that the method can be applied successfully to detect an excess of objects at a given redshift through a statistical analysis of the photometric redshift ranges allowed for the different objects in the field. This is the basic principle of the method we apply on the field of Q2345+007.
The outline of the present paper is the following. In the second section, we briefly summarize the photometric data. The data reduction and the construction of the photometric catalogue are discussed in section 3. The method of photometric redshifts is introduced and discussed in section 4, together with two illustrative examples on well-known clusters of galaxies at different redshifts. In section 5, the population of galaxies responsible for the excess in number counts at is characterized and its spatial distribution is determined. We also discuss in section 6 on the existence of other concentrations at and , as well as at the redshifts identified in the absorption spectra of the QSO. The SEDs of the arclet-candidates are studied in section 7. The final discussion and conclusions are in section 8. We give the photometry of the double quasar in appendix.
| Date | filter | Detector | Field | Exp. | FWHM | compl. | limiting | ) | |||
|---|---|---|---|---|---|---|---|---|---|---|---|
| (sec) | (′′) | (nm) | (nm) | mag. | mag. | mag/ | |||||
| 13-14-15/10/90 | BJ | RCA2 | 14500 | 1.2 | 447.8 | 142.7 | 0.82 | 27.5 | 29.0 | 28.7 | |
| 16/10/90 | R | RCA2 | 3000 | 1.4 | 645.8 | 112.4 | 0.73 | 26.2 | 26.8 | 26.6 | |
| 14-15-17/10/90 | I | RCA2 | 7200 | 1.2 | 812.8 | 126.0 | 0.45 | 25.8 | 26.2 | 26.2 | |
| 5-7/10/93 | J | NICMOS3 | 9950 | 1.2 | 1237.0 | 203.1 | 0.94 | 24.5 | 25.5 | 25.4 | |
| 6/10/93 | K’ | NICMOS3 | 4295 | 1.1 | 2103.2 | 359.5 | 0.96 | 22.8 | 23.5 | 23.1 |
2 Optical and near IR observations
Data on the field of Q2345+007 come from two different runs at the 3.6m Canada-France-Hawaii Telescope (CFHT). Optical images (BRI) were obtained in October 1990 at the prime focus of the telescope, using the CCD-RCA2 binned , with an equivalent pixel size of . Details can be found in Mellier et al. (1994) and Kneib et al. (1994). Near-IR images (JK’) were obtained at the Cassegrain focus in October 1993, with the Redeye camera set in its wide-field mode, with a pixel size of (CFH Redeye Users Manual, Simons 1993). The details of the observations are summarized in Table 1, as well as the characteristics of the photometric system used, taking into account the response of the different detectors and filters.
All the final images were obtained using the shift and add technique developped by Tyson (1988). Near-IR images were reduced with special care, as explained in next section. A standard calibration procedure was used in all the cases. In the optical range, we used the standard stars in the photometric fields given by Gullixson et al. (1995). A photometric sequence exists in the field of Q2345+007 (Tyson & Seitzer, 1988), which is especially useful after correction for color effects due to the difference between the R and I CFHT filters and the Gullixson et al. filters. In the near-IR, the calibration was done through the J and K’ standard stars given in the Redeye Users Manual (Simons 1993). We have verified that the magnitude difference K-K’ is less than 0.1 magnitudes for all the stars, a value smaller than the absolute photometric uncertainty in most cases. The seeing was reasonably good in all the runs, but the sampling of the images is poor. The FWHM given in Table 1 corresponds to the final coadded images.
3 Data reduction and photometry
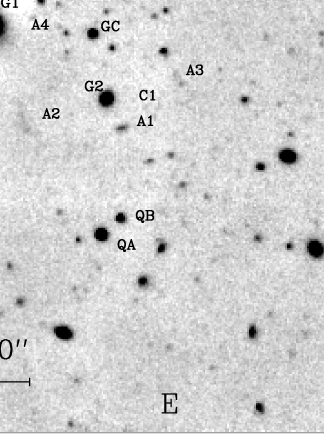
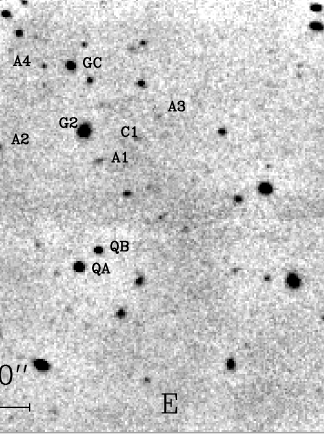
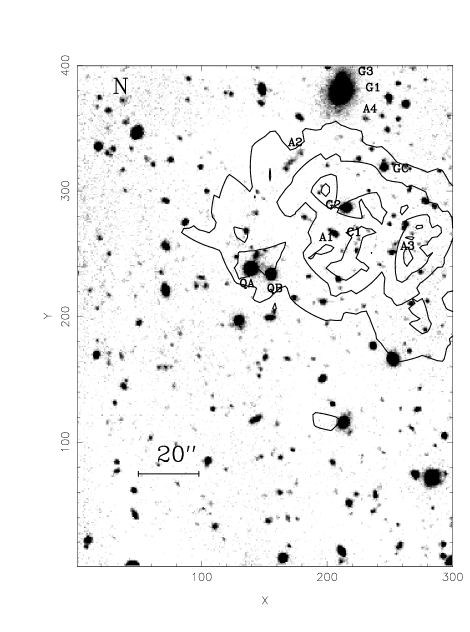
Optical images were reduced using the standard IRAF procedures for superflatfield and coaddition. In the near-IR, a particular care is necessary because of the large number of exposures (typical individual exposures are about 45 seconds in K’ and 130 seconds in J) and the sky background variations on short time scales, requiring a frequent sampling of the sky frame. As the field of Q2345+007 is almost free of bright objects, it has been used to obtain a superflatfield, and no comparison empty field was needed. A discussion about the problems associated with the near-IR reduction can be found in the Redeye Users Manual. Separate superflatfields for images with different sky levels have been built. In practice, it was necessary to perform a superflatfield with 10 to 20 successive images. After flat-fielding, the images were recentered and coadded using the IRAF facilities. The resulting J and K’ images of the field are shown in figures 1 and 2 respectivelly, with the identification of the main objects presented in this paper. A deep B image of the same field can be found in Mellier et al. (1994). The common area of the optical and the near-IR images is about , centered on the double quasar, and it largely includes the center of the shear field detected by Bonnet et al. (1993).
The photometry was obtained with the AMAPHOT package developped at the Observatoire Midi-Pyrénées. The detection of objects on the different frames is made at a level above the local sky background, with a minimum size requirement of 4 contiguous pixels above the detection limit. Since the method presented in this paper is based on the SEDs, only those objects found on at least two different filters are considered in a first step. Elliptical parameters (centroid, ellipticity and orientation) are determined for each object from the first and second order moments of the pixels within its connected domain above the detection isophote. Isophotal magnitudes are obtained by integrating the profiles computed along the major axis of the distribution up to a given limiting isophote: BJ = 28 mag/arsec2, R = 27 mag/arcsec2, I = 26 mag/arcsec2, J = 25 mag/arsec2 and K’ = 23 mag/arcsec2, values which are very close to the detection limit. The internal photometric accuracy, obtained by comparing the magnitudes coming from different individual images of the same object, is better than magnitude for and magnitude for objects with . The absolute accuracy is typically magnitudes, even for the brightest objects, when all the usual sources of error are considered (photometric absolute calibration, different sampling or seeing conditions), and it increases up to magnitude for the faintest objects of the sample.
We faced specific problems when computing color indices from our data because of the wide spectral range covered by the photometry. Colors are usually obtained from isophotal magnitudes inside a reference isophotal contour applied on all images. But, in our case, taking a given filter as the reference would produce a color-selection effect and could affect the measured color distribution. Besides, the morphology and spatial extent of an object could be quite different in two extreme filters. The important point is to integrate the flux within the same area in all the different filters, in order to obtain a SED which is a good measure of the averaged properties of the object. In order to solve this difficulty, we computed an “average” set of shape parameters for each object as described below: first, we build a sub-image corresponding to the average of all images where the object is detected, after locally recentering it in the center of the raster and normalizing. The normalisation consists on setting all the images to the same equivalent exposure-time and total transmission. Secondly, we compute for each object the averaged elliptical parameters (center, ellipticity and orientation) from the first and second order isophotal moments, as well as the mean isophotal radius along the major axis, where the limiting isophote corresponds to above the local sky value. While the mean isophotal radius is rather arbitrary, it gives a measure of the averaged size of the object and it is used only to compute the color indices. Some objects with peculiar morphologies, very different from an elliptical shape, such as the arclet-candidate A2, require a special reduction procedure. In this case, instead of fitting the shape of the object by an ellipse and to integrate it inside elliptical annuli, colors and magnitudes are calculated directly within the (irregular) isophotal limiting contours.
It is also important to verify the reliability of the SEDs derived from photometry to prevent spurious results due to color effects. In particular, this could happen when the magnitudes of the standard stars used for calibration are not exactly in the same photometric system as the observations, or when the galactic reddening is strong. This point is especially important in the near-IR where temporal variations of the sky transmission can induce color effects in the global response of the system. In order to test the quality of the photometry, we have computed the expected colors for stars in this photometric system, and we have verified that the observed sequence of stars on the different color-color planes is compatible with the prediction within the errors. The separation of stars in the field was obtained with the AMAPHOT package which provides a robust test to separate stars from galaxies efficiently up to a magnitude of (see Pelló & Vílchez-Gómez 1996 for more details). Finally, the correction for galactic reddening effects is lower than the photometric errors, and it was neglected because the galactic latitude of the field is high enough.
The final catalogue contains 849 objects (stars and galaxies) with at least one magnitude on the whole field. 559 objects with at least one magnitude are present on the field common to all the filters (about ). From this sample, 227 objects are detected in the 5 images, and 550 have at least one color index. Table 1 summarizes the photometric properties of the catalogue. The limiting magnitude defines the faint end of the magnitude distribution which contains 10 % of the whole sample of objects.
4 Multicolor analysis of the field
4.1 The method
The aim of our method is to look for an excess of objects at a given redshift along the line-of-sight. If a cluster is detectable, it will appear as a peak in the redshift distribution with respect to an empty field, and will also produce a significant excess in the 2D distribution of objects. In the case of Q2345+007, we searched for any enhancement of objects in the redshift distribution first, and then analysed the location and center of a possible excess in the 2D distribution of galaxies, as well as its significance for the gravitational lens system. Once the presence of such an excess has been established, multicolor photometry can also be used to characterize its population of galaxies. It is important to determine the 2D distribution and the spectrophotometric properties of galaxies to check if the excess corresponds to a high redshift cluster.
The first step in the method is to determine a photometric redshift range for each object from its SED, derived through BRIJK’ photometry. The SED is equivalent to a very low resolution spectrum in a large wavelength range, from 0.35 to 2.4 . Photometric redshifts are determined as the intersection of the “permitted” redshift domains coming from different color-redshift diagrams, which are calculated using the Bruzual’s code for the spectrophotometric evolution of galaxies (Bruzual & Charlot, 1993), taking into account the transmission functions of the photometric system. The IMF is that of Miller & Scalo (1979), with a lower and upper cutoff masses of 0.1 and 125.0 respectively. Throughout this paper, we assume km and . The present age of galaxies is assumed to be 15 Gyr, which corresponds to a redshift for galaxy formation of . The results obtained are almost independent from the choice of the IMF and the present age assumed for galaxies, provided that present-day ellipticals are older than 9-10 Gyr. For our purposes, the main influence of comes from the maximum age allowed to present-day ellipticals. It is easy to show that the permitted redshift domains become narrower when the spectral range is increased to the near-IR, so the individual photometric redshifts become more accurate in this case.
In practice, we used as many independent colors as possible to constrain the photometric redshift of a given object, namely the 4 colors BJ–R, R–I, I–J and J–K’ for objects detected in all the filters. For each color, a maximum (red) and a minimum (blue) curves are calculated in the color-redshift plane, which define the permitted area for any galaxy. The reddest curve is that of an old single burst of star formation, such as an old elliptical galaxy (hereafter E), and the bluest curve is that of a continuous star forming system, such as an irregular magellanic galaxy (hereafter Im). The use of filter bands from B to K’ allows to obtain simultaneously an optimal fit of short time scale phenomena (such as a burst of star formation) as well as the averaged behaviour of the system (as given by the old population of stars seen in the J and K’ filters). Each observed color is compared to the predicted color-z diagram, taking into account the photometric errors, and the permitted redshift range is obtained. The code used to compute models does not include metallicity effects on the stellar population or internal absorption effects. Nevertheless, such effects are expected to be of second order in the determination of the redshift. At a given z, any “normal” galaxy fits between the two extreme models if its spectromorphological type is let completely free. This is almost independent from the existence of emission-lines, because the SED built from broad band filters is generally dominated by the continuum and absorption features (the 4000 Å and Balmer breaks in the visible). Obviously, when we are dealing with an object whose SED is different from a normal galaxy, no photometric redshift is found. This is the case of the double quasar, for example. The final redshift range for an individual object will be narrow (about 0.1, to take into account the precision in the color-redshift diagrams in most cases) or wide depending on the number of colors available, the width and the sampling properties of the filters used and the photometric accuracy. As the color calibration accuracy has been tested on a sample of stars, the reliability of the SEDs essentially depends on the individual photometric uncertainties. In summary, even if the redshift range is wide for some individual objects, the existence of a cluster can be evidenced statistically because most objects belonging to it will be compatible with its redshift. We discuss this point below, in the case of two well known clusters of galaxies, namely A2218 and A370, where similar optical and near-IR deep photometry is available and where the result concerning the redshift is unambiguous.
4.2 A test on the clusters of galaxies A2218 and A370
In the case of A2218, a set of optical images is available in filters B, g, r and z, as well as near-IR images in the same filters as Q2345+007. Details concerning the photometry of this cluster can be found in Le Borgne et al (1992), Pelló et al. (1992) and Kneib et al. (1995). The mean spectroscopic redshift is (Le Borgne et al. 1992). The uncertainty on the redshift is intrinsic, due to the velocity dispersion of the cluster (1370km/s) and does not correspond to observational errors. A catalogue of 232 objects was obtained in the common field of all the filters, excluding objects identified unambiguously as stars. The automatic procedure has given a photometric redshift interval for 182 of them ( of the sample). Figure 3a shows the redshift distribution, where all the permitted redshift intervals have been cumulated with a weight of 1. A significant excess of galaxies at a mean redshift of can be seen. The error bar is a measure of the FWHM of the peak around the mean value. This result is fully compatible with the spectroscopic value. The photometric redshift matches perfectly the spectroscopic result (Le Borgne et al. 1992) for 85 % of the objects for which J and K’ photometry is available. This is the case of the arcs at and , for which the automatic procedure has found a photometric redshift between 0.825 and 1.1 for the former and between 0.650 and 0.725 for the later. A significant secondary and wider peak exists around , due to the distribution of the background population of galaxies. A significant contribution is expected from the many bright arclets observed in this field. No comparison blank field, obtained in the same conditions and filters as the cluster, is available in this case to properly estimate the field contamination, but the contrast cluster-field is high enough to detect the excess.


In the case of A370, the photometry is available in the same filters and has been obtained during the same runs and under the same conditions as for Q2345+007. The mean spectroscopic redshift is (see Mellier et al., 1988, and Soucail et al., 1988, for more details about the spectroscopic survey on this cluster). The catalogue of the field common to all the filters contains 345 objects, and the automatic procedure has given a photometric redshift interval for 252 of them ( of the sample). The raw redshift distribution, obtained in the same way as in A2218, is shown in figure 3b. The excess of galaxies is at a mean redshift of , so it is roughly in agreement with the spectroscopic value, although slightly higher, and the peak obtained is wide. The comparison blank region defined below in Sect. 5.1 (field 2) was used to estimate the field contribution by subtraction. The redshift distributions in the cluster and the blank fields are shown in figure 3c, after correction for the different sizes of the two regions. The two catalogues used to compute the redshift distributions have been limited within the magnitude of completeness in all the filters and, when this magnitude is different in the two fields, the limit is given by the brightest of them. The final catalogues contain 193 and 50 objects respectively in the cluster and the blank field, and about of them have a redshift interval assigned. The net excess of galaxies in the field of A370 is then at a mean redshift of . 80 % of the objects for wich a spectroscopic redshift exists (according to Soucail et al., 1988) are correctly identified photometrically. This is the case of the giant arc at , for which the automatic procedure has found a photometric redshift .
The maximum peak obtained in A2218 is quite narrow compared to that found in A370 and there are two reasons for this. First, the redshift of A2218 is low, so the photometry is more accurate because the objects are brighter in average and the SEDs show a low internal dispersion in redshift and spectromorphological types. Secondly, the more important spectral feature in the visible range at such intermediate redshifts is the discontinuity, and many narrow optical filters are available in the field of A2218 to map the SEDs around this wavelength region. Figure 4 shows the difference between the spectroscopic and the photometric redshift as a function of the magnitude for different objects in the fields of A2218 and A370. There is no clear evidence for an increase of errors as a function of the magnitude. It is worth noting that the contrast between the cluster and the field increases when the near-IR photometry is available, and this effect is mainly due to the narrowing in the individual permitted redshift ranges. The mean photometric redshift obtained for A370 is higher than the spectroscopic value and the fit is worse compared to A2218. A straightforward simulation shows that such a systematic bias towards higher redshifts is expected for E-type galaxies at when the filters BRIJK’ are used, and it disappears beyond . The effects of sampling along the SEDs on the inferred redshift distribution will be studied in details in a forthcoming paper (Miralles et al., in preparation).


5 Detection and characterisation of a cluster of galaxies at z 0.75
5.1 Detection of excesses of galaxies at different redshift planes
The method presented above was applied to the catalogue of 550 objects with at least one color on the common field of Q2345+007. The automatic procedure enabled to calculate a permitted redshift range for of them, and the cumulative histogramme for the redshift distribution has been obtained using the same method as in Sect. 4. The contrast of a possible high redshift cluster with respect to the normal distribution for a blank field is expected to be lower than for A2218 or A370, because the field contamination strongly increases at faint magnitudes. In order to estimate this contamination, two regions of about the same surface have been defined by dividing the whole field in two halves: one contains the double QSO and the excess of galaxies already detected by Mellier et al. (1994) (field 1), and the other one is considered as an “empty” comparison region (field 2). The completeness magnitudes in the fields 1 and 2 are the same in all the filters. We can check on the excess of galaxies in the field of the double QSO through galaxy counts. Even if the contrast between field 1 and the blank is expected to be low, it is interesting to compare the present results with those found previously by other authors. Table 2 gives the results on the BJ and K’ galaxy counts in the two fields, compared to those already obtained by Tyson (1988) in BJ, and Djorgovski et al. (1995) and Gardner et al. (1993) in K’. Our results have not been corrected for incompleteness, so they only compare to those found in the literature up to the completeness magnitudes. In general, the present results are in agreement with those found previously within the errors. There is an excess in K’ compared to Djorgovski et al. (1995) at the faintest magnitudes, in the two fields, but there is no clear evidence for an excess in field 1 compared to the blank.
The superposition of the raw distributions in redshift in the two regions are shown in figure 5a, and the net distribution in the field 1, obtained by subtraction, is given in figure 5b. A clear narrow peak appears at and a wider one at , as well as a secondary wide peak at . All these peaks correspond to excesses of galaxies in the 2D distribution, with different levels of significance, as explained below. The first one is identified as a cluster at , as it is discussed below. The redshift of this excess is fully compatible with the absorption system detected in the spectrum of the B component of the quasar, a first evidence in favour of a lens at such a redshift. The second peak at does not correspond to any absorption system of the quasar. The third peak centered at is the widest and the less significant (the maximum contrast in the redshift distribution is about ), but it contains the other absorption systems identified by Steidel and Sargent (1991) in the spectra of the QSOs, between to . Most galaxies compatible with the two high-redshift peaks lie beyond the completeness limit in at least one filter, as it is shown in figure 5b, hence the conclusions concerning their 2D distribution have to be taken with caution. More detailed results concerning the two higher redshift-strips can be found in next section.


| Filter BJ | ||||||||
|---|---|---|---|---|---|---|---|---|
| Mag | N | Log N/mag/deg2 | N | Log N/mag/deg2 | N | Log N/mag/deg2 | Log N/mag/deg2 | |
| all | field 1 | field 2 | Tyson (1988) | |||||
| 22.50 | 8 | 3.570.15 | 2 | 3.540.31 | 2 | 3.570.31 | 3.6 | |
| 23.50 | 27 | 4.100.08 | 4 | 3.840.22 | 4 | 3.870.22 | 4.10 | |
| 24.50 | 57 | 4.420.06 | 17 | 4.460.10 | 12 | 4.350.12 | 4.55 | |
| 25.50 | 102 | 4.680.04 | 37 | 4.800.07 | 21 | 4.590.09 | 4.70 | |
| 26.50 | 90 | 4.620.05 | 22 | 4.580.09 | 32 | 4.770.08 | ||
| 27.50 | 205 | 4.980.03 | 71 | 5.090.05 | 61 | 5.050.06 | ||
| Filter K’ | ||||||||
| Mag | N | Log N/mag/deg2 | N | Log N/mag/deg2 | N | Log N/mag/deg2 | Log N/mag/deg2 | |
| all | field 1 | field 2 | (1) Gardner et al. (1993) | |||||
| (2) Djorgovski et al. (1995) | ||||||||
| 18.50 | 14 | 4.100.12 | 6 | 4.010.18 | 7 | 4.110.16 | 3.970.07 (1) | |
| 19.50 | 22 | 4.300.09 | 5 | 3.930.19 | 16 | 4.470.11 | 4.250.06 (1) | |
| 20.50 | 38 | 4.530.07 | 15 | 4.410.11 | 20 | 4.570.10 | 4.520.13 (2) | |
| 21.50 | 47 | 4.630.06 | 28 | 4.680.08 | 19 | 4.550.10 | 4.600.12 (2) | |
| 22.50 | 166 | 5.170.03 | 82 | 5.150.05 | 82 | 5.180.05 | 4.910.08 (2) |
5.2 Structural properties of the cluster-lens
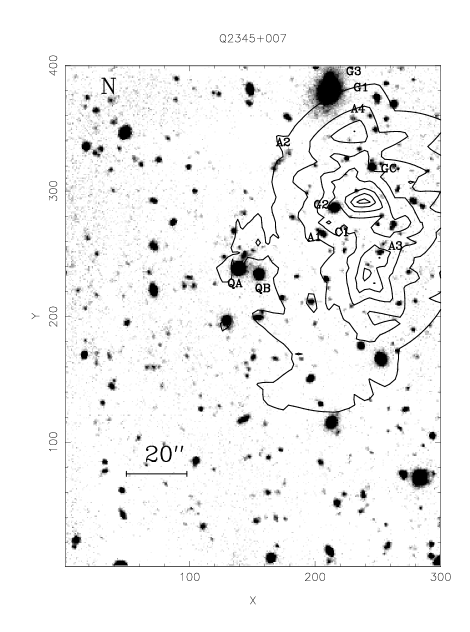
The next step is to study the 2D distribution of objects with a permitted redshift interval which contains . The projected number and luminosity densities of such objects were computed through a method similar to that proposed by Dressler (1980). Figure 6 shows the isocontour plot corresponding to the distribution in projected number-density, where a clear maximum appears close to galaxy G2. The mean density of objects compatible with is 13.6 galaxies/arcmin2 up to the completeness magnitude in BJ, and the maximum value reaches 4.1 times the mean density. The contrast in density, defined as , where , is 11.6. The size of the region where the density is higher than 2.5 times the mean value is about ( kpc at ). The total number of galaxies compatible with within a circular region of this diameter is 14, whereas only 6 were expected according to the mean density of such galaxies over the whole field (field 1 field 2), so the contrast is about . The results in number-density are similar when we consider objects within the completeness magnitude in J. The maximum in projected number-density given by the Dressler’s method lies as expected between the two clumps reported by Mellier et al. (1994, Fig. 1), and its distance to the center of the weak-shear field is about West (see figure 6). The location of the projected number-density peak is also in good agreement with the excess detected by Fischer et al. (1994), and it is also compatible with the position of the lens responsible for the weak-shear field found by Bonnet et al. (1993).
The 2D distributions in luminosity-density in BJ and J are also very similar for the sample of galaxies within . The position of the maximum is the same in both filters, and it lies less than northwards from the maximum in projected number-density. The maximum values in BJ and J up to the completeness magnitudes are, respectively, 4.6 and 4.1 times the mean luminosity-densities in these filters, the mean values beeing / arcmin2 in BJ and / arcmin2 in J at (raw data, no k-correction is applied). A final remark afterwards is that the size of the whole field studied (field 1 + field 2) is about 1 Mpc wide at , so field 2 is not expected to be an empty region at such a redshift, and the contrast found is then a lower limit. In fact, an excess at this redshift is already visible in the raw data presented in figure 5a.
5.3 Photometric properties of the cluster-lens
There are 80 objects detected on the whole field (field 1 field 2) within a permitted redshift interval which contains . The distribution of all these galaxies on color-magnitude and color-color diagrams are presented in figures 7a and 7b, respectively. Galaxies identified as belonging to other possible redshift systems are also plotted for comparison. The look-back-time at is 8.15 Gyr, so galaxies are 6.85 Gyr old. A detailed discussion about the dominant stellar population in the two extreme star-forming systems used can be found in Bruzual & Charlot (1993). At , the main spectral absorption feature expected in the visible range is the 4000 Å discontinuity, which lies between the central wavelengths of the filters R and I. Nevertheless, these filters are so broad that the R-I color index alone is unable to discriminate between foreground (beyond ) and background objects (up to ), when the spectromorphological type of the galaxies is let completely free. The determination of the redshift has been possible only because we have strong constrains on the whole continuum from BJ to K’ for most objects in the field.
Concerning the general evolutionary trends, the filter BJ is very sensitive to short-scale star-forming phenomena. The J band maps the restframe from 6000 to 8200 Å, so it is very sensitive to the present main-sequence (MS) population of stars, regardless of the star-formation history and for a relatively wide range of redshifts around 0.75. A similar comment can be applied to the I band, which samples the restframe wavelength just after the 4000 Å break: it is also dominated by MS stars but it is more sensitive to the redshift because, beyond , the 4000 Å break lies inside the filter. Then, with some cautions concerning the redshift and the metallicity, the color I-J can help in constraining the age of the dominant stellar population. On the contrary, the K’ band samples the restframe at , which is dominated by red giant or core He burning low-mass stars (depending on the past star-formation history), so it is almost insensitive to the present star-formation rate and it puts some constraints on the past star-forming history. The results on the sample at evidence that most objects have been undergoing an active star-formation activity in a recent epoch, because they show R-I and I-J colors compatible with those of a continuous star-forming system, or with those of a young burst of star-formation (younger than 3 Gyr in most cases). According to their BJ-R, about 50% of them seem to be continuous star-forming systems, whereas the others are more likely young burst systems where the star-formation stopped 1 to 3 Gyr ago. Only two objects have red SEDs in these filter-bands, compatible with those of an old E-type system. Moreover, about 50% of these star-forming objects are red in the J-K’ distribution and show an enhanced flux in the K’ band compared to what is expected for a single young burst of star-formation. Then, all these results point to the existence of a generalized and recent burst of star-formation activity, less than 3 Gyr old at , on galaxies which already have an old population of stars. We have checked on possible bias in the color-distribution of this population of galaxies due to the different completeness and limiting magnitudes in the various filters, but the result is negative. More than 50% of galaxies belonging to this sample are within the completeness magnitudes in all the filters.


The brightest galaxy in the sample at is located only away from the position of the maximum in projected number and luminosity-density maps in BJ and J. This galaxy is then proposed as the central cluster-galaxy. Its isophotal BJ magnitude is 22.83, so in the rest frame (K-correction is computed according to its SED), and the corresponding isophotal radius is about (about kpc). These values are quite compatible with those expected and observed for the brightest cluster-members in more nearby clusters. We have used a minimization procedure to fit the best synthetic spectrum coming from a single population to its photometric SED. The best fit is obtained for a young burst of star-formation 1.3 Gyr old, and the best fit for the redshift is , as it is shown in figure 8. The signature of an old stellar population appears as an excess in the J and K’ mean fluxes. Five other bright galaxies compatible with are present within a distance of (about kpc) around the central galaxy, with isophotal magnitudes in the range ( at ), and two additional ones of the same luminosity within a distance of . All these bright galaxies have similar SEDs and belong to the blue population mentioned above. Compared to low and medium-redshift rich clusters, such as A2218 or A370, the number of bright galaxies () found within a radius of about kpc around the central galaxy is lower: only 6 galaxies compared to 24 in A2218 and 22 in A370, under the same conditions. But A2218 and A370 are among the richest Abell clusters. The difference reduces when it is compared to high-redshift clusters from the EMSS Survey (Gioia & Luppino, 1994), such as MS1054.4-0321 and MS1137.5+6625, with tentative redshifts and respectively, where the expected number of bright galaxies is 13 to 14 (assuming a contamination of about 30%). Again, these clusters are very rich and strong X-ray emitters. We conclude that the cluster detected is probably not very rich. The main difference compared to A2218 or A370 is the evolutionary state of the bulk population of galaxies: even the brightest members seem to be undergoing an episode of active star-formation, or have experienced a burst just a few Gyr ago.

6 Photometric study of other redshift systems at z = 0.28, z 1.2 and z 1.8
There are three background galaxies in the field with spectroscopic redshifts around 0.28 (Bonnet et al. 1993), so we can wonder if a concentration exists at such a redshift. These galaxies are identified as G1, G2 and G3 in figures 1 and 2. In all the cases, the SEDs derived from photometry are in good agreement with the observed spectra within the common wavelength domain. The stellar population in G1 corresponds to a 9 Gyr old burst of star-formation, according to the minimization procedure to find the best fit by a synthetic spectrum. On the contrary, the SEDs of G2 and G3 are dominated by a younger population, such as a burst of star-formation about 3 Gyr old in both cases. Although these three galaxies are among the brightest objects in the field, there is no photometric evidence for a cluster at such a redshift. Only 26 objects are compatible with this redshift, including the arclet-candidate A2 (see Sect. 8), and their 2D distribution does not show any significant concentration in the projected number density. Besides, a cluster at would have to appear more clearly in the images than a cluster at . All these results point to the existence of only a small group of which G1, G2 and G3 are the brightest members. In addition, according to our data, the population of galaxies at does not show any particular alignement which could be interpreted as an induced effect of gravitational shear by a foreground lens. This result is also in good agreement with the results of Mellier et al. (1994).
The total number of objects compatible with is 62, but 22 of them are also compatible with : these are faint objects for which the photometric redshifts are poorly determined. Most of their magnitudes are beyond the completeness limit in at least one filter. The mean projected number-density of such objects over the whole field is 15.4 galaxies/arcmin2, when we take all the sample, without any selection in magnitude. Three clumps appear in the projected number-density. The most important local maximum lies eastwards and northwards with respect to the center of shear; it is 3.4 times the mean value, with a contrast of about 9.5. Nevertheless, it is produced by the presence of several faint galaxies beyond the completeness limit in all the filters, and the contrast reduces to zero when we consider a circular region of more than radius around it. When the sample is limited to objects brighter than J=25 (a value close to the completeness limit), only 41 objects remain and the previous maximum disappears (see fig. 9a). Objects in this sample are located preferentially in two clumps, where the number-density never exceeds 2.5 times the mean value, so the distribution within these regions is quite smooth. One of the regions overlaps the center of the cluster at . Again, as in the plane, the field 2 is not a blank field at , and the excess was already visible in figure 5a. It is worth noting that objects belonging to this excess at are expected to be lensed and slightly amplified by the cluster at , so their spatial distribution is probably the result of a magnification bias. Unfortunately, we cannot test on the existence of a systematic effect of shear on such objects because their angular size is too small. The images used in this work are deep enough to allow a good detection level and photometry, but too poor for an accurate determination of the shape parameters.
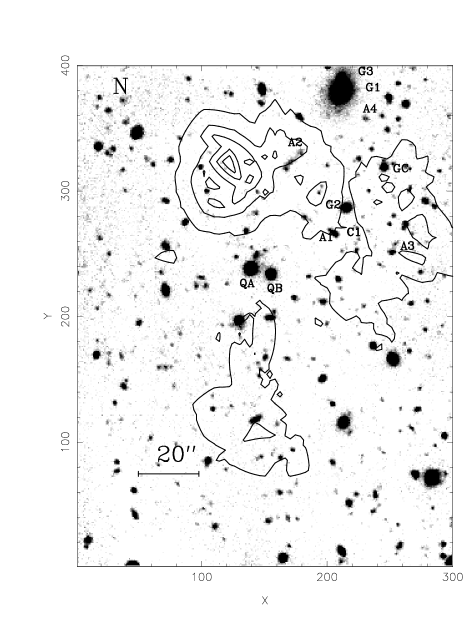
The last interesting concentration is that identified with the excess at , which contains most of the absorption systems found in the spectra of the two QSOs. 44 objects are found on the whole common field with photometric redshifts in the interval , and 42 of them are located within the field 1 (see fig. 9b), within a wide region centered around the center of shear and the main galaxy at . Almost all of them are fainter than the completeness magnitudes in all the filters, so any detailed discussion about their 2D distribution has to be taken with caution. The maximum in the projected number-density is 2.8 times the mean value, and the maximum local contrast is 6, but the 2D distribution is quite smooth. Again, these objects are affected by the presence of the foreground cluster, and a systematic effect of shear and magnification is expected for them.
7 The arc(let)s revisited
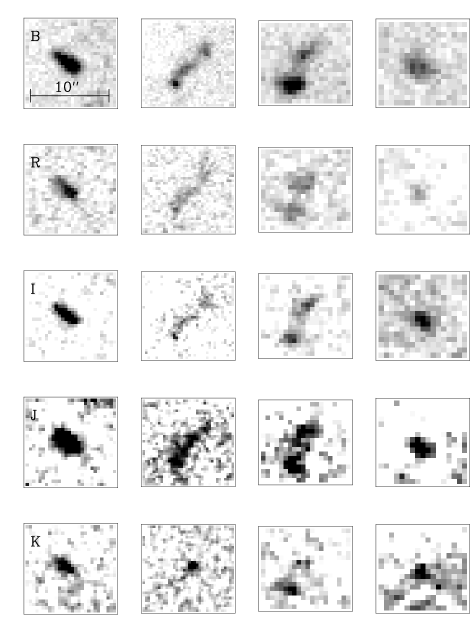
Three arclet candidates were reported in the paper by Bonnet et al. (1993) and another one was added by Mellier et al. (1994). Figure 10 shows the morphology of these arclets in the different filters. They are all located close to the excess of galaxies at . A2 and A3 show a complex morphology, whereas A1 and A4 are quite compact. According to the SEDs deduced from photometry, A1 and A4 seem to be cluster members. A1 is the fourth brightest cluster galaxy identified in this field and its SED is shown in figure 11a. The automatic procedure to fit the best synthetic spectrum to A1 and A4 has found that both SEDs are compatible with a recent burst of star formation, such as an E-type galaxy 1 and 2 Gyr old, respectively, at a redshift of . The SED of the arclet A3 is rather similar (an E-type galaxy 2.8 Gyr old), but the best fit for the redshift is lower, , according to the automatic procedure and marginally compatible with the cluster redshift. Figures 11b and 11c show the best automatic fit for arclets A3 and A4, respectively. So, these three arclets are more likely elongated cluster or foreground galaxies rather than gravitational arclets.
The arclet A2 is more complex and elongated. Three different regions can be distinguished in it: two blue regions, named and in figure 11d and Table 3, and a central region () which is the reddest. The colors of regions and are quite similar, whereas has more flux in the K’ band. Two different solutions for the redshift seem possible. The most reliable is that of a low redshift object (with ), and the automatic fit of the best spectrum in the range gives a solution at for the three regions. So, it could be a member of the group at . The best synthetic spectra at such a redshift correspond to a recent burst of star formation ( and ) or an old late-type S galaxy (). The relevant spectral feature is the presence of a break between the filters BJ and R in all the three regions, which corresponds to the break in the hypothesis of . In , the flux increases slightly between J and K’. If this is not due to a chance alignement along the line of sight (i.e. with a M star), another possible different solution is that of a high redshift object with the break between J and K’. The main break in the spectrum would correspond to the Lyman break in this case, and the best fit for the blue and the red regions would be . The difference between blue and red regions in the high redshift hypothesis is due to a difference in the age of the stellar populations. It is worth noting that the high redshift hypothesis can be tested spectroscopically, because is expected to lie at Å.
| Id. | BJ-R | R-I | I-J | J-K’ | Photometric | |
|---|---|---|---|---|---|---|
| max | redshift | |||||
| 24.79 | 0.56 | 1.17 | 0.50 | 1.15 | 0.60-0.80 | |
| 25.82 | 1.43 | 0.55 | 0.51 | 1.74 | 0.0-0.55/3.6-3.8 | |
| 26.11 | 1.39 | 0.65 | 0.51 | 2.18 | 0.18-0.55/3.6-3.8 | |
| 26.20 | 1.30 | 0.77 | 0.30 | 1.66 | 0.0-0.55/3.6-3.8 | |
| 26.14 | 1.64 | 0.57 | 0.72 | 1.71 | 0.07-0.65 | |
| 26.20 | 0.87 | 1.22 | 0.53 | 1.67 | 0.58-0.90 |


8 Discussion and conclusions
The present work suggests that Q2345+007 is probably the result of a very complex gravitational lens involving several mass concentrations at different redshifts. We confirm the presence of a group of galaxies rather than a cluster at . The main result is the identification and characterization of a distant medium-to-rich cluster at , which appears as an excess in the redshift distribution with respect to a blank field. The center of the cluster is located close to the center of the shear-field. Bonnet et al. (1993) already analysed this field and they obtained a good fit of the shear pattern by a singular isothermal sphere (SIS) with at z=1. Assuming that the bulk of the mass in the lens is associated with the cluster, the velocity dispersion required in order to produce the same mean shear pattern should range from to , the more probable value beeing . This value was estimated with the following assumptions: the mass-distribution follows a SIS, the redshift of the lens is , and the shear field measured comes mainly from sources around and . The resulting K-corrected M/L ratios in the inner radius are and .
Most cluster-member candidates at show SEDs with signatures of a recent episode of star-formation. About 50% of them are undergoing a star-forming process whereas the others are more likely burst-systems where the star-formation stopped between 1 and 3 Gyr ago. An old population of stars is present in about 50% of galaxies. These secondary-burst systems are similar to the population of galaxies that Barger et al. (1995) find in several medium-redshift clusters (about 30% of the population in such clusters) but, in our case, more than 40 % of the population within the completeness limit in BJ shows bursts, including the 10 brightest galaxies. Only 2 galaxies from this sample show SEDs corresponding to a pure old-population of stars, such as a non-evolved E-type galaxy, and they are relatively faint. These results indicate that the evolutionary state of the bulk population of galaxies is different from what is observed for medium-rich clusters at lower redshifts. The existence of short bursts of star formation at redshifts involving low-mass galaxies has been suggested by different authors to explain the results on deep galaxy counts (for example, Cowie et al. 1991, Lilly 1993, Babul & Ferguson 1995). According to our results, these star-formation processes could also affect the bulk population of galaxies in clusters within this redshift range.
Two other excesses of galaxies appear in the field of the double QSO with respect to the blank field, which points out the existence of clustering at redshift-strips and . In both cases, the 2D distribution in projected number-density is quite smooth, and the objects tend to be located around or close to the cluster at . These objects are faint, beyond the completeness magnitude in at least one filter in most cases, especially for the excess at . But, even if the 2D distribution has to be taken with caution, 95% of objects compatible with are located in the field 1. As they suffer the gravitational amplification induced by the foreground cluster, they are probably detected in the field 1 just because the magnification bias tend to enhance their total luminosities in this region compared to the blank field. A systematic effect of shear should appear on this population if this identification is correct. A more detailed study is needed to measure the shear on this pre-selected sample of high-redshift objects, using deep and well sampled images. In any case, we can already say that the typical magnitudes of objects belonging to the redshift-strips at and (BJ ) make them compatible with the population used by Bonnet et al. (1993) to determine the shear field. The detection of a so faint shear-effect was probably made easier (or even possible) by the existence of clustering along the line-of-sight. Concerning the double QSO, the existence of several excesses at different redshift-strips indicates that we are probably dealing with a complex lens. The high separation of the 2 images is the combined effect of these lens-planes, including the faint galaxy in the close neighbourhood of the fainter QSO reported by Fischer et al. (1994). As a final remark, we can mention that none of the relatively blue objects detected around the double QSO has a photometric redshift assigned, because their SEDs are quite different from the models adopted in this paper. Concerning the complexity of the lens, a similar result was found by Angonin-Willaime et al (1994) in the field of the double QSO 0957+561, where the main lens is the sum of a bright gE galaxy and of the cluster of galaxies associated with it. The field of QSO 0957+561 is also contaminated by a background group of galaxies identified spectroscopically, and many rather bright foreground galaxies. Their effects on the high separation of the 2 images are not clear and probably not dominant, but it should affect strongly the shear field of the faint background galaxies.
Among the arclets identified by Bonnet et al. (1993) and by Mellier et al. (1994), A1 and A3 are more likely elongated cluster members rather than gravitational arclets, whereas A4 seems to be a foreground object, only marginally compatible with the cluster redshift. No other elongated arclet-candidates are visible. The only exception is A2, for which a high redshift solution exists, at , although a more reliable one identifies it as a member of the group at . It is important for the lens modeling to confirm the high redshift hypothesis for this object, and it can be done because is expected at .
One of the priorities for the near future is to complete an extended spectroscopic survey on this field to confirm the predicted distributions in redshift. Recently, some additional spectroscopic data have been obtained at the CFHT, and the reduction is going on. The presence of strong emission-lines is expected in the visible range for those brightest cluster-member candidates which are undergoing an active process of star formation, making possible the measure of the redshift. It is worth noting that the study of the SEDs from BJ to K’ allows not only an estimate of the photometric redshift but also a determination of the optimal wavelength and feasibility for a successful measure of the spectroscopic redshift. In a more general context, we expect to check the reliability of the statistical method at high-redshift. Combining this technique of multicolor analysis with the systematic studies of weak-shear fields, and lensed QSOs in particular, is a very promising way to characterize the visible counterparts of large scale inhomogeneities.
-
Acknowledgements.
We thank Y. Mellier, for a careful reading of the manuscript, and H. Bonnet, B. Fort, G. Mathez and L. Van Waerbeke for their helpful comments and discussions all along this work. We are specially indebted to M. Dantel-Fort for her assistance during data reduction and to J. Bezecourt for his help in getting the filter transmissions. Part of this work was supported by the French Centre National de la Recherche Scientifique, by the French Groupe de Recherche en Cosmologie and the EC HCM Network CHRX-CT92-0044. JMM is grateful for financial support from an A.D.I. Research Grant and from the Ministeri d’Educació del Govern d’Andorra. GB acknowledges the CE for partial support through the ALAMED contract no Cil-CT93-0328VE.
A Appendix. Photometry of the Double QSO
Table 4 gives the magnitudes and colors of the 2 components of the double quasar. The photometric results in the optical region are compatible with those published by Fischer et al. (1994) within the errors, and no other new candidate to lens galaxy appears in J and K’. Fischer et al. (1994) found a magnitude difference between the two components of in BJ and in R, from the composite images taken between 1984 and 1993. The difference in magnitude is more important in the near-IR but this could be explained by the variability of the quasar between the optical and the near-IR runs. The colors are also very similar within the errors, except for I-J.
| BJ | R | I | J | K’ | |
|---|---|---|---|---|---|
| A | 19.47 | 18.94 | 18.48 | 18.01 | 16.96 |
| B | 20.71 | 20.13 | 19.62 | 19.56 | 18.47 |
| 1.24 | 1.19 | 1.14 | 1.55 | 1.51 |
References
- 1 Angonin-Willaime, M.-C., Soucail G., Vanderriest C., 1994, A&A 291, 411
- 2 Barger A.J., Aragón-Salamanca A., Ellis R.S., Couch W.J., Smail I., Sharples R.M., 1995, MNRAS preprint
- 3 Babul, A., Ferguson H.C., 1996, ApJ 458, 100
- 4 Belloni P., Bruzual G., Thimm G.J., Roser H.-J., 1995, A&A 297, 61
- 5 Bonnet H., Fort B., Kneib J.P., Mellier Y., Soucail G., 1993, A&A 280, L7
- 6 Bruzual G., Charlot S., 1993, ApJ 405, 538
- 7 Couch W.J., Ellis R.S., Godwin J., Carter D., 1983, MNRAS 205, 1287
- 8 Cowie L.L., Gardner J.P., Wainscoat R.J., Hodapp K.W., 1991, ApJ Preprint
- 9 Cowie L.L., Gardner J.P., Hu E.M., Songaila A., Hodapp K.W., Wainscoat R.J., 1994, ApJ 434, 114
- 10 Dressler A., 1980, ApJS 42, 565
- 11 Djorgovski S. et al., 1995, ApJ 438, L13
- 12 Ellis R.S., Couch W.J., MacLaren I., Koo D.C., 1985, MNRAS 217, 239
- 13 Fischer P., Tyson J.A., Bernstein G., Guhathakurta P., 1994, ApJ Letters 431, L71
- 14 Foltz C.B., Weyman R.J., Roser H.J., Chaffee F.H., 1984, ApJ 281, L1
- 15 Gardner J.P., Cowie L.L.,Wainscoat R.J., 1993, ApJ 415, L9
- 16 Gioia I.M., Luppino G.A., 1994, ApJS 94, 583
- 17 Gullixson C.A., Boeshaar P.C., Tyson J.A., Seitzer P., 1995, ApJS 99, 281
- 18 Kneib J.P., Mathez G., Fort B., Mellier Y., Soucail G., Longaretti, P.-Y., 1994, A&A 286, 701
- 19 Kneib J.P., Mellier Y., Pelló R., Miralda-Escudé J., Le Borgne J.F., Börhinger H., Picat J.P., 1995, A&A 303, 27
- 20 Le Borgne J.F., Pelló R., Sanahuja B., 1992, A&AS 95, 87
- 21 Lilly S., 1993, ApJ 411, 501
- 22 Mc Leod B.A., Rieke M.J., Weedman D.W., 1994, ApJ 433, 528
- 23 Mellier Y., Dantel-Fort M., Fort B., Bonnet H., 1994, A&A 289, 15
- 24 Mellier Y., Soucail G., Fort B., Mathez G., 1988, A&A 199, 13
- 25 Miller G.E., Scalo J.M., 1979, ApJS 41, 513
- 26 Narayan R., Blanford R.D., Nityananda R., 1984, Nat 310, 112
- 27 Pelló-Descayre R.,Soucail G., Sanahuja B., Mathez G., Ojero E., 1988, A&A 190, L11
- 28 Pelló R., Le Borgne J.F., Sanahuja B., Mathez G., Fort B., 1992, A&A 266, 6
- 29 Pelló R., Vilchez-Gomez R., 1996, A&AS 115, 219
- 30 Simons D., 1993, Redeye, CFHT Infrared Camera Manual, version 1
- 31 Songaila A., Cowie L.L., Hu E.M., Gardner J.P., 1994, ApJS 94, 461
- 32 Soucail G., Mellier Y., Fort B., Cailloux M., 1988, A&AS 73, 471
- 33 Steidel C.C., Sargent W.L.W., 1990, AJ 99, 1693
- 34 Steidel C.C., Sargent W.L.W., 1991, AJ 102, 1610
- 35 Subramanian K., Chitre S.M., 1984, ApJ 276, 440
- 36 Tyson J.A., Seitzer P., Weyman R.J., Foltz C.B., 1986, AJ 91, 1274
- 37 Tyson J.A., 1988, AJ 96, 1
- 38 Tyson J.A., Seitzer P., 1988, ApJ 335, 552
- 39 Weedman D.W., Weyman R.J., Green R.F., Heckman T.M., 1982, ApJ 255, L5
- 40 Weir N., Djorgovski S., 1991, AJ 101, 66