Late-Type Dwarf Galaxies in the Virgo Cluster: I. The Samples
Raymond and Beverly Sackler Faculty of Exact Sciences,
Tel-Aviv University)
Abstract
We selected samples of late-type dwarf galaxies in the Virgo cluster with HI information. The galaxies were observed at the Wise-Observatory using several broad-band and H bandpasses. UV measurements were carried out with the IUE Observatory from VILSPA, and with the FAUST shuttle-borne UV telescope.
We describe the observations in detail, paying particular attention to the determination of measurement errors, and present the observational results together with published data and far-infrared information from IRAS. The sample will be analyzed in subsequent papers, in order to study star formation mechanisms in galaxies.
Key words: Galaxies, star-formation; Galaxies, evolution;
Galaxies, individual
1 Introduction
The process of star formation is one of the most important process in galactic evolution. Generally, star formation is initiated by the gravitational collapse of gas clouds, followed by fragmentation into future individual stars. When stars enter the main sequence, radiation pressure and stellar winds push on the ambient gas and prevent it from collapsing further.
Despite extensive progress in understanding the star formation process, there are several issues still not fully understood, due to the complexity of this process. One can summarize the currently open issues, concerning the star formation processes in galaxies, in two major questions: (1) What are the mechanisms that govern the star formation process, and how do they depend on the galactic type and environment? (2) How do the star formation rate (SFR) and the initial mass function (IMF) depend on various galactic properties, such as interstellar gas density, morphology of the interstellar gas, metallicity, and the amount of dust in the interstellar medium?
In order to find the SFR of a sample of galaxies one needs to know the IMF characterizing the star formation in these galaxies. The IMF can be derived by fitting a number of observed properties, such as broad-band colors, to a set of models of different stellar populations, with different IMFs (population synthesis). By comparing the various color indices to the synthetic colors calculated from models one can, in principle, determine the IMF of the galaxies in the sample. This requires a database spanning as large a range in wavelengths as possible, to eliminate the degeneracy of results in several conditions, being able to distinguish between different conditions that yield the same value for one or more colors. It is important that one of the measured bands is in the UV regime, in order to trace the massive stars which contribute most of the energy emitted in this part of the spectrum.
Using these data together with a direct massive-star tracer enables one to draw a consistent picture of the star formation history of the sample galaxies. One of the most common tracers of young massive stars, adopted also here, is based on the H line intensity. The H line has been used by many (Kennicutt 1983, Kennicutt & Kent 1983, Gallagher, Hunter & Tutukov 1984, Pogge & Eskridge 1987, Kennicutt et al. 1994), mainly due to its high intensity. The main deficiency of this method is the dust extinction. However, the extinction is moderate in late-type irregular galaxies like the ones used in this study, usually some 0.2–0.4 (van der Hulst et al. 1988).
2 The sample
When selecting a sample of galaxies for the investigation of star formation, one can simplify the theoretical situation by selecting a sample of galaxies of similar type, in which the star formation parameters should basically be the same. Uncertainties due to neighborhood influence on star formation are eliminated by selecting the sample from a well-defined environment.
In addition, our aim is to isolate some of the star formation mechanisms. Small objects, such as dwarf galaxies, do not show spiral structure or a rotating disk which may complicate the star formation triggering parameters. Therefore they make good candidates for our research.
We selected a sample of late-type dwarf galaxies, all in the Virgo cluster area. This is a nearby region, thus the galaxies appear reasonably bright, and are at a high Galactic latitude ( ) where the extinction is very small. In addition, as the galaxies are members of a rich cluster, the sample enables testing for the effect of cluster environment on the star formation properties.
Binggeli, Sandage & Tammann (1985, BST) catalogued more than 2000 dwarf galaxies in the Virgo cluster. Most objects are dwarf ellipticals, but a few hundred are late-type dwarf galaxies. Hoffman et al. (1987) and Hoffman et al. (1989) studied all late-type dwarfs in the BST sample with the Arecibo radio telescope and produced single-beam HI flux integrals and shapes of the 21 cm line. Our sample of late-type dwarfs was extracted from their list of objects with non-zero HI measurements, using the following selection criteria:
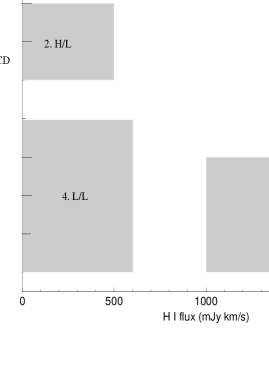
Two subsamples of dwarf galaxies were selected, dichotomized by their total HI content (high or low). Then, in order to test the dependence of star formation properties on the galactic type, we separated between high surface brightness (BCD and ImIII/BCD) and low surface brightness galaxies (ImIII–ImV). We, therefore, constructed four subsamples of late-type dwarfs from the BST catalog (hereafter Virgo Cluster Catalog - VCC).
The selections criteria for the four subsamples were
chosen in order to have similar numbers of objects in each group,
and are characterized as follows:
Name
Type
(mJy km/s)
No. of
objects
High/high (H/H)
BCD, ImIII/BCD
9
High/low (H/L)
BCD, ImIII/BCD
7
Low/high (L/H)
ImIV, ImIV/ImV, ImV
4
Low/low (L/L)
ImIII/ImIV, ImIV, ImIV/ImV, ImV
5
![[Uncaptioned image]](/html/astro-ph/9603127/assets/x2.png)
The selection criteria are schematically displayed in Fig. 1, and the sample galaxies, extracted from the VCC using these criteria, are presented in Table 1. The mass of neutral hydrogen in each galaxy is directly related to its HI flux integral, and will be presented in 3.5.

The intention in the dichotomy in both galactic type and HI content is to attempt to discover even weak dependence of star formation on these parameters. We expect to find a difference in the observed properties which measure recent and present star formation, such as broad-band colors and H line strength, between the low and high surface brightness subsamples. We are aware of the small number of objects in each subsample, a result of observational necessity.
The spatial distribution of the sample galaxies is displayed in Fig. 2. Low HI galaxies are represented by open circles, high HI galaxies by filled circles. High HI galaxies are missing from the central region of the cluster, while low HI galaxies appear to be evenly distributed within the cluster. Although our sample is small, it supports the hypothesis of gas stripping off near the cluster core.
3 Data collection
Our data collection consists mainly of optical observations. In addition, UV observations and published information are used and presented here.
All optical observations were carried out at the Wise Observatory (WiseObs) in Mizpe-Ramon, Israel. A few of the sample galaxies were observed by NB in spring 1988. During this run the galaxies were imaged using the observatory’s RCA-CCD camera. Each galaxy was measured for 10 min. through a standard V filter.
The other observations were carried out from 1991 to 1993. These observations included three types of measurements: galaxy imaging in broad bands, photometry of reference stars, and galaxy imaging in H.
3.1 Broad-band imaging
Each galaxy was imaged through B, V, R and I filters with exposure times which varied between 5 and 30 min. The RCA CCD was used in most cases, except for some runs in which the FOSC was used in imaging mode. For each object a reference star close enough to appear in the galaxy’s CCD frame was selected and was imaged together with the galaxy. The RCA CCD is a 512x320 pixel array, thinned and back-illuminated, with pixels. The FOSC is a focal reducer device with a TI pixels, where each projected pixel is 0”.7.
3.2 Photometry of reference stars
In order to put the flux on an absolute scale, the reference stars imaged with the galaxies were measured with the Two-Channel Photometer of WiseObs. We used only channel 1, with a Hamamatsu RCA C31034A photomultiplier type with a GaAs cathode in a thermoelectrically cooled enclosure.
The reference stars were chosen so that their magnitudes were in the proper range for the photometer: 10–16. Each of the reference stars was measured through B, V, R and I filters together with photometric standard stars from the Landolt equatorial sequences (Landolt 1973, 1992).
The photometry of the reference stars requires optimal atmospheric conditions, as only then can the atmospheric extinction be accurately determined. For this reason, these measurements were repeated during several nights in order to obtain more reliable results and test their consistency.
3.3 H measurements
Most of the sample galaxies were imaged through narrow-band filters to derive their H emission. For each galaxy two filters were used: one which contains the H line (”H filter”), and the other which samples the continuum radiation adjacent to it towards longer wavelengths (”off-H”).
One of the three H filters listed in Table 2, which differ by their central wavelength, was used to image each galaxy according to its redshift, while the same off-H filter was used for all galaxies. The central wavelength and width of these filters were chosen with the following requirements:
-
1.
There is no overlap between the off-H and any of the H filters, while this bandpass is still close enough to the line for sampling directly the continuum radiation,
-
2.
There are no significant spectral lines in the bandpass of the off-H filter,
-
3.
The H filters cover the range of velocities of the Virgo cluster ( 0 – 2500 km/s), while any H line emitted within this velocity range falls in one of the filters’ bandpass within at least 90% of its peak transmission.
| Filter ID. | (FWHM) | Peak transmission | |
|---|---|---|---|
| H | 6562Å | 50Å | 67.5% |
| H | 6586Å | 48Å | 66.0% |
| H | 6610Å | 55Å | 69.7% |
| off-H | 6700Å | 53Å | 70.0% |
One should note the [SII] lines (6716Å and 6731Å) which may be sampled by the continuum filter. The contribution of these lines is expected to be small in these galaxies, at the most 15% of the H radiation (e.g. Gallego et al. 1996). The shorter of these lines is reduced by the filter’s response by 10% while the other is reduced by 50% for zero redshift systems. For higher redshift galaxies these lines are extinguished further, and therefore we can ignore their contribution in our sample of galaxies. The filter characteristics described above are for light falling normal to the plane of the filters, and they vary, in principle, with the incidence angle. Since the observations were carried out with the CCD placed in the focal plane of the f/7 converging beam of the telescope, the incidence angle on the filters is between – . A measurement at the Tel-Aviv University Applied Physics Department showed that the central wavelength of the three H filters shifts by 1.5Å to the blue relative to the nominal wavelength due to this effect, while the off-H shifts by 3.8Å blueward. We conclude that these changes are not significant for our measurements.
For each of the galaxies, at least two 20 min exposures were obtained through each of the two filters. In addition, a spectrophotometric standard star (HZ44) was measured several times each night through different air masses with the same filters, in order to derive the atmospheric extinction and absolute photometric calibration for the H images.
3.4 UV observations and data
Seven of the sample galaxies were observed with the IUE, two of them in 1986 within the US program EGITT. The other five were observed by EA in 1991 and 1993. The observations took place at the VILSPA tracking station, Spain, and each galaxy was observed for a full VILSPA observing shift, 6 hours of integration. In all cases the spectrum was obtained through the IUE large aperture, which is a oval, using the short wavelength camera (SWP) - low dispersion setup, which covers the spectral range of 1200–1950Å.
In late March 1992 the ATLAS-I space shuttle mission took place, during which UV observations were carried out with the shuttle-borne telescope FAUST (Fusée Astronomique pour l’Ultraviolet STellaire or FAr Ultraviolet Space Telescope). This UV imaging instrument was developed jointly by the Laboratoire d’Astrophysique Spatiale of the CNES, and the Space Astrophysics Group at Berkeley. The FAUST UV bandpass has Å with Å. During the ATLAS-I mission it imaged a number of wide sky areas, among which are three overlapping frames of the Virgo cluster (Brosch et al. 1997a).
These FAUST frames were used to obtain UV data for the dwarf galaxies in our sample.
3.5 Additional data
A few of the sample galaxies were detected by IRAS and appear in the IRAS point source catalog. In addition, co-addition of the individual IRAS scans for a deeper detection or an upper flux limit was done by NB for the objects which do not appear in the IRAS catalog.
For every galaxy of the sample, except for VCC806 and VCC1013 where observations were not possible due to software problems, we have, thus, the IRAS data, either as absolute fluxes or as upper limits of flux. In addition, some objects are FIR sources listed in the IRAS Faint Source Catalog. Their flux densities together with the other galaxies data are listed in Table 3, but without errors. The typical error of the FSC, for faint IRAS sources, is 15% of the listed flux density.
Our sample uses results from Hoffman et al. (1987) and Hoffman et al. (1989) obtained with the Arecibo radio telescope. From these, we calculated the HI mass following the prescription in the Third Reference Catalog of Bright Galaxies (de Vaucouleurs et al. 1991), as:
| (1) |
where is in M⊙, is the HI line flux integral in mJy km/s and D is the distance to the object in Mpc.
In order to derive the HI mass of these galaxies, a common distance is adopted for all objects. A value of 18 Mpc may well represent the average distance of galaxies in the Virgo cluster (e.g., Fouqué et al. 1990), and is the value adopted here. No more accurate information is available on the distance to the type of galaxies discussed here (such as a Tully-Fisher relation), and in any case, such a relation is usually very dispersed for irregular galaxies and the uncertainties are large. We adopt, therefore, a distance of 18 Mpc and bear in mind that the uncertainty in this distance can be up to 15%. These values, together with the IRAS data, are given in Table 3.
![[Uncaptioned image]](/html/astro-ph/9603127/assets/x4.png)
4 Data reduction
All data reduction was performed at WiseObs headquarters, Tel-Aviv University. The CCD images were reduced with the VISTA image-processing software package, (Pogge et al. 1988), using normal procedures. Photometric data was reduced with the observatory’s photometry package.
4.1 Broad-band colors
The photometer data were reduced with a composite extinction-transformation program. This program computes instrumental magnitudes and colors and fits them by least-squares to the catalog values of the standard stars. The fit is linear in air mass and second-order in colors, and it takes care of effects like the variation of extinction across the bandpass, as well as differences between the filters used and the Johnson-Kron-Cousins standard bandpasses.
As mentioned before, the photometric observations were repeated during several nights for most of the reference stars. Each night was ranked according to the goodness of fit of the standard stars parameters. The results of the different nights were consistent with each other, and for each reference star the result from the ’best’ night was adopted.
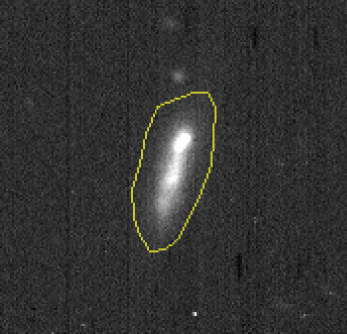
The broad-band images of every sample object were merged to produce a final frame with the best S/N available in each band. The object’s total intensity was measured on each final frame, together with the total intensity of the corresponding reference star. Since the objects are irregularly shaped, no model fitting to their shape could usually be done. Therefore, an empirical way was adopted, as follows:
A polygonal area, which contains the entire object as determined by visually inspecting the image, is constructed manually upon the displayed image, using the deepest of the four available images of that object. The guideline for setting the polygon border is that the signal-to-noise ratio for each pixel of the object’s image falls well below unity, while trying not to include too much of the sky noise. This corresponds to a typical surface brightness of in V, depending on the total exposure time and sky background level.
The total counts within this region are summed-up and the appropriate sky background is subtracted. The sky value and (standard deviation of a pixel’s value from the sky level) were calculated using the SKYALL procedure (Almoznino et al. 1993), which adopts the most probable intensity value as the sky level. The error of the object intensity is given by:
| (2) |
where G is the gain of the instrument, and is the number of pixels within the polygon. An example of a galaxy image with the polygon used for its measurement is shown in Fig. 3.
The reference star was measured in the same way as the object, only within a arcsec circular ’aperture’ centered on the star, instead of a polygon.
With the photometrically measured magnitudes of the reference star in each band, the corresponding magnitudes of the object are obtained directly from the CCD frames from the ratio of intensities. Actually, the derived quantities were the V magnitude and the color indices B–V, V–R and R–I. The advantage of this method is that observations of the sample galaxies, which consume large amounts of telescope time, do not require any special observing conditions, since both the object and the reference star appear on the same CCD frame, and the measurement is relative. An effect that may be influencing the results, is the possible difference between the effective response of the CCD+filters observing system and the standard Johnson-Kron-Cousins system. The implication of this effect on the accuracy of the rersults is discussed in 5.
The object V magnitude is given by:
| (3) |
where is the object CCD intensity, is the reference star CCD intensity, and is the reference star V from the photometric measurement. The error of the derived magnitude is:
| (4) |
where , and are the relative errors of the object and star CCD intensity, and is the error of the photometric result.
The object color indices and their errors are derived in the same way as the V magnitude, except that intensity ratios between two CCD frames are used, instead of intensities. In a single case (VCC 1468) the I band image had a very intense and nonuniform sky background relative to the low object signal, causing an unreliable R–I result of –0.25. This result is discarded here, while other colors of the same galaxy are used.
In addition to broad-band magnitudes and colors, approximate monochromatic magnitudes at , , and were obtained from the broad-band data. This was done using the corresponding data for flux densities at the central wavelength of B, V, R and I broad-bands for a normal zero-magnitude star from Bessel (1979). The flux density for a galaxy at a wavelength that corresponds to a certain band is given by , where is the flux density of the zero-magnitude star and is the broad-band magnitude of the galaxy at band . The flux densities are converted to monochromatic magnitudes by: (erg/s/cm2/Å) The errors are the same as the corresponding broad-band errors.
4.2 H flux measurements
The purpose of observing the galaxies in H is to measure the line emission from each galaxy. For this, one should subtract the continuum radiation from the flux measured through the H filter. This is done by observing each galaxy through two filters: one centered on the line (H filter) and another rejecting emission lines and (presumably) sampling the continuum (off-H). The procedure entails the determination of the flux density of the continuum (sampled by the off-H filter), scaled to the transmission profile of the H filter, and its subtraction from the flux measured by the latter filter.
In order to derive the absolute fluxes of the objects, the atmospheric extinction should be compensated. This is done using the results for the spectrophotometric standard star, which was measured through different air masses during the same night of observation. Naturally, this type of reduction uses magnitudes rather than fluxes. Only after the atmospheric extinction is taken care of, can fluxes be derived.
The H data consist of at least two frames in the H filter and two in the off-H filter, for each of the sample galaxies. In contrast to the broad-band data where frames were combined, here each frame was reduced to yield a separate monochromatic magnitude for the object.
Each of the galaxies was measured inside the same polygonal area used for its broad-band image. The method of measurement was basically the same as for the broad-band frames, with the exception that the sky background level was computed several times using different sky ’boxes’ around the objects. This was because the signal from the galaxies was very weak in a 50Å narrow band, and slightly different sky values make a difference in the results. The mean of these results was adopted as the object counts, while the error was usually taken as the largest of the errors of each measurement. The standard deviation of the results was normally smaller than this, but whenever it was larger - it was adopted as the error. In some cases the result was consistent with zero, mostly in the off-H band. The error of the galactic counts was calculated by equation 2.
The photometric standard HZ44 was measured through a ’circular aperture’ on each of its frames. We converted the results for atmospheric extinction and put them on the monochromatic magnitude scale of HZ44 (Massey et al. 1988), where the stellar spectrum is convolved with 50Å wide bands, separated by 50Å. The following results were used for HZ44:
A mean flux result was calculated for each object in each of the two bands, using the available monochromatic magnitude results for this band. The total flux obtained through any of the two filters is the average flux density in the appropriate wavelength times the effective filter width. The shape of the transmission curves of our narrow-band filters indicates that their FWHM represents well their effective width, thus, the FWHM of the filters listed in 3.3 was adopted as their effective width.
To obtain the net H line flux, the continuum contribution is subtracted from the total H band flux. However, the result of the off-H filter may not represent the exact amount of continuum radiation at the H band, as the continuum flux itself gradually changes with wavelength. This color term is small, but may be significant in the case of H faint galaxies. To compensate for this, the rough SED from the broad-band data was considered (its derivation is described in 5.3). The monochromatic magnitudes at and , derived from the V and I magnitudes, were interpolated linearly to yield a rough, gradual change across the spectral region between them. This information was used to obtain the expected change in continuum radiation between the two H narrow bands. The R band magnitude was not used since it contains the H line and may be misleading.
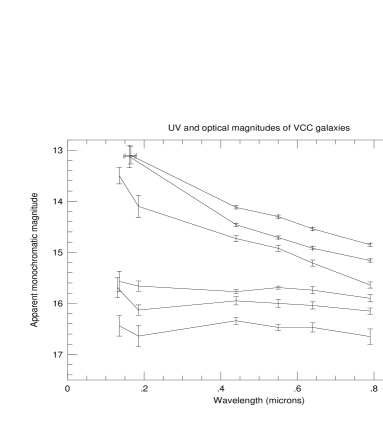
The SEDs of the galaxies are displayed in Figs. 4 and 5. For all the sample galaxies the SED decreases with increasing wavelength and the relative change of the continuum radiation between the off-H and H bands is from 0 to 2.5%. For the H-bright galaxies the H flux may be as high as twice that of the off-H band and clearly the effect of continuum sloping is insignificant, as the accuracy of our measurements is of order of 5%. For H-faint galaxies, however, taking this effect into account can change our interpretation for a certain object, from a significant H flux to zero H flux.
If we denote the expected ratio between the H band continuum flux and the off-H flux, as derived by the above procedure, by , the net H line flux is given by:
| (5) |
where and are the average flux densities obtained through the two bandpasses, and is the FWHM of the H filter. The H equivalent width is given by:
| (6) |
The errors were calculated by standard procedures from the errors of and while the parameters and are taken without error. This yields a relative error of the H flux from 5% in the H bright galaxies to more than unity in the galaxies with non detected line radiation. Note that all the H fluxes and equivalent widths derived here are actually H + [N II] fluxes and equivalent widths, as the filters used include also the accompanying nitrogen 6548, 6583Å lines. This will be discussed later in more detail.
Using the total flux, the H flux per unit solid angle was derived for each galaxy. The angular size of the galaxies was determined by constructing a confining polygon around the galaxy, with its border set to a S/N (smaller than the one used for the measurement of total fluxes). The border was set on the deepest image of each object and it corresponds to in B.
4.3 UV data reduction and combination with optical data
As mentioned in section 3.4, two types of UV data were collected for the sample galaxies: IUE spectral data and FAUST imaging data. Our aim is to construct a SED for as many galaxies as possible from the sample. For this, a derivation of UV monochromatic magnitudes was performed at WiseObs.
For the five galaxies observed during 1991 and 1993 the spectra were re-derived from the photometrically corrected IUE images. Reseau marks and ’hot pixels’ were interpolated over, to obtain more reliable spectra of the objects. The spectra of all the galaxies were faint and noisy, and no spectral lines were clearly visible. To obtain the continuum flux, the spectra were convolved with a 30Å wide Gaussian kernel, and only the smoothed spectra were considered. This was performed also for the two sample galaxies observed in 1986, where the Uniform Low-Dispersion archive spectra were used.
The smoothed spectra were measured in two 100Å wide ’bandpasses’, centered at 1350Å and 1850Å. The error of these measurements was estimated to be between 15% and 20% according to the noise at each band. For two objects (VCC562 and VCC2033) this procedure yields zero flux, and their spectra were not reduced further. A conversion was made from to monochromatic magnitudes with Å. The error was calculated as in 4.2.
The IUE large aperture is in size. Therefore, the spectrum we obtained does not represent the radiation emitted by the entire galaxies, but rather the energy from their bright regions. However, because the galaxies in our sample are small in size, most or all of the radiation comes from a region of that size.
In order to ensure that no bias is present in the results, the optical broad-band images of the galaxies with IUE data were sampled through ’ovals’ as similar as possible to the IUE aperture, in size, shape and orientation during the IUE exposure. The reduction was the same as for the broad-band photometry from CCD images, with the exception that the area of sampling was different. Monochromatic magnitudes in the optical were derived for the central regions of these galaxies to produce a meaningful combination with the UV data and a reliable SED of the galaxies.
The above treatment was not performed for VCC324=MRK49, which is very large for IUE (). Because of its size, a small change in the location, orientation or size of the artificial oval used for sampling, may lead to great changes of the final result, which, in turn, may lead to an error in the derivation of the SED. Therefore, the UV data for this galaxy was discarded.
As mentioned above, three fields in the Virgo cluster were imaged by the FAUST instrument. Each field is about in diameter and together they cover most of the cluster. A merged picture of the three images is shown in Brosch et al. (1997a), along with a full analysis of the FAUST observations in the Virgo region. Note also that a general catalog of all FAUST sources was produced by automatic correlations against existing catalogs (Bowyer et al. 1995).
The FAUST images underwent flat-fielding corrections at Berkeley, to obtain frames in calibrated units of FAUST-counts per second. Each frame was compared to a predicted UV map of the corresponding area of the sky, derived from the SAO catalog (Shemi et al. 1993), in order to identify the SAO stars in it. These were used to derive the transformation from the image pixel coordinates to celestial coordinates. About 15 stars were used in each frame, and the standard deviation of the calculated coordinates from the real ones was (0.45 pixel).
The expected location of every sample object was found on the frames using these transformations. At each location ’aperture photometry’ was performed in much the same method as for the reference star measurement in 4.1, with the exception that the error calculation did not take the photon-statistics error into account. This is because in this type of frames the sky noise dominates the error of the measurement in comparison with other effects.
Two of the sample galaxies were reliably detected on the FAUST frames: VCC1725 and VCC1791. For the other objects, an upper limit for the UV radiation was derived as follows: whenever an object was expected to appear in more than one FAUST frame, its location was measured separately on each frame. Results for objects close to the image edges were ignored, due to very low S/N, and a upper limit was derived whenever the accuracy was worse than 30%. For objects which had more than one acceptable result, the ‘best’ result was adopted, i.e., the lowest upper limit value. The results were then transformed to approximate monochromatic magnitudes at 1650Å using the calibration from Brosch et al. (1995):
| (7) |
where and its error are the same as in 4.2.
Unfortunately, the two objects which were detected appeared only on one frame, so no cross check for galaxy fluxes was possible. However, cross checks between the three frames were carried out using other objects which appear in two, or three images, yielding good agreement between their different count results: disregarding very bright objects, in which case distortions arise, 90% of the objects have values that differ by less than 1.5 from each other. It should be noted that only two galaxies were both measured by IUE and are within the field of view of FAUST. These are VCC562 and VCC2033, which have FAUST UV upper limits consistent with the S/N
5 Results
5.1 Broad-band magnitudes and colors
In general, the V magnitude of the galaxies lies within a range of of their listed blue magnitude from the VCC. Caution should be exercised when comparing our results with other published data, since most of the photometric observations of these galaxies were carried out through apertures with various diameters, between 19” and 120” (Hunter & Gallagher 1985, Gallagher & Hunter 1986, Gallagher & Hunter 1989, Drinkwater & Hardy 1991). We compared our broad-band results with those of Gallagher & Hunter (1986) by sampling the B and V images through the same apertures as their measurements. Of eight measurements four are within from their published values, three galaxies deviate by up to , and for VCC1179 our value, as measured in a similar aperture, is brighter by than that of Gallagher & Hunter (1986). For this galaxy they have obtained a value of B–V redder by than our expected result. VCC1179 is a very faint object and it is likely that their aperture missed a significant part of the galaxy due to a blind offset pointing.
As for the B–V results, our expected values are redder by on average than those of Gallagher & Hunter 1986, except for VCC1179, for which our result is bluer, as mentioned above. We note that the broad-band colors were obtained through comparative photometry on CCD images, together with absolute photometry of the reference stars and we check whether this could be due to a color term. The data of the reference stars are calibrated according to the standard Johnson-Kron-Cousins bands, but the CCD photometry did not take into account the possible difference between the CCD filters and the standard. However, if the CCD+filters observing system has a nonzero color term, this would affect the results only through the color difference between the measured galaxy and the reference star on the CCD frames. In other words, if the galaxy is measured to have the same CCD colors as the reference star, then its standard colors are the same as the star’s, provided the color term is not too large. The color differences between the sample galaxies and the stars were mostly in the range of 0.0 – 0.2 in all colors. This means that a color term as large as 0.15 will cause an error of up to 0.03 in the results, which is the typical error in our data. From a number of observations carried out in 1993, the WiseObs RCA CCD was found to have color terms of up to 0.15 (in B–V, Heller 1993, private communication). The change in colors due to this effect is, thus, not markedly significant in our case. In addition, no correlation was found between the color difference of galaxy - ref. star and the difference from published data. Based on this consideration, we believe that our broad-band results are reliably representing the observed standard color indices of the galaxies.
![[Uncaptioned image]](/html/astro-ph/9603127/assets/x6.png)
The broad-band data of the galaxies are given in Table 4. These broad-band colors are the observed values, and are not corrected for internal dust extinction (the Galactic extinction is very small in the direction of Virgo). The issue of internal dust extinction will be discussed in a subsequent paper.
5.2 H fluxes
Out of 25 galaxies with broad-band data, 21 were measured in H, while the remaining four were too faint to be observed through such narrow bandpasses. The total H + [N II] fluxes of these 21 galaxies are as follows: 7 objects were found to have fluxes consistent with zero within 1.5, and the others range form to with an average of . The H-brightest galaxies (above ) are those from the high surface brightness group. Of these, the high HI galaxies subsample seems to dominate. However, this could be a selection effect, with the high HI galaxies closer and larger, in general, than the low HI galaxies. These results, together with other data, are given in Table 5. Considering the H + [N II] surface brightness, rather than the total line flux, the two subsamples are not markedly different from each other. The H + [N II] surface brightness ranges up to , with the typical value a few times smaller. Hereafter we refer to H + [N II] as ’H’, both for convenience and, as will be discussed below, since these objects have probably relatively small contributions of nitrogen lines.
As mentioned in 3.3, the filters used have a bandpass of 50Å and the H lines deviate from the central wavelength by at most 12Å. The H lines themselves have a typical width corresponding to a velocity dispersion of km/s, i.e., Å. The combination of two profiles - the filter and the emission line makes it very difficult to correct the measured flux. We choose, therefore, not to attempt any correction, knowing that the derived fluxes may be subject to a reduction of typically 5 percent due to this effect.
Another correction that cannot be accurately derived without detailed spectroscopic information is the contribution of the nitrogen lines to the measured H line. This is mainly because galaxy lines are shifted differently relative to the peak transmission wavelength of the filters and the [N II] lines are sampled through different parts of the filters’ response curve for every galaxy. As a consequence, the [N II] lines are weighted differently relative to the H line for each galaxy. However, neglecting the [N II] contribution will not affect our results significantly. The typical [N II]/H ratio is less than 0.10 for dwarf irregulars (e.g., Kennicutt 1983, Gallagher & Hunter 1989), as in general they have lower metallicities than spirals and lenticulars. This effect is in the opposite direction to the previous one, namely, it increases the flux we assign to the H line, while the effect of missalignment of the line with the filter decreases the measured flux. To our estimate, both effects are within the errors of our measurements.
A greater effect on the H results is the internal dust extinction. Again, this is different from one galaxy to another, and is more difficult to account for. As in the broad-band section, we stick to the raw data as far as presentation of the results is concerned and consider this effect in a subsequent paper. This applies for both the H fluxes and the equivalent widths of the lines. The H equivalent widths are also shown in Table 5, together with the corresponding fluxes.
![[Uncaptioned image]](/html/astro-ph/9603127/assets/x7.png)
5.3 Combined results
The UV monochromatic magnitudes obtained from the IUE observations or from FAUST were combined with the optical monochromatic magnitudes from WiseObs to yield a rough spectral energy distribution of the sample galaxies. No correction for internal extinction was made. Unfortunately, only 6 galaxies were detected in the UV. Nine other galaxies have UV upper limits from FAUST images and nine others have no UV data at all. The galaxies with UV magnitudes are plotted in Fig. 4 and the galaxies with upper limits in Fig. 5.
As expected from the broad-band data, the SEDs of the galaxies display a variety of behaviors. In Fig. 4, three of the galaxies have steep SEDs (two were detected by FAUST and VCC144 was chosen for observation by IUE due to its strong H emission), and three have flat SEDs. It should be noted that for galaxies with IUE data only the SED of the inner part of the galaxy is plotted.

6 Discussion
An interesting relation is apparent between the V magnitude and the recession velocity of the galaxies, as derived from the HI line (Fig. 6). There is a general negative correlation between the two parameters. The point in the upper right corner of the plot is VCC806, a very faint object barely detected in the radio and optical, which may be a background galaxy. If we exclude this point, the correlation coefficient is –0.55. The correlation coefficient between the recession velocity and the V-band fluxes of the galaxies corresponding to their magnitudes is 0.46.
This correlation may lead to the following empirical conclusion: if faint galaxies in Virgo are characterized by lower recession velocities, a Malmquist bias will cause the depletion of slowly receding galaxies in the sample. This may explain the observed skewness of the velocity distribution of faint dwarfs in Virgo (Binggeli et al. 1993). These velocities are shifted, in general, towards higher values, compared with the velocity distribution of other galactic types. We may expect, therefore, that many faint dwarf galaxies which do not yet have velocity data are mostly slowly receding, with velocities in the range of 0–1500 km/s. This may balance the skewness of the velocity distribution of these galaxies.
Clearly, checking this relation with larger samples in Virgo, not necessarily of faint blue galaxies is necessary, but such a survey is outside the scope of this paper.

As for the origin of this correlation, it may arise because of infall of galaxies towards the Virgo cluster core (e.g., Tully & Shaya 1984, Binggeli et al. 1993). Galaxies which are between us and the core appear brighter and are falling away from the observer to the cluster core, while galaxies behind the core are falling ‘toward’ us, having a recession velocity lower than that of the core itself (around 1200 km/s). This would produce the effect of negative correlation seen here and, according to this interpretation, the faint Virgo dwarfs lacking velocity data would be those behind the cluster core. It should be noted, however, that this effect, in its simple interpretation, does not match the data perfectly. This is because the range of magnitudes of the sample galaxies, which is correlated to the recession velocity, is roughly 1.5 – 3 , and depends on the intrinsic scatter of absolute magnitudes assumed for the sample. This range corresponds to a difference in distance of a factor of 2 – 4 between the near and far galaxies of the sample, which is not likely to be the case in Virgo.
The broad-band B–V colors of the sample galaxies are relatively blue, ranging from to . Unlike our previous assumption presented in section 2, no correlation between B–V and the optical surface brightness was found. The scatter in the B–V results indicates that the galaxies do not share the same properties. This is better demonstrated in the color-color diagram of V–R vs. R–I [Fig. 7a]. The error bar shown there is a typical one, but the points that deviate significantly from the general locus (in the lower right and upper left of the figure) have error bars up to 2.5 times larger that this.
In this diagram, the points are further dispersed due to the variation of H equivalent widths of the galaxies. The H line is included in the broad R band and may change the total R flux of strong-emission-line galaxies. For this reason, the scatter is smaller in the B–V vs. V–I diagram, which is shown in Fig. 7b. However, note that in the galaxy with the most intense H (VCC144), the contribution of the H line to the broad-band R is less than 15%. As in Fig. 7a, the errors of the deviating points here are also larger than the typical ones. Another reason for the scatter may be different amounts of internal extinction in each galaxy, which may arbitrarily shift the galaxy on the diagram, albeit in the general direction of the color-color dependence.


In Figs. 7a and 7b the galaxies with high HI content are marked by triangles and those with low HI content by squares. High surface brightness galaxies are marked by filled symbols and low surface brightness ones by empty symbols. There are clearly not enough low surface brightness objects for meaningful statistical conclusions, but the high surface brightness group shows a difference between the high HI content (filled triangles) and the low HI content (filled squares). They share the same range of B–V color index but the lower HI group seems to have redder V–R color. The sample should be enlarged before clearer conclusions can be drawn about this effect.
The measured H equivalent widths of the galaxies are relatively high, typically 50Å, and up to 159Å. Again, the high surface brightness sub-samples have higher EW[H] than others. This implies that a large fraction of the surface of the galaxies is covered by one or more HII regions. Some BCD galaxies are also known as extragalactic HII regions or HII galaxies. This name is very suitable for some of the sample galaxies. In the case of VCC144, where the equivalent width is 159Å, the entire galaxy is one giant HII region (Brosch et al. 1997b).
The high H flux and EW[H], together with the spatial appearance of the sample galaxies in H, namely the fraction of galactic surface covered by HII regions, emphasize the high SFR of some of the galaxies and the starburst activity that takes place in them. On the other hand, other galaxies in the sample show little or no H emission, which indicates their low current star formation activity. There appears to be no correlation between the H flux and the HI 21cm line flux.
7 Conclusion
We presented observations related to star formation properties of a sample of late-type dwarf galaxies. The intention in focusing on dwarf galaxies was to exclude some of the star formation inducing mechanisms, assumed to account for star formation in large galaxies. In addition, we concentrate on Virgo cluster members, in order to test the effects of the cluster environment on the star formation properties of the galaxies.
A data base consisting of a number of broad-band colors and H line observations is important for determining the ongoing star formation process, as well as the star formation history of the sample. In a subsequent paper we will show that some of the galaxies show signs of a strong burst of star formation, while others completely lack signs of recent star formation activity.
The observational data are affected primarily by internal dust extinction in the galaxies, which complicates the interpretation of the data. This effect will be discussed in detail in the next paper.
Another interesting finding, concerning the dwarf galaxies in Virgo, is their velocity field. Our results suggest an infall of the galaxies towards the cluster core, which may explain partly the skewed recession velocity distribution of the dwarf galaxies, in terms of a Malmquist bias.
Acknowledgments
Observations at the Wise Observatory are partly supported by a Center of Excellence Grant from the Israel Academy of Sciences. UV studies at the Wise Observatory are supported by special grants from the Ministry of Science and Arts, through the Israel Space Agency, to develop TAUVEX, a UV space imaging experiment, and by the Austrian Friends of Tel Aviv University.
EA was supported partly by a grant from ”The Fund for the Encouragement of Research” Histadrut- The General federation of Labour in Israel. NB acknowledges the hospitality of Prab Gondhalekar and of the IRAS Postmission Analysis Group at RAL, as well as IRAS Faint Source catalog searches by Rob Assendorp.
We thank Stuart Bowyer and Tim Sasseen from the Space Sciences Laboratory, Berkeley, University of California, for kindly providing the FAUST images of the Virgo cluster.
References
-
Almoznino. E., Loinger, F. & Brosch, N. 1993, Mon. Not. R. astr. Soc. 265, 641.
-
Binggeli, B., Sandage, A. & Tammann, G.A. 1985, Astron.J. 90, 1681 (BST).
-
Binggeli, B., Popescu, C.C. & Tammann, G.A. 1993, Astron. Astrophys. Suppl. 98, 275.
-
Bowyer, S., Sasseen, T.P., Wu, X. & Lampton, M. 1995, Astrophys. J. Suppl. 96, 461.
-
Brosch, N., Almoznino, E., Leibowitz, E.M., Netzer, H., Sasseen, T.P., Bowyer, S., Lampton, M. & Wu, X. 1995, Astrophys. J. 450, 137.
-
Brosch, N., Formiggini, L., Almoznino, E., Sasseen, T.P., Lampton, M. & Bowyer, S. 1997a, Astrophys. J. Suppl. 111, 143.
-
Brosch, N., Almoznino, E. & Hoffman, G.L. 1997b, Astron. Astrophys. in press.
-
de Vaucouleurs, G., de Vaucouleurs, A., Corwin, H.G. Buta, R.J., Paturel, G. & Fouqué, P. 1991, The Third Reference Catalog of Bright Galaxies, (Springer, New-York).
-
Drinkwater, M. & Hardy, E. 1991, Astron.J. 101, 94.
-
Fouqué, P., Bottinelli, L., Gouguenheim, L. & Paturel, G. 1990, Astrophys. J. 349, 1.
-
Gallagher, J.S., Hunter, D.A. & Tutukov, A.V. 1984, Astrophys. J. 284, 544 (GHT).
-
Gallagher, J.S. & Hunter, D.A. 1986, Astron.J. 92, 557.
-
Gallagher, J.S. & Hunter, D.A. 1989, Astron.J. 98, 806 (GH89).
-
Gallego J., Zamorano J., Rego M., Alonso O. & Vitores A.G. 1996, Astron. Astrophys. Suppl. Ser. 120, 323.
-
Hoffman, G.L., Helou, G., Salpeter, E.E., Glosson, J. & Sandage, A. 1987, Astrophys. J. Suppl. 63, 247.
-
Hoffman, G.L., Williams, H.L., Salpeter, E.E., Sandage, A. & Binggeli, B. 1989, Astrophys. J. Suppl. 71, 701.
-
Hunter, D.A. & Gallagher, J.S. 1985, Astron. Astrophys. Suppl. 58, 533.
-
Kennicutt, R.C. 1983, Astrophys. J. 272, 54 (K83).
-
Kennicutt, R.C. & Kent, S.M. 1983, Astrophys. J. 88, 1094.
-
Kennicutt, R.C. 1989, Large Scale Star Formation & the Interstellar Medium, in ”The Interstellar Medium in External Galaxies”. ed. H.A.Thronson & J.M.Shull.
-
Kennicutt, R.C., Tamblyn, P. & Congdon, C.W. 1994, Astrophys. J. 435, 22.
-
Kunth, D. & Sargent, W.L.W. 1986, Astrophys. J. 300, 496.
-
Landolt, A.U. 1973, Astron.J. 78, 958.
-
Landolt, A.U. 1992, Astron.J. 104, 340.
-
Massey, P., Strobel, K., Barnes, J.V. & Anderson, E. 1988, Astrophys. J. 328, 315.
-
Pogge, R.W. & Eskridge, P.B. 1987, Astrophys. J. 93, 291 (PE87).
-
Pogge, R.W., Goodrich, R.W. & Veilleux, S. 1988, The VISTA Cookbook, Lick Observatory Technical Report No. 50, University of California, CA.
-
Shemi, A., Mersov, G., Brosch, N. & Almoznino, E. 1993, The Prediction of Stellar Ultraviolet Colours, in ”Astronomical Data Analysis Software and Systems III”, ed. Crabtree, D.R., Hamisch, R.J. and Barnes, J. (A.S.P. conference series, Volume 61).
-
Tully, R.B. & Shaya, E.J. 1984, Astrophys. J. 281, 31.
-
van der Hulst, J.M., Kennicutt, R.C., Crane, P.C. & Rots, A.H. 1988, Astron. Astrophys. 195, 38.