Constraints on Cosmic Ray propagation from Radio Continuum data of NGC 2146
Abstract
We present high-sensitivity multi-frequency radio continuum observations of the starburst galaxy NGC 2146. We have fitted these data with a three-dimensional diffusion model. The model can describe the radio emission from the inner disk of NGC 2146 well, indicating that diffusion is the dominant mode of propagation in this region. Our results are indicating that NGC 2146 has recently undergone a starburst, the star forming activity being located in a central bar. The spatial variation of the radio emission and of the spectral index yield tight constraints on the diffusion coefficient and the energy dependence of the diffusion. Away from the central bar of the galaxy the radio emission becomes filamentary and the diffusion model was found to be a poor fit to the data in these regions; we attribute this to different transport processes being important in the halo of the galaxy.
keywords:
Galaxies: individual: NGC 2146, cosmic rays, diffusion, radio continuum: galaxies1 Introduction
Multifrequency radio observations of nearby, face-on galaxies present a unique way to study the Cosmic Ray (CR) propagation within their disks. These studies provide constraints on the main parameters of this propagation, i.e. the value and energy dependence of the diffusion coefficient and the form of the electron energy distribution immediately after acceleration. Furthermore, because of the relatively long radiative life-time of CR electrons (which is in normal, non-starburst galaxies up to several years) such observations also provide information about the temporal evolution of the sources of the CR’s on the same time scale; in turn, since the sites of acceleration are supernova remnants the data are probing the history of star formation on time scales up to of order years.
To date, the parameters describing CR propagation have only been derived for our Galaxy; radio observations are the only way of obtaining information for external galaxies. In this paper we analyse high-sensitivity multi-frequency radio data for the nearby galaxy NGC 2146. Our data have sufficient frequency coverage that we can include in our model fits both a thermal and diffuse synchrotron component for the radio emission.
NGC 2146 is a very luminous radio source ( W/Hz) at a distance of 21.8 Mpc (Benvenuti, Capacioli & D’Odorico 1975, adjusted to =50 km s-1 Mpc). Most of its radio luminosity is due to a compact starburst in its centre. The extent of the radio emission (1.5 arcmin 9.6 kpc) is much less than the extent of the optical emission ( 6 arcmin). This suggests that active star formation (both current and in the recent past) is confined to this central region of NGC 2146. In this paper we are only discussing this inner region of the galaxy ( 1.5 arcmin 0.7 arcmin) that is characterized by the strong radio emission. Optical images of NGC 2146 show it to be a peculiar spiral galaxy (e.g. Benvenuti et al. 1975). Hutchings et al. (1990) have presented a detailed study of NGC 2146 in several wavebands and proposed that the galaxy is in the late stages of a merger which has given rise to an intense burst of star formation in the nucleus.
2 Observations
NGC 2146 was observed with the VLA at 8.4 GHz and 327 MHz, and with the Cambridge 5-km Ryle Telescope (RT) at 5 and 15 GHz. Additionally, existing VLA data at 1.5 GHz (Condon 1983) were available. When the observations of NGC 2146 were made, the RT was operated with a band-width of 280 MHz split into 28 10-MHz frequency channels; together with the minimum baseline of 18 m this provides excellent temperature sensitivity at both 5 and 15 GHz.
For the RT observations a total of five telescope configurations at each observing frequency were employed giving a nearly fully filled aperture out to the maximum baseline. A minimum of two 12-hour runs in each configuration were obtained; any data of poor quality were rejected. This gave a resolution approximately arcsec2 at 15 GHz and arcsec2 at 5 GHz. At 5 GHz observations of phase-calibrators were made at the beginning and end of each run, while at 15 GHz calibration observations were interleaved with those of NGC 2146. 3C 286 and 3C 48 were observed regularly as flux calibrators. Calibration and data-editing (principally to remove narrow-band and time-varying interference) was performed in the MRAO package Postmortem, with subsequent reduction in AIPS and the MRAO package Anmap.
The 8.4-GHz VLA observations were in the B, C and D arrays with the 327 MHz observations in A array only; the observations were performed during 1990/91. Reduction of the data followed standard VLA procedures with calibration, editing and imaging performed in AIPS.
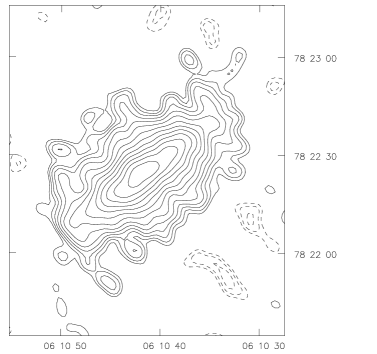
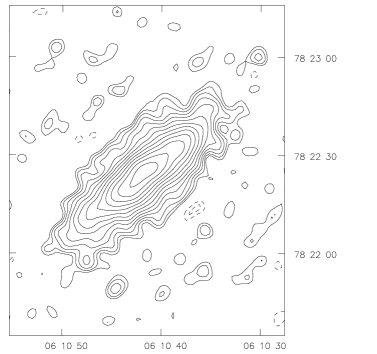
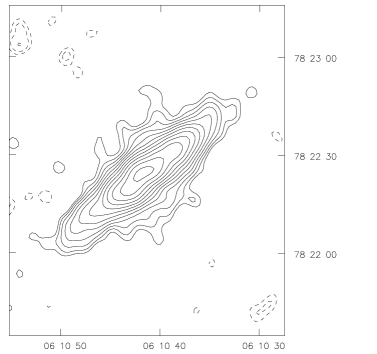
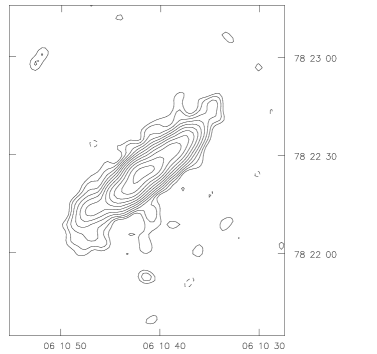
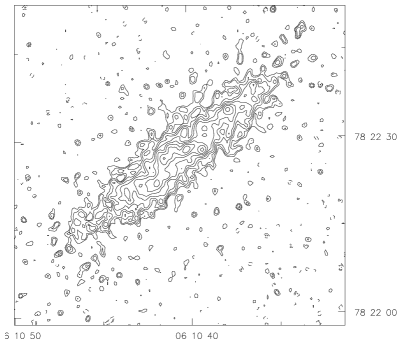
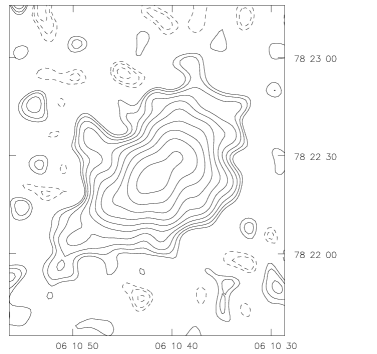
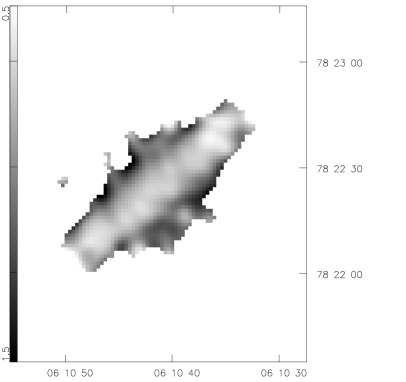
A number of maps were made at each frequency by tapering the aperture-plane to highlight structure on different angular scales. For the spectral comparison we used only the four highest frequencies and all the maps were made with very similar aperture plane coverage, CLEANed and restored (or convolved in the case of the 1.49 GHz image) to a common resolution of arcsec2. All maps have been corrected for the primary beam response of the telescope used to make the observations. This set of four images is shown in Fig. 1, together with a high-resolution image at 15 GHz in Fig. 2 and the 327 MHz image in Fig. 3. In Fig. 4 a map of the spectral index between 1.5 and 8.4 GHz is shown.
3 Radio properties of NGC 2146
Most of the radio emission of NGC 2146 lies along an elongated, bar-like structure in position angle coincident with the optical major axis (143∘, Benvenuti et al. 1975). This elongated shape could be a disk viewed from a high inclination or it could be due to a real bar-like shape of the sources of the CR’s. From the radio data at one frequency alone it is not possible to distinguish between these two cases. However, as will be shown in the following, the variations of the radio spectral index together with a model for the CR propagtion allow to draw conclusions about the shape of the CR sources. In the high resolution image (Fig. 2), the sources at 15 GHz show a distinctive S shape that had already been noticed in earlier observations by Kronberg Biermann (1981). The central region is shown in our highest resolution images to contain a number of luminous unresolved sources superimposed on the general background emission.
At higher frequencies NGC 2146 appears more compact and shows relatively little emission away from the major axis of the radio emission while at lower frequencies the emission has an irregular appearance and several extensions perpendicular to the major axis which are prominent particularly in the 1.5 GHz and the 327 MHz images.
4 Modelling the radio emission
Our aim in this work is to explain the multi-frequency radio data by a combination of thermal emission and non-thermal synchrotron radiation from CR electrons which have propagated away from the sites where they have been accelerated. The thermal component arises in H ii regions, whereas supernova remnants (SNRs) are believed to be, at least from energetic considerations, the most likely source of CRs (e.g. Berezinsky et al. 1990, Völk 1992).
The propagation of the CR electrons is described by a standard three dimensional diffusion model (e.g. Ginzburg & Syrovatskii 1964). Other modes of propagation, such as convection, may also be important especially in the halo (e.g. Hummel Dettmar 1990) at large distances from the galactic plane, but for the sake of simplicity we do not take this into account explicitly. Our approach, therefore, is to determine to what extent we can explain the observations using a simple diffusion model alone.
The diffusion equation describing the evolution of the electron distribution function is as follows:
| (1) | |||||
where is the diffusion coefficient, assumed to be spatially homogeneous and isotropic. The diffusion coefficient is assumed to depend on the energy as
| (2) |
which is in agreement with observations of CRs in our Galaxy (see e.g. Berezinsky et al. 1990). In the energy range relevant to our radio observations ( GeV), the energy losses of the electrons are mainly synchrotron and inverse Compton
| (3) | |||||
where is the Thompson scattering cross section, the speed of light, the energy density of the magnetic field and the energy density of the radiation field below the Klein-Nishima limit (e.g. Longair 1992).
For the source function we make the following assumptions:
-
1.
The total source distribution can be separated and expressed as the sum of individual sources i.e.
(4) -
2.
CRs are produced only by SNRs from massive stars (). The source spectrum is assumed to be a power-law in energy and to be identical for all sources
(5) Here, is the SN rate and is the number of relativistic electrons produced on average per energy interval by a SNR.
-
3.
The spatial distribution of a source is approximated by an ellipsoid, gaussian distribution
(6) with () indicating the site of the centre of the source and the axes of the ellipsoid. In the following, we will identify the major axes of NGC 2146 with the x-axis, the direction within the galactic plane perpendicular to the major axis with the y- and the direction perpendicular to the plane with the z-axis.
Eq.(1) can be solved for an infinite space following the analysis of Syrovatskii (1959). In a steady-state situation (i.e. for constant sources) the electron distribution function is given by:
| (7) | |||||
where are the upper and lower end of the range of electron injection energies and is given by:
| (8) | |||||
If temporal changes are important, a similar solution for can be derived. The synchrotron emission is derived from with the simplifying assumption that each electron emits its synchrotron radiation at the maximum frequency of the synchrotron spectrum.
| (9) |
with the emitting frequency being
| (10) |
where is the gyrofrequency.
The thermal emission is also described as arising from ellipsoidal sources, that are not necessarily the same as the CR sources
| (11) |
Both, and have to be integrated through the halo along the line of sight, taking into account the inclination angle of the galaxy, and convolved with the beam. The total radio emission, , is finally obtained as the sum of and .
5 Fitting the model to the radio data
In order to keep the diffusion model as simple as possible we shall assume a steady state, i.e. we attempt to fit a model in which the star formation rate and hence the sources of thermal and non-thermal emission do not show any temporal variations. In NGC 2146 the estimated life-time of CR electrons is, due to the high radiation losses (see below), extremely short (less than years). On these short time scales the assumption of a steady state seems reasonable. Furthermore we will assume as the simplest case that H ii regions and supernova remnants are co-spatial (at least at the resolution of our radio images). This will be a good approximation if the sites of star formation have not changed during the past years, i.e. the life-time of supernova progenitors (). If there has been significant propagation of the star formation process through the galaxy then this assumption must be modified.
Additionally we can constrain some of the parameters directly from observational data.
1) The inclination of NCG 2146 is (Benvenuti et al. 1975). Due to the disturbed appearance of NGC 2146 the inclination angle is unlikely to be precisely determined; we shall adopt this value and discuss this point more fully in Section 6.1. The radius of the CR sources perpendicular to the disk is taken to be pc, which is a typical scale height of the molecular gas disk (e.g. Unsöld & Baschek 1991) in which we expect massive star formation to be located.
2) We estimate the magnetic field by applying a minimum energy calculation. We adopt standard values for most parameters: a frequency range of GHz; radio spectral index 0.7 (here and in the following we define the spectral index as ); ratio of total energy of CR’s to total energy of electrons . For measured quantities we use the emission at 1.5 GHz. We obtain the volume of the emitting region at this frequency by assuming that it can be approximated by a cylinder with a height 1 kpc and a radius of 45 arcsec ( 5kpc) which corresponds to the lowest contour of the 1.5 GHz image. With these assumptions we obtain .


The energy density of the radiation field, , can be calculated from the bolometric luminosity:
| (12) |
For NGC 2146 the greatest part of its luminosity is emitted in the far-infrared (FIR); we therefore approximate the bolometric luminosity by the far-infrared luminosity . For the radius we take the radius derived from our radio data ( kpc) as this will correspond to the region in which most star formation is currently occurring. With these assumptions we obtain eV cm-3. The energy density of the radiation field, , can be calculated from the bolometric luminosity:
| (13) |
For NGC 2146 the greatest part of its luminosity is emitted in the far-infrared (FIR); we therefore approximate the bolometric luminosity by the far-infrared luminosity . For the radius we take the radius derived from our radio data ( kpc) as this will correspond to the region in which most star formation is currently occurring. With these assumptions we obtain eV cm-3.
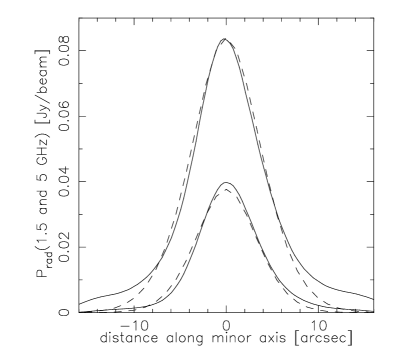
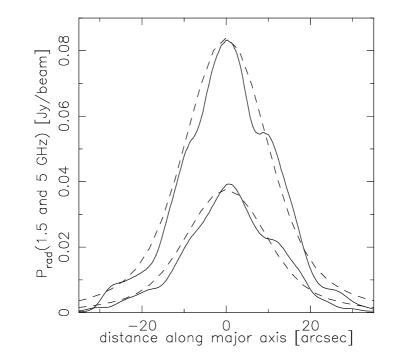
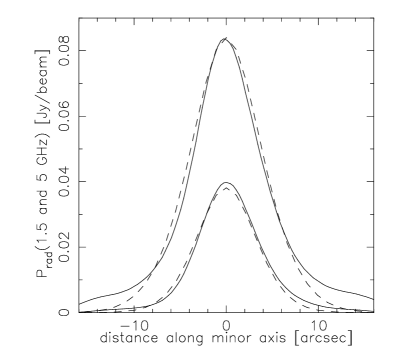
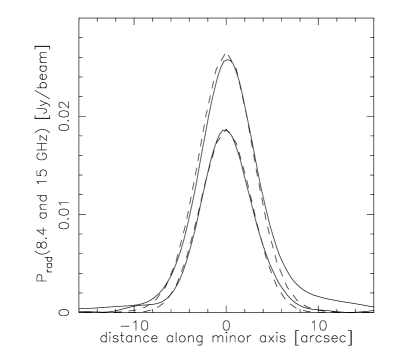
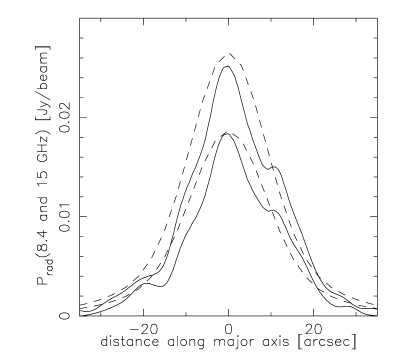
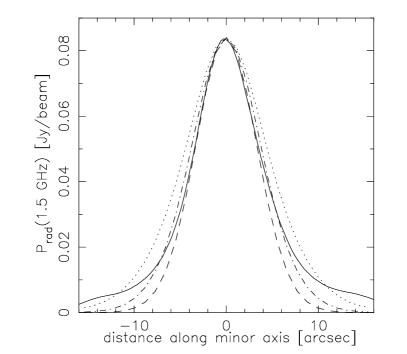
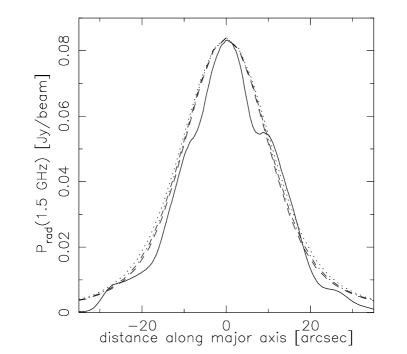
With these derived values, the fitting of the diffusion model now proceeds by fitting to slices extracted from our multi-frequency radio images along both the major and minor axis of NGC 2146. In Figs. 5 and 6 we show the observational data and the corresponding model fits.
In constraining the parameters for the model we note some general features of the data.
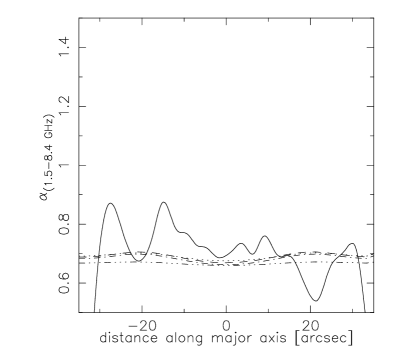
i) The spectral index between 1.5 and 8.4 GHz is approximately constant along the major axis (Fig. 8a); this suggests that the CR source is itself extended in this direction unless the diffusion coefficient had a strong energy dependence with . (In this latter case (Eq. 8) would be largely independent of the electron energy and hence the spatial distribution of the electrons would also be energy independent (see Eq. 7)).
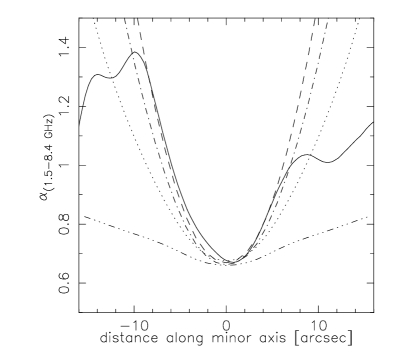
ii) The steepening of the spectrum away from the major axis (Fig. 8) indicates that is considerably less than one and that the electrons must have suffered from energy losses.
iii) The radio flux decreases away from the centre of the galaxy both along the major and minor axis (Figs. 5 and 6).
Taken together, these observations suggest that the model should have the following general characteristics:
-
•
The source distribution is extended along the major axis but not along the minor axis, i.e. it has the shape of a bar.
-
•
The energy dependence of the diffusion coefficient, , must be considerably less than unity, and is constrained by the data along the minor axis of NGC 2146.

The fitting of the model to the observational data now proceeds by a straightforward search of parameter space for model parameters which lead to the best fit of the multi-frequency radio data. The model most strongly constrains the spatial distribution and strength of the thermal and non-thermal emission regions, and also the energy dependence of the diffusion coefficient. Our results and conclusions for the simplest form of the model without temporal variations are shown in Fig. 5 and can be summarized as follows.
1) The source structure cannot be adequately represented by a single ellipsoidal emission region. Two sources, both centred at the maximum of the radio emission, are necessary to account for the data. Our best fit parameters for these two sources are:
- -
-
source 1: kpc, kpc, relative intensity 1
- -
-
source 2: kpc, kpc, relative intensity 0.3
We interpret this result as suggesting that the distribution of CR sources and hence star formation activity is in the form of a bar. The parameters describing source 1 are relatively well constrained by the shape of the radio emission (for a fixed value of the galaxy inclination). The parameters of source 2 are less well constrained, however this has a relatively minor effect on the other model parameters.
2) The injection index of the electron population is and we infer a low thermal fraction of per cent at 15 GHz. The thermal fraction is constrained by the radio spectrum at the centre of the galaxy.
3) It is clear from Fig. 5 that we are not able, with the simplest form of the model, to get good fits to the data over the whole frequency range: At 5, 8.4 and 15 GHz the model predictions for the peak radio emission are either slightly too low or too high. The discrepancies however never exceed 10 and it should furthermore be noted that the shape of the radio emission can be reproduced well at all frequencies.
The results obtained by allowing for temporal variations in the star formation rate, while keeping the source distribution constant are shown in Fig. 6. In this case, an injection index of is used and the temporal variations are assumed to have a simple form with injection of CR electrons having stopped years ago. The predicted thermal contribution is now much greater than in the steady-state model. At 15 GHz the emission is almost completely thermal and at 1.5 GHz the thermal fraction is still per cent. The time-dependent solution produces an improved model fit as it permits an aged electron population to develop. In general, for both the steady-state and time-dependent cases, the fits along the major axis are worse than those along the minor axis — this is because of the structure of which reflects the complicated intrinsic source structure (see Fig. 2) which we have not taken into account. However, this does not significantly effect are conclusions concerning propagation of CR to be discussed below.
4) The value of the diffusion coefficient , and its energy dependence, is strongly constrained by the data perpendicular to the inferred bar within NGC 2146 along the minor axis. Furthermore, the results are very similar for both the steady-state and a time-dependent models. In Fig. 7 we show the results for the steady-state case – the best fit for the diffusion coefficient is cm2 s-1, with . The shape of the spectral index distribution along the minor axis depends sensitively on , which is illustrated in Fig. 8. Our best estimate for is in the range with a firm upper limit of .
6 Discussion
6.1 Model uncertainties
As illustrated in Fig. 5-8 the model describes the data well and allows us to constrain important parameters such as the diffusion coefficient and its energy dependence and infer the existence of a central bar. The error in the determination of these parameters depends however not only on the quality of the model fit, but also on a number of parameters that were determined independently such as , the inclination angle and distance of the NGC 2146.
In order to fit the spectral data a model that produces a break in the synchrotron spectrum is required – this is evident from the data since the spectrum at the centre of NGC 2146 steepens between 5 and 8.4 GHz before flattening towards 15 GHz which we attribute to thermal emission. The simplest way to achieve such a break is to assume some temporal dependence of the CR injection and hence of the star-formation rate. The time-scale of the changes implied by the data is rather short, less than years, however there is a strong dependence on and : . Whereas our estimate for does not suffer from large uncertainties, is very uncertain and an improved estimate would require an independent determination of the magnetic field.
The main sources of error for the diffusion coefficient, , are the uncertainty in , , the distance to NGC 2146 and the assumed structure of the emitting region. In principle it could be possible to increase/decrease the size of the CR source along the minor axis () and try to fit the data by decreasing/increasing . If is very small, even with a large value of the model cannot produce the observed shape of . On the other hand, a larger assumed source size would make it impossible to fit the spectral variations unless we assumed that either the injection index of the CR population varied within the disc of the galaxy, and/or that different regions of the galaxy had undergone very different star-formation histories. Within the range of acceptable the estimated values for all lie within our quoted error bounds. The uncertainty in the inclination angle of NGC 2146 does not affect our estimates of and greatly and it most strongly affects the assumed source size. Our conclusion regarding the bar-like shape of the star forming region depends therefore sensitively on the assumed inclination angle. However, only for a severe underestimate of the true inclination angle of NGC 2146 (i.e. if ) this conclusion cannot be maintained. In this case the radio emission along the minor axis would be almost entirely from the halo.
6.2 CR propagation in the central disk and halo
The diffusion model is a good fit to the radio data for NGC 2146 along the major axis of the galaxy and along the minor axis for distances less than 10 arcsec (2.6 kpc) from the major axis. This suggests that diffusion is the dominant mode of propagation in this region which corresponds to the inner, most actively star forming disc of NGC 2146.
At distances greater than 10 arcsec from the centre of the galaxy along the minor axis the model is no longer an adequate fit to the data (Figs. 5 and 6). The shape of the 1.5 GHz emissivity is very flat suggesting that transport of CR electrons is more efficient than would be expected from diffusion alone. Furthermore, the spectral index flattens which indicates that (i) the energy losses have decreased rapidly, or (ii) the diffusion coefficient increases, or (iii) a much faster process than diffusion is responsible for the transport of the CR electrons. Upon examination of the radio emission in the region where the diffusion model begins to fail we note that the radio images (Figs. 1 and 3) show filamentary structure. The most likely reason for this behaviour is that away from the centre of the galaxy a large fraction of the radio emission is from a halo which is seen in projection.
The propagation of CR electrons in the halo might be more complicated than we have considered for the propagation within the disc. Evidence for this comes from observations of the edge-on galaxies NGC 891 and NGC 4631 where extended radio continuum emission in the halo with a rather flat spectral index has been observed (Hummel 1991). Breitschwerdt (1994) has explained this flat spectral index in a galactic wind model including diffusive and convective transport of CR’s. Siemieniec and Cesarsky (1991) modelled the spectral index in the halo of NGC 891 by a diffusion model with an outwardly increasing diffusion coefficient. Both galaxies show that in the halo the propagation of CR electrons is faster than that predicted by steady-state diffusion alone.
Due to the strong star formation activity in NGC 2146, an outflow from the disc triggered by correlated SN explosions may be present, a mechanism which is variously described as a “galactic fountain” (Shapiro & Field 1976) or “chimney” model (Ikeuchi 1988, Norman & Ikeuchi 1989). Such an outflow would transport CR’s and magnetic field into the halo and could therefore account for a higher radio emission in the halo than expected from a pure diffusion model. The analysis of X-ray and optical data of NGC 2146 (Armus et al. 1995) has shown that there are indeed indications of the existence of such a starburst-driven superwind.
6.3 Star formation in NGC 2146
Hutchings et al. (1990) proposed that NGC 2146 is in the late stage of a merger. The merger must have begun years ago as the rotation curve does not appear to be disrupted in the outer regions of the galaxy (Young et al. 1988a, show the inner regions of the galaxy to have non-circular motions of the order of 100 km s-1). In this scenario material has collapsed into the centre of the galaxy and a starburst has commenced in the nucleus.
The data and model presented in this paper further emphasize that active star formation is confined only to the centre of the galaxy. The radio images show that the star formation activity is located in a peculiar spiral S shape around the peak of the radio emission. The merger may have triggered the formation of a bar which feeds the nuclear starburst with material and is responsible for the unusual structure of the radio emission. Star formation is proceeding all along the central bar, and the nucleus is not prominent in the high-resolution radio images. Young et al. (1988a) suggest that if the galaxy is in the late stage of a merger the nucleus of the merging companion could be obscured by the dust lane. The images of the radio emission presented here argue against this as we do not find two spatially distinct peaks of radio emission which could be identified as the nuclei of the merging systems. Instead, the star formation is distributed throughout the bar-like central region. The unresolved sources seen on our highest resolution images have sizes of less than 100 pc and may represented isolated pockets of star formation or could be individual high-luminosity supernovae as seen in M82 (Muxlow et al. 1994). The presence of dynamical features such as the arm in the H emission (Young, Kleinmann & Allen 1988b) and the bar in the radio emission suggest that this starburst is dynamically driven, i.e. due to a merger or an interaction.
Acknowledgements: The VLA is operated by the National Radio Astronomy Observatory for Associated Universities Inc., under a cooperative agreement with the National Science Foundation. UL gratefully acknowledges the receipt of a postdoctoral fellowship of the Deutsche Forschungsgemeinschaft (DFG). We would like to thank the referee, Prof. Davies, for useful comments.
References
- [] Armus L., Heckman T.M., Weaver K.A., Lehnert M.D., 1995, ApJ 445,666
- [] Benvenuti P., Capacioli M., D’Odorico S., 1975, A&A 41, 91
- [] Berezinsky V.S., Bulanov S.V., Ginzburg V.L., Dogiel V.A., Ptuskin V.S., 1990, Astropysics of Cosmic Rays, North Holland
- [] Breitschwerdt D., 1994, Habilitationsschrift, Universität Heidelberg
- [] Condon J.J., 1983, ApJS 53, 459
- [] Ginzburg V.L., Syrovatskii S.I., 1964, The Origin of Cosmic Rays, Pergamon Press, Oxford
- [] Hutchings J.B., Neff S.G., Stanford S.G., Lo E., Unger S.W., 1990, AJ 100, 60
- [] Hummel E., 1991 in The Interstellar Disk-Halo Connection in Galaxies, ed. H. Bloemen, Kluwer, 257
- [] Hummel E., Dettmar R.-J., 1990, A&A 236, 33
- [] Ikeuchi S., 1988, Fund. Cosmic Phys., 12, 255
- [] Kronberg P.P., Biermann P., 1981, ApJ 243, 89
- [] Longair M.S., 1992, High Energy Astrophysics, Vol. 1, Cambridge University Press
- [] Muxlow T.W.B., Pedlar A., Wilkinson P.N., Axon D.J., Sanders E.M., DeBruyn A.G., 1994, MNRAS 226, 455
- [] Norman C. A., Ikeuchi A., 1989, ApJ 345 372
- [] Siemieniec G., Cesarsky C., 1991, A&A 245, 418
- [] Shapiro P.R., Field G.B., 1976, ApJ 205, 762
- [] Syrovatskii S.I., 1959, Soviet Astronomy Vol. 3, No. 1., 22
- [] Völk H.J., 1992, in Particle Acceleration in Cosmic Plasma, eds. G.P. Zank and T.K. Gaisser, AiP Conf. Proc. 264, AiP, New York, 199
- [] Unsöld A.,Baschek B., 1991, The New Cosmos, Springer-Verlag, Heidelberg
- [] Young J.S., Kleinmann S.G., Allen L.E., 1988b, ApJ 334, L63
- [] Young J.S., Claussen M.J., Kleinmann S.G., Rubin V.C., Scoville N., 1988a, ApJ 331, L81