HUBBLE SPACE TELESCOPE IMAGING OF STAR-FORMING GALAXIES AT REDSHIFTS 11affiliation: Based on obervations with the NASA/ESA Hubble Space Telescope obtained at the Space Telescope Science Institute which is operated by AURA under NASA contract NAS 5-26555.
Abstract
We present Hubble Space Telescope images of star-forming galaxies at redshifts . These galaxies have been selected using ground–based images and color criteria sensitive to the presence of a Lyman discontinuity in the otherwise flat (in units) UV spectral energy distribution of unreddened star formation. The spectroscopic confirmation of these galaxies is reported in a companion paper (Steidel et al. 1996). The HST images, which probe the rest-frame UV between 1400 and 1900 Å, show that the morphologies of the galaxies are generally compact and exhibit a relatively high degree of spherical symmetry, although we find a few cases of more diffuse light profiles and several cases where the objects are comprised of multiple compact structures. Overall, the dispersion of morphological properties is relatively narrow, in contrast to the variety found in star-forming galaxies at intermediate redshifts (). The galaxies with compact morphology are typically characterized by a small but resolved “core”, approximately arcsec in radius, or about () kpc with (0.05), and half-light radii of 0.2–0.3 arcsec, or – (–) kpc. These sizes and scale lengths are similar to those of present-day bulges or intermediate-luminosity spheroids. The “cores” are often surrounded by lower surface-brightness nebulosities, generally asymmetrically distributed. The minority of more diffuse galaxies do not possess this core, and an exponential function provides a very good fit to their light profiles. In contrast to highly elongated or irregular structures, such as “chain galaxies”, that are found at , the galaxies are characterized by a relatively high degree of spherical symmetry. The morphological properties, space density, star-formation rates, masses, and early epoch of the star-formation phase all support the hypothesis that we have identified the progenitors of present-day luminous galaxies at the epoch when they were forming the stars of their spheroidal components.
1 INTRODUCTION
The physics of galaxy formation remains largely unconstrained from an empirical perspective. In the last few years, several deep redshift surveys (Lilly et al. 1995a and 1995b; Steidel et al. 1995; Glazebrook et al. 1995a; Cowie et al. 1994; Cowie, Hu & Songaila 1995a) and deep post-refurbishment HST imaging (Driver et al. 1995a and 1995b; Glazebrook et al. 1995b; Schade et al. 1995; Cowie Hu & Songaila 1995b) have extensively probed the evolutionary state of galaxies at intermediate redshifts (), corresponding to ()% of the life of the Universe ( km-1 Mpc-1 and (). This work seems to show that the evolution of the luminosity function has followed rather diverse tracks for galaxies of different luminosity and morphological type. A common conclusion is that the population of luminous galaxies, i.e., the systems currently identified as relatively massive ellipticals and spirals, are characterized by at most a modest amount of evolution in luminosity and/or number density since . The available data therefore suggests that the epoch of formation of the most massive and oldest systems predates that probed by the current surveys. While there has evidently been substantial evolution of later type systems in number and/or luminosity in the relatively recent past, the population of galaxies possessing a substantial spheroidal component (i.e., ellipticals and early–type spirals) has been remarkably quiescent over the redshift range probed by the redshift surveys, suggesting that the important epoch for their formation lies far beyond . The fact that spheroidal systems, which contain approximately half of the present-day stars (Schechter & Dressler 1987), had assembled rather early in the course of the evolution has long been the rationale for searches for “primeval” galaxies. Establishing the epoch and the formation mechanism of these systems will place significant constraints on theories of galaxy and structure formation.
In a companion paper (Steidel et al. 1996, S&96 hereafter) we report the discovery of a substantial population of star-forming, but otherwise normal (i.e. non– AGN), galaxies at redshifts . These galaxies were found using color criteria sensitive to the presence of a Lyman discontinuity (due to a combination of a galaxy’s opacity to its own UV continuum radiation, the intrinsic energy distribution of hot stars, and the opacity of intervening gas at high redshift) in the otherwise flat (in units) and featureless spectral energy distribution (SED) of unreddened star formation (see Steidel, Pettini, & Hamilton 1995).
The color criteria are very efficient in selecting galaxies at high redshifts, and although we have been able only recently to confirm them spectroscopically, over the last few years we have been collecting a fairly large sample of galaxy candidates (Steidel & Hamilton 1992, 1993; Steidel et al. 1995; Giavalisco et al. 1996, in preparation) and we have been investigating their morphological properties with the Hubble Space Telescope (HST) (see, e.g. Giavalisco et al. 1995). At the time of this writing, only 23 galaxies out of about 100 have securely measured redshifts. However, as we have detailed in S&96, we expect that a very high fraction, probably %, of the candidates not yet spectroscopically confirmed are also in our targeted redshift range of . We have already presented a number of arguments linking the population we have identified with the luminous galaxies of the present epoch (S&96). In this paper, we present deep HST images of 19 of the “Lyman break” galaxies, 6 of which have secure redshift measurements in the range . The images probe the rest-frame UV spectrum in the range – Å and have resolution high enough that we can attempt a quantitative discussion of their morphological properties. Thus, for the first time, we can characterize in a statistically significant way the evolutionary status of galaxies at a time when the universe was % of its current age.
2 THE DATA
The data set consists of images obtained with HST and WFPC2 of 19 galaxies from 3 fields, which we designate by their approximate coordinates, 0000-263, 0347-383, and 2217-003, respectively, for a total of 7 different HST pointings, with 4 independent pointings in the 22 hour field. The two fields 0000-263 and 0347-383, the former imaged through the F606W and F702W passbands, the latter through the F702W only, were observed by us to follow-up the ground-based detections of the galaxies and galaxy candidates presented by Steidel & Hamilton (1992), Giavalisco, Steidel & Szalay (1994), and Steidel, Pettini & Hamilton (1995). For the remaining 4 fields, which have all been observed through the F814W passband, we have followed the inverse strategy of performing our ground–based photometric searches for galaxies in existing deep HST fields to improve the overall observing efficiency. The case of the 2217-003 field is particularly fortuitous, as 4 different HST pointings are available for it, all of which could be contained within a single pointing of the COSMIC camera at the prime focus of the Palomar 5m telescope during the primary ground-based search. In this field, called SSA22 in their nomenclature, Cowie et al. (1995b) obtained one HST pointing to follow-up their -band selected galaxy survey, while Lilly et al. (1995, HST Cycle-5 observations, private communication) obtained 3 more pointings to follow-up their Canada-France Redshift Survey. We have identified 2 candidates, one spectroscopically confirmed, in the SSA22 field, and 3 in the Lilly et al. fields, a total of 4 of which are presented in this work (one of the Lilly et al. fields was not available at the time of this writing). The details of the HST exposures used in the present work are summarized in Table 1.
In the 0000-263 field, because the spectral energy distribution (SED) of the galaxies is essentially flat (in units) and the images in the 2 passbands have comparable S/N, we have registered and added them together to obtain a deeper exposure, with appropriate adjustments to the photometric zero point. Although the equivalent band width of this combined image is Å, the rest-frame portion of the spectrum which it probes is Å wide, only % wider than the B1 passband adopted for the UIT camera in the Astro-1 and Astro-2 missions (Stecher et al. 1992). With the exception of galaxy 0000-263-C10, observed only in the F606W frame, all of the galaxies in the 0000-263 field are included in the combined frame used for the morphological analysis.
Table 2 presents the sample of galaxies observed (for convenience we used the same nomenclature as in S&96), detailing redshift (when available), passband, aperture and isophotal magnitudes in the system, star-formation rates (when redshift is available) computed from the isophotal magnitudes using the “continuous star formation models” by Leitherer, Robert, & Heckman (1995) with a Salpeter initial mass function and upper mass cut-off of M⊙ (see also discussion in S&96), and morphological parameters (see discussion below), including measures of the axial ratios in the last column. As it can be noted, in a number of cases the magnitudes in the arcsec aperture are actually slightly brighter than the isophotal magnitudes, in all cases by an amount smaller than mag. This is due to the errors associated with the magnitude measurements at these flux levels, and to the compactness of the galaxies, as we discuss in the next section.
3 THE MORPHOLOGY OF GALAXIES AT
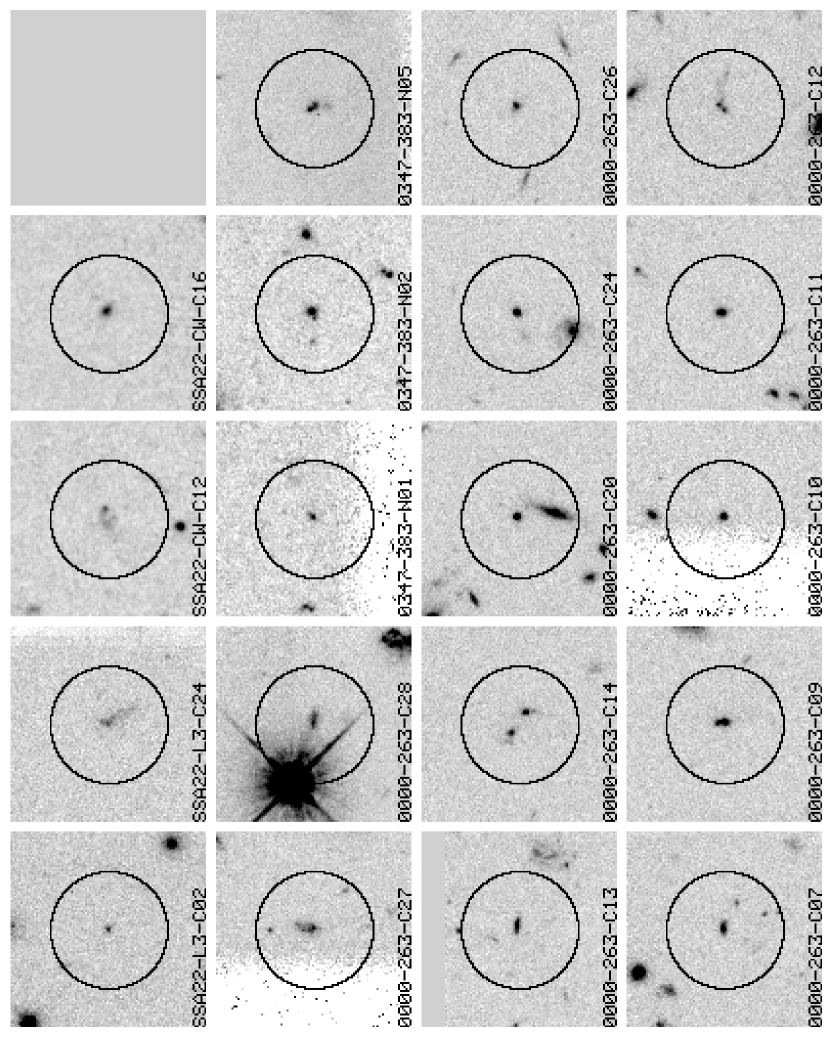
Figure 1 shows a mosaic of the galaxies. Figure 2 presents a mosaic of their radial profiles. From a visual inspection of the two figures it is clear that the majority of the galaxies have compact morphologies, typically characterized by a bright “core”, often surrounded by more diffuse nebulosities with significantly lower surface brightness. The core is typically arcsec in radius, with a characteristic central surface brightness mag arcsec-2. The nebulosities clearly deviate from the core profile. However, there are 4 cases of more diffuse galaxies in the sample, C13, C27, and C28 in the 0000263 field (we note that C28 is a candidate damped Lyman absorber in the spectrum of Q0000263–see Steidel & Hamilton 1992), and C24 in the SSA22-L3 field. The diffuse galaxies have larger sizes than the compact galaxies, do not possess an obvious “core” and have lower central surface brightness. There are also 2 cases of “double-core” galaxies, SSA22-CW-C12 and 0000-263-C12 (no radial profile has been plotted for this last galaxy, given the very close proximity of the two “cores” and the difficulty in defining a central light concentration). Finally, the galaxy 0000-263-C14, appears to be an interacting system.
We have quantitatively examined the morphology of the galaxies in two ways. To analyze their radial light profile we fit elliptical isophotes to the HST images. In principle, one should fit the center, ellipticity and position angle of each individual isophote. However, the presence of the substructures and the relatively small number of pixels that comprise the image make this method inaccurate. We adopted a procedure wherein we used the center derived from the inner isophote (typically ); keeping this center fixed, we selected whatever combination of ellipticities and position angle best fit the radial light profiles. In practice, we fit each radial profile with both an and an exponential law to determine which of the two best describes each galaxy.
These fits are intended to broadly classify the light profiles and are not meant to imply that a particular galaxy rigourously follows a given model. In addition, we caution that we are fitting functions designed to model the light distribution of present-day galaxies at Å rest-frame, and characterized by a very modest amount of star formation, to galaxies at observed at Å rest-frame and with a star-formation rate one order of magnitude (or more) higher. Clearly, we do not yet know whether the same physical interpretations relating morphology to the dynamical state of the galaxies would hold. In Figure 2, we show the fitted (continuous) and exponential (dotted) laws, while in Table 2 we report which of the two functions provides a better fit, together with the scale length ( for the former, for the latter).
Because of the approximate nature of the analysis above, we have not derived measures of the light concentration from the parameters of the fit, as deviations from the adopted model and inaccurate modelling of the wings of the light distribution would have resulted in large errors. Rather, we have measured the isophotal magnitude (using FOCAS) and a set of concentric aperture magnitudes, centered at the peak of the light distribution (the centering box had a size of 5 pixels), to produce a growth curve and derive the half-light radius. These magnitudes (including the aperture sizes), and the half-light radii (one relative to the ”core”, defined to have arcsec, and one to the whole galaxy) are collected in Table 2.
Only 6 galaxies out of 19 in the HST sample have rigorously measured redshifts (see S&96 for the complete list of secure redshifts). However, the efficiency of the color selection is very high, with about % of those attempted spectroscopically being confirmed, and with the remaining % indeterminate but still consistent with the same range of redshifts (there are no cases of “interlopers” observed so far, i.e., galaxies with redshifts less than the targeted range). In the following discussion we have assumed that all 19 of the galaxies are indeed at high redshift.
Finally, two galaxies (0000-263-C14 and SSA22-CW-C12) clearly show a structure in the form of double nuclei. In these cases it is not possible to compute a unique position for the centroid of the light distribution; therefore, we have carried out the above analysis for the two sub-components separately. In Table 2 these objects are labeled with an “a” and a “b” suffix following the name of the galaxy. In each case, the 2-D spectrograms showed that the two sub-components of the galaxies are both placed at the same redshift.
4 DISCUSSION AND CONCLUSIONS
Ideally, one would like to understand the nature of the galaxies and their place in a general scheme of galaxy evolution. Although this will certainly require additional work, several interesting results have already emerged from the analysis of the HST images:
1) Most of the galaxies are characterized by a compact morphology, generally having one central “lump” where the majority of the light is concentrated. The size of the central concentration is typically arcsec in diameter, which at redshift (the mean value for our survey) corresponds to () kpc. In the following, we refer to this central lump as the “core”. The core typically contains about –% of the total luminosity of the galaxy, and has a half-light radius in the range 0.2–0.3 arcsec, corresponding to – (–) kpc. Since at the observed rest-frame far–UV wavelengths the emission is directly proportional to the formation rate of massive stars, one can conclude that –% of the stars that are being formed in these galaxies are concentrated in a region whose size is that of a present-day luminous galaxy. Moreover, the characteristic central concentration of the star formation has a scale size similar to a present–day spheroid. If the morphology of the massive stars is a good tracer of the overall stellar distribution, then the light distribution of the core is consistent with a dynamically relaxed structure.
2) The core is very often surrounded by low surface brightness nebulosities, generally distributed asymmetrically, and which may extend for a few arcsecs (see, e.g. 0000-263-C09 and 0347-383-N05). These nebulosities are clearly observed in Figure 2 as deviations from the more regular profile of the core. We note that the presence of such halos is consistent with the intense star-formation activity observed in the galaxies, even if the morphology of the underlying stellar distribution is relatively regular. For instance, the presence of extended gaseous components is expected from the intense supernovae rate that must apply in these systems (Ikeuchi & Norman 1991). Also, halos with irregular morphology and lower are consistent with the dissipative collapse (Baron & White 1987) of the cores. In such a scenario a core-halo segregation is actually expected due to the increased cloud collision rate and in the denser, more collapsed regions (Silk & Norman 1981).
3) The central SB of the compact galaxies is consistently 23 mag arcsec-2. At the observed rest-frame wavelengths, the surface brightness is proportional to the star-formation efficiency. Given that these galaxies all have comparably small UV extinction, we can conclude that they have also comparable star-formation efficiency, possibly indicative of the interplay of similar physical processes in the core regions.
4) There are 4 cases of diffuse galaxies, namely 0000-263-C13, 0000-263-C27, 0000-263-C28 and SSA22-L3-C24, whose light profiles are very well fitted by exponential laws. The central surface brightness of these galaxies is significantly lower than that of their more compact counterparts, showing an overall reduced star-formation efficiency. Interestingly, galaxy 0000-263-C28 is a candidate to be one of the 2 known damped Lyman systems in the spectrum of Q0000-263, either at or .
5) In 3 cases out of 19, SSA22-CW-C12, 0000-263-C12, and 0000-263-C14, we observe galaxies with a multiple morphology, where two major light concentrations with similar apparent luminosity, two “cores” in our terminology, are separated by about 1 arcsec or less, corresponding to () kpc. The two individual sub-components are spatially resolved in the first case, where one is much more concentrated than the other, barely resolved in the second case, and too small to conclude anything in the third case. In all cases, the galaxies clearly show extended diffuse nebulosity around or extending from them, which is suggestive of systems in interaction. This could be interpreted as evidence of hierarchical merging of sub-units into more massive systems, taking place with time scales about an order of magnitude shorter than the time span probed by the redshift range , or yr. We note that in all cases the “merging” units have smaller luminosity than the other systems, but comparable central surface brightness. This is fully consistent with the interpretation of these galaxies as young spheroidal systems. Interestingly, both parents and daughters of this possible merging scenario have comparable morphologies.
6) In the sample available to us at the present time, the geometry of the cores is characterized by a relatively high degree of spherical symmetry, and there are no cases of highly elongated structures, such as the “chain galaxies” presented by Cowie et al. (1995b). These chain galaxies are apparently formed by strings of star-forming regions of similar surface brightness. Given their knotty structure and the fact that they seem to have comparable star-formation rates to those of the galaxies, if placed at , we would expect that the “morphological k-correction” (i.e., the change in the apparent morphology of a galaxy due to the fact that the observed wavelength is shifted into the rest–frame far UV at high redshifts) would make them appear even more elongated because of surface-brightness dimming of the more diffuse regions that surround the knots. None among the 19 galaxies observed so far has, even approximately, such a morphology. We have quantified this by measuring the axial ratios of the isophotes, which provide an upper limit to the axial ratios of the galaxy core regions. These values, reported in Table 2, have a mean of , and are larger than – only for the markedly exponential galaxies (and are never larger than ). In comparison, Cowie et al. report unconvolved axial ratios as high as 9.5, with a mean value of 4.7 for the chain galaxies. In general, the galaxies exhibit a relatively small dispersion in morphology, in contrast to the larger variety observed in the galaxies harboring most of the star formation at later epochs (cf. Cowie et al. 1995a and 1995b; Driver et al. 1995a and 1995b; Glazebrook et al. 1995b)
In interpreting the far–UV morphologies of galaxies at substantial redshifts, one must bear in mind the strong surface brightness selection effects (. On the other hand, the SED of unreddened star-forming galaxies is essentially flat from Å to Å rest-frame, and to even longer wavelengths if the galaxy is young. At the wavelength of a typical WFPC2 filter (e.g. the F702W with Å), this corresponds to observing galaxies in the redshift interval with minimal “morphological k-corrections” (see Giavalisco et al. 1996). This means that it is not unfair to compare UV morphologies of the galaxies with those of the systems.
Although it is not yet clear which physical parameter(s) is responsible for the variety of observed morphologies at intermediate redshift, the galaxies exhibit a high degree of morphological consistency, lending credence to the idea that we are observing a well defined “population”. In this respect, we note that the galaxies were selected using ground–based images in which the degree of central concentration was completely unknown a priori due to seeing effects (the ground based images have typical FWHM arcsec); thus we believe that the sample we have presented fairly represents the population of objects having the most substantial star formation rates at . One could speculate that the morphological peculiarities observed at intermediate redshifts are caused in part by the triggering of substantial star formation episodes in galaxies with masses that are too small to remain intact in the face of their own star formation (e.g. Dekel & Silk 1986). The objects, which have star formation rates as high as the starbursting galaxies at observed by Cowie et al. (1995a), clearly have enough binding energy to remain relatively “organized” despite the very high supernova rate that would be predicted ( yr-1), given the number of short–lived O stars known to be present.
As shown in S&96, the observed volume density of the galaxies is within a factor of a few that of present–day galaxies with , and their integrated star-formation rate is at least 25% of what is observed in the local universe. Rough dynamical estimates suggest that the galaxies are massive systems. In view of the fact that galactic spheroids must have formed relatively early to attain a state of quiescent evolution by , we find the centrally concentrated star formation that characterizes the population, together with all the other established properties, compelling evidence that we are observing directly the ongoing formation of the spheroid components of what would become the luminous galaxies of the present epoch. At we are probably seeing an epoch where the star formation was concentrated primarily in the central regions of massive galaxies (the “spheroid epoch”). This star formation appears to have “migrated” over time to more morphologically peculiar objects, and finally to the present where the bulk of the star formation is distributed in spiral disks.
In any event, the galaxies we have identified are the sites of the most active star formation at their epoch, and as a consequence they represent an important phase in the early history of galaxy formation. The properties of these objects must be reproduced by any theory attempting to explain the formation of normal galaxies.
References
- (1)
- (2) Bruzual, G, & Charlot, S. 1993, ApJ, 405, 538
- (3) Charlot, S., & Fall, S.M. 1993, ApJ, 415, 580
- (4) Cowie, L. L., Gardner, J. P., Hu, H. M., Songaila, A., Hodapp, K. W., & Wainscoat, R. J. 1994, ApJS, 94, 461
- (5) Cowie, L. L., Hu, E. M., & Songaila, A. 1995a, Nature, 377, 603
- (6) Cowie, L. L., Hu, E. M., & Songaila, A. 1995b, AJ, 110, 1576
- (7) Dekel, A., & Silk, J. 1986, ApJ, 303, 39
- (8) Driver, S., Windhorst, R., & Griffith, R. 1995a, ApJ, 453, 48
- (9) Driver, S., Windhorst, R., Ostrander, E., Keel, W., Griffith, R., Ratnatunga, K. 1995b, ApJ, 449, L23
- (10) Giavalisco, M., Steidel, C.C., & Szalay, A.S. 1994, ApJ, 425, L5
- (11) Giavalisco, M., Macchetto, D. F., Madau, P., & Sparks, W. B. 1995, ApJ, 441, L13
- (12) Giavalisco, M., Livio, M., Bohlin, R., Macchetto D. F., & Stecher, T. P. 1996, AJ, accepted for publication
- (13) Glazebrook, K., Ellis, R., Colless, M. M., Broadhurst, T. J., Allington-Smith, J. R., & Tanvir, N. R. 1995a, MNRAS, 273, 157
- (14) Glazebrook, K., Ellis, R., Santiago, B., & Griffith, R. 1995b, MNRAS, 275, L19
- (15) Guhathakurta, P., Tyson, J.A., & Majewski, S.R. 1990, ApJ, 357, L9
- (16) Ikeuchi, S., & Norman, C. A. 1991, ApJ, 375, 479
- (17) Kauffmann, G., & Charlot, S. 1994, ApJ, 430, L97
- (18) Leitherer, C., & Heckman, T.M. 1995, ApJS, 96, 9
- (19) Leitherer, C., Robert, C., & Heckman, T. M. 1995, ApJS, 99, 173
- (20) Lilly, S., Le Fevre, O., Crampton, D., Hammer, F., & Tresse, L. 1995a, ApJ, 455, 50
- (21) Lilly, S., Tresse, L., Hammer, F., Crampton, D., & Le Fevre, O. 1995, ApJ, 455, 108
- (22) Madau, P. 1995, ApJ, 441, 18
- (23) Pettini, M., King, D.L., Smith, L.J., & Hunstead, R. 1995, in QSO Absorption Lines, ed. G Meylan (Berlin: Springer-Verlag), p. 71
- (24) Schade, D., Lilly, S. J., Crampton, D., Hammer, F., Le Fevre, O., & Tresse, L. 1995, ApJ, 451, L1
- (25) Schechter, P., & Dressler, A. 1987, AJ, 94, 563
- (26) Stecher, T. P. et al. 1992, ApJ, 395, L1
- (27) Steidel, C.C., & Dickinson, M. 1995, in Wide Field Spectroscopy and the Distant Universe, eds. A. Aragon-Salamanca and S. Maddox (Singapore: World Scientific), p. 349
- (28) Steidel, C.C., Dickinson, M., & Persson, S.E. 1994, ApJL, 437, L75.
- (29) Steidel, C.C., & Hamilton, D. 1992, AJ, 104, 941 (Paper I)
- (30) Steidel, C.C., & Hamilton, D. 1993, AJ, 105, 2017 (Paper II)
- (31) Steidel, C.C., Pettini, M., & Hamilton, D. 1995 (Paper III), AJ, 110, 2519
- (32) Steidel, C. C., Giavalisco, M., Pettini, M., Dickinson, M., & Adelberger, K. 1996, ApJ, in press, S&96
| # | Field | Passband | Exp. TimeaaTotal exposure time in seconds | SB limitbb- surface brightness fluctuations in AB mag arcsec-2 in the WF-3 chip |
|---|---|---|---|---|
| 1 | 0000-263 | F606W | 15600 | 29.31 |
| 2 | 0000-263 | F702W | 27400 | 28.91 |
| 3 | 0000-263 | F606W + F702W | 43000 | 29.73 |
| 4 | 0347-383 | F702W | 18000 | 28.82 |
| 5 | 2217-003ccSSA22 pointing by Lilly et al. (1995), referred here as SSA22-L3 | F814W | 6700 | 27.61 |
| 6 | 2217-003ddSSA22 pointing by Cowie et al. (1995), referred here as SSA22-CW | F814W | 28800 | 29.38 |
| # | Name | Filter | aaMagnitude in a arcsec radius aperture, on the scale | bbMagnitude in a arcsec radius aperture, on the scale | ccIsophotal magnitude, on the scale | SFRddStar formation rates from isophotal magnitudes in units of M⊙ yr-1 for (0.05) | FiteeFunction which better models the radial profile: d=; e=exp; p=point-source | ffFitted scale length: for ; for exponential, in arcsec | ggCore half-light radius in arcsec, from direct photometry | hhTotal half-light radius in arcsec, from direct photometry | a/biiAxial ratio from the isophotal aperture | |
|---|---|---|---|---|---|---|---|---|---|---|---|---|
| 1 | 0000-263-C07 | — | SummjjSumm=F606W+F814W | 25.90 | 25.27 | 25.28 | — | d | 0.08 | 0.20 | 0.20 | 1.58 |
| 2 | 0000-263-C09 | 3.428 | Summ | 25.09 | 24.45 | 24.41 | 12 (40) | d | 0.10 | 0.20 | 0.20 | 1.53 |
| 3 | 0000-263-C10 | — | F606W | 24.98 | 24.66 | 24.66 | — | e | 0.09 | 0.10 | 0.10 | 1.18 |
| 4 | 0000-263-C11 | 3.150 | Summ | 25.78 | 25.06 | 25.07 | 6 (17) | e | 0.13 | 0.20 | 0.20 | 1.13 |
| 5 | 0000-263-C12 | — | Summ | 26.76 | 25.56 | 25.31 | — | e | — | 0.30 | 0.40 | 2.72 |
| 6 | 0000-263-C13 | — | Summ | 26.37 | 25.41 | 25.40 | — | e | 0.25 | 0.25 | 0.25 | 2.39 |
| 7 | 0000-263-C14a | 3.281 | Summ | 26.32 | 25.45 | 25.51 | 4 (13) | d | 0.47 | 0.20 | 0.25 | 1.75 |
| 7 | 0000-263-C14b | 3.281 | Summ | 26.14 | 25.43 | 25.48 | 4 (13) | d | 0.29 | 0.20 | 0.20 | 1.94 |
| 8 | 0000-263-C20 | — | Summ | 24.52 | 24.29 | 24.34 | — | p | — | 0.10 | 0.10 | 1.06 |
| 9 | 0000-263-C24 | — | Summ | 24.84 | 24.62 | 24.65 | — | p | — | 0.10 | 0.10 | 1.25 |
| 10 | 0000-263-C26 | — | Summ | 26.45 | 25.67 | 25.68 | — | d | 0.04 | 0.20 | 0.20 | 1.26 |
| 11 | 0000-263-C27 | 2.780 | Summ | 26.38 | 25.03 | 24.88 | 5 (14) | e | 0.25 | 0.30 | 0.35 | 2.24 |
| 12 | 0000-263-C28 | — | Summ | 26.61 | 25.29 | —– | — | e | 1.01 | 0.30 | — | 2.4 |
| 13 | 0347-383-N01 | — | F702W | 26.22 | 25.46 | 25.57 | — | e | 0.11 | 0.20 | 0.20 | 1.31 |
| 14 | 0347-383-N02 | — | F702W | 26.70 | 24.66 | 24.66 | — | e | 0.14 | 0.25 | 0.25 | 1.10 |
| 15 | 0347-383-N05 | 3.243 | F702W | 24.94 | 23.99 | 23.94 | 17 (53) | d | 0.53 | 0.25 | 0.30 | 2.37 |
| 16 | SSA22-L3-C02 | — | F814W | 25.40 | 24.95 | 24.89 | — | e | 0.15 | 0.15 | 0.15 | 1.18 |
| 17 | SSA22-L3-C24 | — | F814W | 25.36 | 23.86 | 23.35 | — | e | 0.43 | 0.35 | 0.50 | 2.90 |
| 18 | SSA22-CW-C12a | 3.201 | F814W | 27.01 | 25.05 | 24.80 | 7 (23) | e | 0.52 | 0.45 | 0.50 | 1.55 |
| 19 | SSA22-CW-C12b | 3.201 | F814W | 26.57 | 25.39 | 24.80 | 7 (23) | e | 0.20 | 0.30 | 0.50 | 1.49 |
| 20 | SSA22-CW-C16 | — | F814W | 26.5 | 26.0 | 25.7 | — | e | 0.17 | 0.25 | 0.30 | 1.38 |
The morphologies of the galaxies. The galaxies are at the center of the circle. The scale is 0.1 arcsec/pixel, and each box is 10 arcsec in size. The images clearly show the compact “core” and the low surface brightness nebulosities which often surround it. Although we do find a few cases of relatively diffuse systems and systems with multiple “cores”, the overall dispersion of morphologies among the population seems significantly narrower than that found in the star-forming galaxies observed at later cosmological epochs.
The radial profiles of the galaxies. The horizontal axes are radial separation in arcsec. Vertical ones are surface brightness in mag/arcsec2. The horizontal dot-long dashed lines are the surface brightness fluctuations of the frames in mag/arcsec2. The error bars are the rms fluctuations along the isophotes. The dot lines are the fitted profiles, the dashed lines are the exponentials. The presence of a peaked central light concentration surrounded by a more diffuse and irregular light distribution can be observed in the radial profiles.