Far-Ultraviolet Observations of NGC 3516 using the Hopkins Ultraviolet Telescope
Abstract
We observed the Seyfert 1 galaxy NGC 3516 twice during the flight of Astro-2 using the Hopkins Ultraviolet Telescope aboard the space shuttle Endeavour in March 1995. Simultaneous X-ray observations were performed with ASCA. Our far-ultraviolet spectra cover the spectral range 820–1840 Å with a resolution of 2–4 Å. No significant variations were found between the two observations. The total spectrum shows a red continuum, , with an observed flux of at 1450 Å, slightly above the historical mean. Intrinsic absorption in Lyman is visible as well as absorption from O vi , N v , Si iv , and C iv . The UV absorption lines are far weaker than is usual for NGC 3516, and also lie closer to the emission line redshift rather than showing the blueshift typical of these lines when they are strong. The neutral hydrogen absorption, however, is blueshifted by relative to the systemic velocity, and it is opaque at the Lyman limit. The sharpness of the cutoff indicates a low effective Doppler parameter, . For the derived intrinsic column is . As in NGC 4151, a single warm absorber cannot produce the strong absorption visible over the wide range of observed ionization states. Matching both the UV and X-ray absorption simultaneously requires absorbers spanning a range of in both ionization parameter and column density.
keywords:
galaxies: active — galaxies: individual (NGC 3516) — galaxies: nuclei — galaxies: Seyfert — ultraviolet: galaxies1 Introduction
Only 3–10% of Seyfert 1 galaxies show intrinsic UV absorption in the resonance lines of highly ionized elements (Ulrich (1988)). Of these, NGC 3516 has shown the strongest and most variable absorption lines (Ulrich & Boisson (1983); Voit, Shull, & Begelman (1987); Walter et al. (1990); Kolman et al. (1993); Koratkar et al. (1996)). NGC 3516 is unusual for a Seyfert 1 in other respects as well. While as many as half of all Seyfert 1’s show absorption by ionized material intrinsic to the source, characterized as a “warm absorber” (Nandra & Pounds (1994)), the only Seyfert 1 besides NGC 3516 with equivalent neutral hydrogen columns exceeding is NGC 4151 (Kolman et al. (1993); Nandra & Pounds (1994); Yaqoob, Warwick, & Pounds (1989); Yaqoob et al. (1993)). In NGC 4151, these variable columns range from 1 to (Yaqoob, Warwick, & Pounds (1989); Yaqoob et al. (1993)), and a similar range of variation has been observed in NGC 3516 (Kolman et al. (1993); Nandra & Pounds (1994); Kriss et al. (1996)). Extended X-ray emission has been seen in the nuclei of Seyfert 2 galaxies (Wilson et al. (1992); Weaver et al. (1995)), but among Seyfert 1’s the only examples are NGC 4151 (Elvis, Briel, & Henry (1983); Morse et al. (1995)) and possibly NGC 3516 (Morse et al. (1995)). NGC 3516 is also one of the rare Seyfert 1’s with an extended narrow-line region (NLR) having a biconical morphology (Ulrich & Pequignot (1980); Pogge (1989); Miyaji, Wilson, & Peŕez-Fournon (1992); Golev et al. (1995)). Again, NGC 4151 is the only similar counterpart (Evans et al. (1993)). This rare combination of strong UV and X-ray absorption and extended narrow-line emission suggests that they may be related phenomena.
Extended narrow-line emission in Seyfert galaxies is commonly associated with photoionization by a collimated source of radiation. Biconical morphologies are most often found in Seyfert 2 galaxies (Pogge (1989); Evans et al. (1994); Schmitt & Kinney (1996)), and they suggest that our line of sight to the central source of radiation is obscured. In the context of unified models of Seyfert galaxies (see the review by Antonucci (1993)), Seyfert 1’s present us with a direct line of sight to the broad emission-line region (BELR) and continuum source, whereas our line of sight in Seyfert 2’s is blocked by a torus opaque from the mid-infrared to at least soft X-rays. If the torus collimates the ionizing radiation, then biconical morphologies should not be observed in Seyfert 1 galaxies. Given this line of reasoning, Evans et al. (1993) proposed that the UV-absorbing material on our line of sight in NGC 4151, but not in the torus proper, might collimate the ionizing radiation.
Although the strength of the UV and X-ray absorption in both NGC 4151 and NGC 3516 suggests that the two absorbing mechanisms are related, it is not clear how. Kolman et al.’s (1993) simultaneous X-ray and UV observations of NGC 3516 were inconclusive due to a lack of variability. Common UV and X-ray absorption at much weaker levels in some active galactic nuclei has been successfully modeled with a single warm absorber (Mathur et al. (1994); Mathur, Wilkes, & Elvis (1995)), but the wide range of ionization states of the UV absorber in NGC 4151 is not compatible with the simplest warm absorber models (Kriss et al. (1995)).
The similarities of NGC 3516 and NGC 4151 in their UV and X-ray absorption and in their biconical NLR’s prompted us to explore the far-UV spectrum of NGC 3516 shortward of 1200 Å using the Hopkins Ultraviolet Telescope (HUT). Our goal was to search for further evidence that UV and X-ray absorbing gas in active galactic nuclei (AGN) is related to the collimation mechanism for the ionizing radiation. To improve our understanding of the relationship between the UV and X-ray absorbing gas, we also performed simultaneous X-ray observations using the Japanese X-ray satellite ASCA. In this paper we present the far-UV spectrum obtained with HUT. A companion paper (Kriss et al. 1996) discusses the ASCA observations.
2 Observations
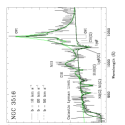
We observed NGC 3516 on two occasions during the Astro-2 mission, once for 1518 s beginning at 5:35:34 UT on 1995 March 11, and again for 2200 s beginning at 1:32:03 on 1995 March 13. Both observations were through a 20″ aperture during orbital night when airglow is at a minimum. The basic design of HUT is described by Davidsen et al. (1992). Briefly, a 0.9-m mirror collects light for a prime-focus, Rowland-circle spectrograph. A photon-counting detector sensitive from 820–1840 Å samples the dispersed spectrum at a resolution of 2–4 Å with 0.52 Å per pixel. Improvements to HUT, its performance during the Astro-2 mission, and our basic data reduction procedures are described by Kruk et al. (1995). The raw data were reduced by subtracting dark counts, correcting for scattered geocoronal Ly emission and subtracting airglow. We then flux-calibrated the spectrum using the time-dependent inverse sensitivity curves developed from on-orbit observations and model atmospheres of white dwarfs. Statistical errors for each pixel are calculated from the raw count spectra assuming a Poisson distribution and are propagated through the data reduction process. As there was no evidence for variability in the UV data, the two separate observations are weighted by their exposure times and combined to form the mean flux-calibrated HUT spectrum of NGC 3516 shown in Figure 1.

To model the spectrum of NGC 3516 and measure properties of the continuum, emission lines and the absorption lines, we use the IRAF111 The Image Reduction and Analysis Facility (IRAF) is distributed by the National Optical Astronomy Observatories, which is operated by the Association of Universities for Research in Astronomy, Inc. (AURA) under cooperative agreement with the National Science Foundation. task specfit (Kriss 1994a ). We fit the continuum with a power law in . The brightest broad emission lines (O vi , Ly, and C iv ) are well described by power law profiles while single Gaussian components are adequate for the weaker broad lines. The power law profile has a functional form , where (c.f. NGC 4151, Kriss et al. (1992)). Additional narrow Gaussian cores are required for Ly and He ii . Single Gaussian profiles are used for all absorption lines other than the Lyman series. We allow extinction to vary freely following a Cardelli, Clayton, & Mathis (1989) curve with .
To model hydrogen absorption in the Galaxy and in NGC 3516, we compute grids of transmission functions including transitions up to . Using Voigt profiles of varying column density and Doppler parameter, we then convolve the transmission with the instrument resolution. Galactic neutral hydrogen is fixed at zero redshift at a column density of (Stark et al. (1992)) with a Doppler parameter of . A sharp, redshifted Lyman edge is readily apparent in the NGC 3516 spectrum. Neutral hydrogen intrinsic to NGC 3516 is permitted to vary freely in column density, redshift, and Doppler parameter.
Our best fit yields for 1671 data points between 916 Å and 1800 Å (we omit a region from 1207-1222 Å surrounding geocoronal Ly). The fitted continuum has with . In frequency space this corresponds to a spectral index for . This is rather steep, but it is not that unusual for a low-luminosity AGN. For comparison, the Astro-1 spectrum of NGC 4151 showed a spectral index of 1.50 (Kriss et al. (1992)), the FOS spectrum of NGC 1566 has (Kriss et al. (1991)), and the UV continuum of M 81 has (Ho, Filippenko, & Sargent (1996)). Our fitted extinction is higher than the predicted Galactic reddening of –0.03 in the maps of Burstein & Heiles (1982), but compatible with that expected using and a gas-to-dust ratio of (Shull & Van Steenberg (1985)). Previous work based on IUE observations (Kolman et al. (1993); Koratkar et al. (1996)) have determined based on the strength of the 2200 Å absorption feature, but such a large extinction correction provides a poor match to our data — for , . To show the sensitivity of the data to the extinction correction, Figure 2 compares the observed spectrum with power-law continua after correction for and 0.15. The figure clearly shows that no extinction correction leads to a deficit in continuum flux below 1000 Å, whereas an extinction correction of produces an excess in flux at short wavelengths. We suggest that the apparent strength of the 2200 Å dip in the IUE data is not due to extinction, but rather to the onset of broad emission from blended Fe ii at 2300 Å.

For the neutral hydrogen intrinsic to NGC 3516 we find a best fit redshift of , , and . This is blue-shifted by relative to the systemic velocity of NGC 3516 measured using the stellar absorption lines (Vrtilek & Carleton (1985)). The opaque Lyman limit requires neutral hydrogen with a minimum column density (90% confidence). Its sharpness limits to less than at 90% confidence. The effect of the assumed Doppler parameter on the shape of the intrinsic Lyman limit is shown with an enlarged view of the Lyman-limit region in NGC 3516 in Figure 3. The general weakness of the Lyman absorption lines (only Ly and perhaps Ly are detected) gives an upper limit of at 90% confidence.
Measured properties of the fitted emission lines are in Table 1. The fitted absorption lines are summarized in Table 2. All tabulated features, except for Ly, have a statistical significance exceeding . The error matrix of the fit is used to derive the statistical errors shown in the table. Systematic errors of up to 5% are likely to be present in the fluxes, and our wavelength scale has a limiting accuracy of . For ease in fitting, some poorly constrained parameters were linked to others with better determined values. For example, the velocity offset and FWHM of the C iii and the N iii lines were linked to share common values, and the FWHM of He ii was set equal to that of He ii . Any entries in the tables with identical velocity offsets or FWHM’s were linked in a similar manner. Since the intrinsic O vi absorption is difficult to see in Figure 1, an enlarged view illustrating our fits to this region is shown in Figure 3. The O vi absorption doublet straddles the peak of the O vi emission line, and the sharpness of the line peak is largely defined by the flux escaping at wavelengths between the doublets. Galactic C ii, Galactic Ly, and intrinsic Ly absorption all contribute to the deficit in flux on the blue wing of the O vi emission.
| Line | Fluxaa Flux in corrected for . | Velocitybb Velocity relative to a systemic redshift of (Vrtilek & Carleton (1985)). | FWHM | |
|---|---|---|---|---|
| (Å) | ||||
| C III | 977.02 | |||
| N III | 990.83 | |||
| O VI | 1033.83 | |||
| He II | 1085.15 | |||
| Ly | 1215.67 | |||
| Ly | 1215.67 | |||
| Ly | 1215.67 | |||
| N V | 1240.15 | |||
| O I | 1304.35 | |||
| C II | 1335.30 | |||
| Si IV | 1393.76 | |||
| Si IV | 1402.77 | |||
| N IV] | 1486.50 | |||
| C IV | 1549.05 | |||
| He II | 1640.50 | |||
| He II | 1640.50 | |||
| He II | 1640.50 | |||
| N III] | 1750.51 |
| Line | EW | Velocityaa Velocity relative to a systemic redshift of (Vrtilek & Carleton (1985)). | FWHM | |
|---|---|---|---|---|
| (Å) | (Å) | |||
| N I | 953.77 | |||
| N I | 964.24 | |||
| C III | 977.02 | |||
| Si II | 989.87 | |||
| Ly | 1025.72 | |||
| Ly | 1025.72 | |||
| C II | 1036.90 | |||
| O VI | 1031.93 | |||
| O VI | 1037.62 | |||
| Si II | 1193.14 | |||
| N I | 1200.16 | |||
| Ly | 1215.67 | |||
| N V | 1238.82 | |||
| N V | 1242.80 | |||
| Si II | 1260.42 | |||
| C II | 1335.30 | |||
| Si IV | 1393.76 | |||
| Si IV | 1402.77 | |||
| Si II | 1527.17 | |||
| C IV | 1548.19 | |||
| C IV | 1550.77 |
3 The Broad Emission Lines
The broad emission lines in NGC 3516 as observed with HUT show subtle differences compared to other Seyfert 1’s and low redshift AGN. The optical to X-ray spectral index for NGC 3516, , is typical of other Seyfert 1’s (Kriss & Canizares (1985)), but the flux ratio of O vi to Ly is only 0.18. This lies below the correlation of O vi/Ly with discussed by Zheng, Kriss, & Davidsen (1995), but is comparable to the mean value of 0.17 seen in high redshift quasars (Laor et al. (1994)). As in the case of Fairall 9, however, the lack of a soft X-ray excess in NGC 3516 may be a significant factor in producing lower O vi/Ly compared to other Seyfert 1’s (Zheng et al. (1995)).
The other noticeable difference is the relatively high strength of broad C iii and N iii emission in our spectrum. Although these lines have been seen in other low-redshift quasars (Laor et al. (1994); Laor et al. (1995)), they are not detected in other HUT spectra of Seyfert 1’s. The ratios of these lines to each other and to O vi is also typical of that seen in the low redshift quasars observed with HST (Laor et al. (1995)).
Reverberation mapping experiments have shown that the broad emission-line region (BELR) of AGN is highly stratified in both spatial distribution and in ionization parameter (e.g., Clavel et al. (1991); Krolik et al. (1991); Reichert et al. (1994); Korista et al. (1995)). Nevertheless, it is useful to match a single-zone photoionization model to the observed broad line emission in NGC 3516 to obtain a fiducial for comparison to other Seyferts. In addition, it provides a comparison to models of the warm absorbing medium seen in the X-ray spectrum and in the UV absorption lines that we discuss in § 4. We use the photoionization code XSTAR (Kallman & Krolik (1993)) to compute a grid of photoionization models varying the total column density and the ionization parameter , where is the number density of ionizing photons between 13.6 eV and 13.6 keV illuminating the cloud and is the density of hydrogen atoms. As we are constraining only high ionization lines that are insensitive to the density, we assume constant density clouds with and solar abundances. For the incident photoionizing continuum we use the extinction-corrected UV and absorption-corrected X-ray spectrum of NGC 3516 as described by Kriss et al. (1996). The UV power law was extrapolated to higher energies following with a break at 51 eV to the slope of the X-ray power law, . To match the observed line ratios we varied the parameters until we achieved the closest fit to the strongest lines — O vi+Ly, Ly, Si iv+O iv], C iv, and He ii . The closest match is for an ionization parameter . The resulting line ratios from this model are compared to the observed values and their error bars in Table 3. Choosing is mainly a balance between the O vi emission and the C iv line. Producing sufficient O vi requires , but then the C iv/Ly ratio becomes too high. fits the C iv/Ly intensity ratio well, but the O vi emission is then a factor of 2 less than observed. As the lines we are matching originate in the high ionization illuminated faces of the BELR clouds, their intensities are rather insensitive to changes in the column density above in our models.
| Feature | aa Line ratios are relative to the major contributors to the blend — H Ly, He ii , and O v . | Modelbb Line ratio computed for a model with , , and . |
|---|---|---|
| C iii | 0.002 | |
| N iii | 0.000 | |
| O vi+Ly | 0.123 | |
| He ii | 0.009 | |
| N v | 0.064 | |
| O i | 0.000 | |
| C ii | 0.007 | |
| Si iv+O iv | 0.102 | |
| N iv] | 0.074 | |
| C iv | 0.778 | |
| He ii | 0.037 | |
| N iii] | 0.012 |
The best-fit ionization parameter is a typical value for single-zone models of AGN broad-line regions, but one can see from Table 3 that this model is insufficient to explain all the observed line ratios. The most noticeable differences are in the relatively high strengths observed for C iii , N iii , and He ii . Given the compromise we made between matching O vi and C iv, one can envision that a higher ionization zone producing relatively more O vi and He ii could account for part of these differences. An additional population of higher density clouds may be required to produce the enhanced C iii , which becomes a more important coolant as other lines become optically thick (Netzer (1990)). The strong N iii is more of a puzzle. Most photoionization models predict it to be weaker than C iii , yet in our spectrum and in the HST quasar spectra (Laor et al. (1995)) it is stronger. It is possible that fluorescent mechanisms could enhance the strength of this transition under favorable circumstances (Ferguson, Ferland, & Pradhan (1995)).
Although the broad lines in NGC 3516 seem to be mostly produced in a region with an ionization parameter typical of the BELR in other AGN, is an order of magnitude lower than the ionization parameter required for the warm absorbing gas detected in the ASCA X-ray spectrum (Kriss et al. (1996)). This does not rule out an origin in the BELR for the X-ray warm absorbers, but these absorbers must be physically distinct from the clouds producing the bulk of the broad-line emission.
4 The Complex Absorbing Medium in NGC 3516
Intrinsic UV absorption lines are prominent in our spectrum of NGC 3516, but they are near the weakest levels seen in NGC 3516, comparable to their appearance in the 1993 IUE monitoring campaign (Koratkar et al. (1996)). The frequently observed blue-shifted absorption trough (Voit, Shull, & Begelman (1987); Walter et al. (1990); Kolman et al. (1993)) is not present, and the C iv feature in our spectrum probably corresponds to the narrow component in the models of Walter et al. (1990). Although the C iv absorption line in the HUT spectrum is narrow, it is resolved. After correcting for instrumental broadening by subtracting a 2.0 Å Gaussian in quadrature (Kruk et al. (1995)), we find an intrinsic width for the line of 350 . This corresponds to , which is consistent with the observed equivalent widths (EWs) and optically thin doublet ratio of the deblended C iv lines. The other high ionization resonance lines also have optically thin doublet ratios consistent with . In contrast, the neutral hydrogen absorption at the Lyman limit requires . This, and the significantly different velocity of the neutral hydrogen absorption, are indications that the absorbing medium contains multiple zones.
The simultaneous X-ray observations of NGC 3516 discussed in the preceding paper (Kriss et al. (1996)) also hint that the absorbing medium may be complex. The ASCA observations show O vii and O viii edges characteristic of warm absorbers that have been seen in other AGN (Turner et al. (1993); Mathur et al. (1994); Fabian et al. 1994a ; Fabian et al. 1994b ). Photoionized warm absorber models similar to those discussed by Krolik & Kriss (1995) can fit the data, but the fit is significantly improved if two absorbing zones with differing ionization parameter and total column density are used. These warm absorber models use the same incident photoionizing continuum described in the previous section. We also considered alternative ionizing continua to test the sensitivity of our results to the assumed incident spectrum. We used both an extremely hard spectrum with from 2500 Å through the UV and X-ray up to 100 keV, and also the spectral shape of NGC 5548 as used by Mathur et al. (1995), which contains a soft X-ray excess. The models are computed for constant density () clouds in thermal equilibrium. (For densities there are no density-dependent effects in our calculations or results.) The models are described by their ionization parameter and their total column density .
Single-zone photoionization models of the absorbing gas in 3C 351 (Mathur et al. (1994)) and in NGC 5548 (Mathur, Wilkes, & Elvis (1995)) can produce both the X-ray and UV absorption seen in these two AGN. We now test whether this is true for NGC 3516. The single warm absorber fit to the ASCA spectrum of NGC 3516 has and . Given the column densities predicted by this model for the UV ions, we can place the observed EWs on curves of growth (Figure 4). If the model self-consistently accounts for both the X-ray and UV absorbers, all the plotted EWs should lie on a single curve of growth. As shown in the top panel of Figure 4, they do not. The predicted column densities of neutral hydrogen and Si iv are orders of magnitude below what we observe in the HUT spectrum, and a single Doppler parameter does not give a good match to the remaining UV lines. Choosing fits the N v and O vi doublets within the errors, but this underpredicts the strength of the C iv doublet by factors of several. This situation is similar to the difficulties noted by Kriss et al. (1995) in trying to account for the low-ionization UV absorption lines in NGC 4151 with a single warm absorber model.

The warm absorber models computed with the alternative ionizing continua give similar results, with the predicted columns of the UV ions in each model within tens of percent of each other. This insensitivity to the precise shape of the ionizing spectrum is not surprising. For broad ionizing continua such as power laws or broken power laws, even the earliest photoionization calculations (e.g., Tarter, Tucker, & Salpeter (1969)) showed that models were much more sensitive to ionization parameter than to spectral shape. In Table 4 we compare the columns inferred from the UV absorption lines assuming they are optically thin, as indicated by their doublet ratios, to the column densities predicted by the various models. The similarity of the models to each other is apparent, as is the large disagreement with the observations, particularly for Si iv.
| Ion | aaColumn density assuming the observed absorption lines are optically thin. The H i column is from the Lyman-limit fit. | bbPredicted column density for the single-zone warm absorber model with the NGC 3516 ionizing spectrum, and log = 22.02. | ccPredicted column density for the warm absorber model with the ionizing spectrum, and log = 22.02. | ddPredicted column density for the warm absorber model with the NGC 5548 ionizing spectrum, and log = 22.02. |
|---|---|---|---|---|
| () | () | () | () | |
| H i | ||||
| C iv | ||||
| N v | ||||
| O vi | ||||
| Si iv |
The two-component warm absorber fit favored by the ASCA data also fails as an adequate description of the UV absorption. The lower ionization zone with and still falls short in matching the Si iv and H i by orders of magnitude, and once again a single Doppler parameter fails to match the observations of the remaining UV lines. The only UV-absorbing species with a significant column at any Doppler parameter in the higher ionization zone (, ) is O vi.
Producing the observed EWs of the UV lines requires regions of lower ionization and lower column density than those producing the X-ray absorption. For , , and we find a good match to the observed EWs of the C iv, N v, and O vi doublets as shown in the center panel of Figure 4. The predicted EW of the Ly line is higher than observed, but enhancing the overall metal abundance by a factor of a few can correct this. However, the predicted EW of Si iv in this model is orders of magnitude below the observed value. Similar problems are encountered in matching the inferred column densities of Si iv absorption in models of broad-absorption line (BAL) QSOs (Weymann, Turnshek, & Christiansen (1985)). Ad hoc adjustments to the ionizing continuum can alleviate the disagreement to some extent (Weymann, Turnshek, & Christiansen (1985)), but even the most extreme changes do not bring the predictions within the bounds of the observations, again showing the relative insensitivity of photoionization models to the shape of the ionizing spectrum. Producing enough Si iv absorption requires a zone of even lower ionization. Choosing and matches the Si iv EWs without contributing much to the columns of the higher ionization lines. This model is illustrated in the lower panel of Figure 4. Limits on the EWs of lower ionization species such as Ly and C iii , however, require . This lower ionization zone with low Doppler parameter is potentially the origin of the optically thick Lyman limit system, but the predicted column of neutral hydrogen in this model is only , a factor of 4 below the observed value.
The multiple zones considered above span a range of in both column density and ionization parameter, and they form a nearly orthogonal set that makes it possible to consistently model the UV and X-ray absorption with separate regions of gas in very different physical states. For Doppler parameters at the sound speed of the two high ionization zones producing the X-ray absorption ( in the lower ionization zone, in the higher), the predicted contribution of the X-ray absorbing gas to the EWs of the C iv, N v, and O vi lines is only 20–30% of their observed values. The UV zones producing the C iv, N v, O vi and Si iv lines have total columns with negligible impact on the X-ray opacity. Since the X-ray absorbing gas is predicted to have a significantly lower Doppler parameter than the gas producing the bulk of the UV absorption lines, high resolution spectra in the UV should be able to identify kinematic components associated with the different zones.
Several previous authors have suggested that the UV absorption lines and the X-ray absorption seen in some AGN may have a common origin in BELR clouds (Ferland & Mushotzky (1982); Reichert, Mushotzky, & Holt (1986)). However, Mathur et al. (1994) show that the physical conditions of the UV and X-ray absorber in 3C 351 are different from those of the BELR clouds, with the X-ray warm absorber requiring a much higher ionization parameter than the clouds producing the broad emission lines. For NGC 3516, Voit, Shull, & Begelman (1987) argued that the observed absorption profile (the C iv absorption in the 1980’s was much broader and stronger than observed here) required 10–30 BELR clouds along the line of sight and that photoionized C iv could not be present in the outer clouds due to shielding by the inner ones. The lack of observed Mg ii absorption was another difficulty for models involving BELR clouds. They concluded that the absorption must arise in optically thin, outflowing material with a density exceeding , given the observed variability, and that it could not be associated with typical BELR clouds.
Our conclusions are similar, even though the absorption is now much weaker. The ionization parameter we derive for the broad emission-line clouds () is an order of magnitude lower than that required by the X-ray absorbing gas, making it highly unlikely that the X-ray absorption occurs in BELR clouds. , however, is similar to the ionization parameter we find for the zone producing the C iv, N v, and O vi absorption lines (). Although these absorption lines and the broad emission lines share comparable ionization parameters, the total columns of the BELR clouds are higher, as the broad emission line clouds are optically thick in these transitions, but the absorbing clouds are optically thin. This column density constraint is a poor one, however, because the BELR is highly stratified, and there may well be a population of clouds that both make the absorption lines and contribute to the broad-line emission. The velocity distribution of such clouds would have to be rather peculiar, however, to project a velocity width of only along the line of sight from an ensemble with an emission line width of . We conclude that we still cannot unambiguously establish the location of the absorbing gas, but it must be physically distinct from the broad emission line clouds.
Although we have described the UV and X-ray absorbing zones as discrete entities, it is quite likely that there is a broad, possibly continuous, distribution of parameters such as one might find in an outflowing wind, either from the accretion disk or from the surface of the obscuring torus. As discussed in the introduction, NGC 3516 is one of the rare Seyfert 1 galaxies that shows an extended, biconical NLR (see Golev et al. 1995 for the best images). Among Seyfert 1’s, only NGC 4151 has such an extensive NLR with a biconical morphology (Pogge (1989); Evans et al. (1994); Schmitt & Kinney (1996)). The biconical morphology in NGC 3516 implies that our line of sight passes close to the surface of the obscuring torus as suggested for NGC 4151 by Evans et al. (1993). The opaque Lyman limit is another characteristic that NGC 3516 shares with NGC 4151. These features are unusual in combination for a Seyfert 1, and their presence in yet another galaxy strengthens the case for collimation of the ionizing radiation by the absorbing gas.
The complexity of the UV and X-ray absorption that both NGC 3516 and NGC 4151 exhibit suggest that the inclination of the source relative to the observer may lead to the differences between these two objects and the apparently simpler cases considered by Mathur et al. (1994,1995). The simpler warm absorbers with only high-ionization UV absorption lines may be viewed at higher inclination, further away from the denser medium near the torus. Such geometrical differences may ultimately help us to understand the location and origin of the warm absorbing gas in AGN.
Acknowledgements.
This work was supported by NASA contract NAS 5-27000 to the Johns Hopkins University.References
- Antonucci (1993) Antonucci, R. R. J. 1993, ARA&A, 31, 473
- Burstein & Heiles (1982) Burstein, D., & Heiles, C. 1982, AJ, 87, 1165
- Cardelli, Clayton, & Mathis (1989) Cardelli, J., Clayton, G., & Mathis, J. 1989, ApJ, 345, 245
- Clavel et al. (1991) Clavel, J., et al. 1991, ApJ, 366, 64
- Davidsen et al. (1992) Davidsen, A. F., et al. 1992, ApJ, 392, 264
- Elvis, Briel, & Henry (1983) Elvis, M., Briel, U. G., & Henry, J. P. 1983, ApJ, 268, 105
- Evans et al. (1994) Evans, I. N., Ford, H. C., Kriss, G. A., & Tsvetanov, Z. 1994, in The First Stromlo Symposium: The Physics of Active Galaxies, ASP Conf. Ser. 54, ed. G. V. Bicknell, M. A. Dopita, & P. J. Quinn, (San Francisco: ASP), p. 3
- Evans et al. (1993) Evans, I., Tsvetanov, Z., Kriss, G. A., Ford, H. C., Caganoff, S., & Koratkar, A. P. 1993, ApJ, 417, 82
- (9) Fabian, A., Nandra, K., Brandt, W., Hayashida, K., Makino, F., & Yamauchi, M. 1994, in New Horizons in X-ray Astronomy, eds. F. Makino & T. Ohashi (Tokyo: Universal Academy Press), p. 573
- (10) Fabian, A., et al. 1994, PASJ, 46, L59
- Ferguson, Ferland, & Pradhan (1995) Ferguson, J. W., Ferland, G. J., & Pradhan, A. K. 1995, ApJ, 438, L55
- Ferland & Mushotzky (1982) Ferland, G. J., & Mushotzky, R. F. 1982, ApJ, 262, 564
- Golev et al. (1995) Golev, V., Yankula, I., Bonev, T., & Jockers, K. 1995, MNRAS, 273, 129
- Halpern (1984) Halpern, J. 1984, ApJ, 281, 90
- Ho, Filippenko, & Sargent (1996) Ho, L., Filippenko, A., & Sargent, W. L. W. 1996, ApJ, in press
- Holt et al. (1980) Holt, S. S., et al. 1980, ApJ, 241, L13
- Kallman & Krolik (1993) Kallman, G. A., & Krolik, J. H. 1993, NASA Internal Report
- Kolman et al. (1993) Kolman, M., Halpern, J. P., Martin, C., Awaki, H., & Koyama, K. 1993, ApJ, 403, 592
- Koratkar et al. (1996) Koratkar, A., et al. 1996, in preparation
- Korista et al. (1995) Korista, K., et al. 1995, ApJS, 97, 285
- (21) Kriss, G. A. 1994a, in Astronomical Data Analysis Software and Systems III, ASP Conf. Ser. 61, ed. D. R. Crabtree, R. J. Hanisch, & J. Barnes, (San Francisco: ASP), 437
- Kriss & Canizares (1985) Kriss, G. A., & Canizares, C. R. 1985, ApJ, 297, 177
- Kriss et al. (1995) Kriss, G. A., Davidsen, A. F., Zheng, W., Kruk, J. W., & Espey, B. R. 1995, ApJ, 454, L7
- Kriss et al. (1991) Kriss, G. A., et al. 1991, ApJ, 377, L13
- Kriss et al. (1992) Kriss, G. A., et al. 1992, ApJ, 392, 485
- Kriss et al. (1996) Kriss, G. A., et al. 1996, ApJ, this issue
- Kriss et al. (1994) Kriss, G. A., Tsvetanov, Z., & Davidsen, A. F. 1994b, in The First Stromlo Symposium: The Physics of Active Galaxies, ASP Conf. Ser. 54, ed. G. V. Bicknell, M. A. Dopita, & P. J. Quinn, (San Francisco: ASP), p. 281
- Krolik et al. (1991) Krolik, J.H., Horne, K., Kallman, T.R., Malkan, M.A., Edelson, R.A., & Kriss, G.A. 1991, ApJ, 371, 541
- Krolik & Kriss (1995) Krolik, J. H., & Kriss, G. A. 1995, ApJ, 447, 512
- Kruk et al. (1995) Kruk, J. W., Durrance, S. T., Kriss, G. A., Davidsen, A. F., Blair, W. P., Espey, B. R., & Finley, D. 1995, ApJ, 454, L1
- Laor et al. (1994) Laor, A., Bahcall, J. N., Jannuzi, B. T., Schneider, D. P., Green, R. F., & Hartig, G. F. 1994, ApJ, 420, 110
- Laor et al. (1995) Laor, A., Bahcall, J. N., Jannuzi, B. T., Schneider, D. P., Green, R. F., & Hartig, G. F. 1995, ApJS, 99, 1
- Mathur et al. (1994) Mathur, S., Wilkes, B., Elvis, M., & Fiore, F. 1994, ApJ, 434, 493
- Mathur, Wilkes, & Elvis (1995) Mathur, S., Wilkes, B., & Elvis, M. 1995, ApJ, 452, 230
- Miyaji, Wilson, & Peŕez-Fournon (1992) Miyaji, T., Wilson, A. S., & Peŕez-Fournon, I. 1992, ApJ, 385, 137
- Morse et al. (1995) Morse, J., Wilson, A. S., Elvis, M., & Weaver, K. A. 1995, ApJ, 439, 121
- Nandra & Pounds (1994) Nandra, P., & Pounds, K. A. 1994, MNRAS, 268, 405
- Netzer (1990) Netzer, H. 1990, in Active Galactic Nuclei, ed. T. J. L. Courvoisier & M. Mayor (Berlin: Springer), p. 57
- Netzer (1993) Netzer, H. 1993, ApJ, 411, 594
- Pogge (1989) Pogge, R. 1989, ApJ, 345, 730
- Reichert et al. (1994) Reichert, G. A., et al. 1994, ApJ, 435, 582
- Reichert, Mushotzky, & Holt (1986) Reichert, G. A., Mushotzky, R. F., & Holt, S. S. 1986, ApJ, 303, 87
- Schmitt & Kinney (1996) Schmitt, H. R., & Kinney, A. L. 1996, ApJ, in press
- Shull & Sachs (1993) Shull, J. M., & Sachs, E. R. 1993, ApJ, 416, 536
- Shull & Van Steenberg (1985) Shull, J. M., & Van Steenberg, M. E. 1985, ApJ, 294, 599
- Stark et al. (1992) Stark, A.A., et al. 1992, ApJS, 79, 77
- Tarter, Tucker, & Salpeter (1969) Tarter, C. B., Tucker, W. H., & Salpeter, E. E. 1969, ApJ, 156, 943
- Turner et al. (1993) Turner, T.J., Nandra, K., George, I.M., Fabian, A.C., & Pounds, K.A. 1993, ApJ, 419, 127
- Ulrich (1988) Ulrich, M.-H. 1988, MNRAS, 230, 121
- Ulrich & Boisson (1983) Ulrich, M.-H., & Boisson, C. 1983, ApJ, 267, 515
- Ulrich & Pequignot (1980) Ulrich, M.-H., & Pequignot, D. 1980, ApJ, 238, 45
- Voit, Shull, & Begelman (1987) Voit, G. M., Shull, J. M., & Begelman, M. C. 1985, ApJ, 316, 573
- Vrtilek & Carleton (1985) Vrtilek, J. M., & Carleton, N. A. 1985, ApJ, 294, 106
- Walter et al. (1990) Walter, R., Ulrich, M.-H., Courvoisier, T. J.-L., & Buson, L. M. 1990, A&A, 233, 53
- Weaver et al. (1995) Weaver, K. A., Mushotzky, R. F., Serlemitsos, P. J., Wilson, A. S., Elvis, M., & Briel, U. 1995, ApJ, 442, 597
- Wilson et al. (1992) Wilson, A. S., Elvis, M., Lawrence, A., & Bland-Hawthorne, J. 1992, ApJ, 391, L75
- Weymann, Turnshek, & Christiansen (1985) Weymann, R. J., Turnshek, D. A., & Christiansen, W. A. 1985, in Astrophysics of Active Galaxies and Quasi-stellar Objects, ed. J. S. Miller (Mill Valley: University Science Books), 333
- Yaqoob, Warwick, & Pounds (1989) Yaqoob, T., Warwick, R. S., & Pounds, K. A. 1989, MNRAS, 236, 153
- Yaqoob et al. (1993) Yaqoob, T., et al. 1993, MNRAS, 262, 435
- Zheng, Kriss, & Davidsen (1995) Zheng, W., Kriss, G. A., & Davidsen, A. F. 1995, ApJ, 440, 606
- Zheng et al. (1995) Zheng, W., Kriss, G. A., Davidsen, A. F., & Kruk, J. W. 1995, ApJ, 454, L11