. 11footnotetext: Presented by G. Goldhaber, e-mail address:gerson@LBL.gov 22footnotetext: Current address: CNRS-IN2P3, University of Paris 33footnotetext: Current address: Anglo-Australian Observatory
Abstract
This work is based on the first results from a systematic search for high redshift Type Ia supernovae. Using filters in the -band we discovered seven such SNe, with redshift , before or at maximum light. Type Ia SNe are known to be a homogeneous group of SNe, to first order, with very similar light curves, spectra and peak luminosities. In this talk we report that the light curves we observe are all broadened (time dilated) as expected from the expanding universe hypothesis. Small variations from the expected broadening of the light curve widths can be attributed to a width-brightness correlation that has been observed for nearby SNe (). We show in this talk the first clear observation of the cosmological time dilation for macroscopic objects.
1 Introduction
In an ongoing systematic search, we have recently discovered and studied seven supernovae (SNe) at redshifts between and 0.46 as discussed in Perlmutter’s talk at this conference. For details on search technique, light curves, and spectra, see Perlmutter et al. 1996.
2 Supernova Homogeneity
As discussed in several talks at this conference, Type Ia supernovae are, as a class, highly homogeneous. They are explosion events that are apparently triggered under very similar physical conditions. Their “light curves” scatter by less then % RMS in brightness (Vaughan et al 1995a, 1995b), and less than 15% RMS in full-width-at-half-maximum (Perlmutter 1996), in a sample of “normal” Type Ia supernovae, after rejecting the abnormal 15% with red colors (see Vaughan et al 1995a). Their spectral signatures also follow a well-defined evolution in time. A paper giving all the photometric and spectroscopic measurements for our SNe,as well as a detailed discussion of the evaluation of , is in preparation.
Most of our SNe have been followed for about a year. For three of our SNe we have obtained spectra at an early enough time to observe both the characteristic SN spectrum as well as the host galaxy spectrum. These three supernova spectra, in their rest system, all have spectral features matching nearby Type Ia’s at the same epoch in great detail. In the other cases, we could not obtain the spectra early enough, due to inclement weather, so that by the time the spectra were taken the SN light could not be separated from the galaxy spectrum. Redshifts were obtained from the host galaxy spectra. All these details on the spectra will be presented in our forthcoming paper (Perlmutter et al. 1996).
In the present paper we will make use of the “standard” nature of the Type Ia SNe light curves. This feature allows us to consider the Type Ia supernovae as “clocks” at cosmological distances.
3 The Observed SNe
Due to the large redshifts we are aiming for, we have carried out our search using -band filters, while most of the data on nearby SNe was taken in -band or V-band filters. To compare our data with nearby measurements in -band magnitudes, we use a template compiled by B.Leibundgut. To this template curve we have to apply a correction which compares the SN spectrum as observed “nearby” in a blue filter with the red shifted spectrum as observed at high values in a red filter (as discussed by A. Kim at this meeting and Kim, Goobar, & Perlmutter 1996). The resulting new templates—one for each redshift—are then in the -band in which our data was taken.
The recent work of Phillips (1993), Hamuy et al (1995), and Riess et al.(1995) has emphasized the inhomogeneity of Type Ia light curve shapes, particularly for the “non-normal” redder Type Ia’s. Perlmutter (1996) provides a single-parameter characterization of these light curve differences, which is simply a time-axis stretch factor, , which stretches (or compresses) the Leibundgut template light curve. From this study based on nearby SNe it was shown that this stretch factor extends over a range of 0.65 to 1.1. To observe the effect of cosmological time dilation experimentally the expected dilation factor is modified by the stretch factor . The observable effect is then . Since is asymmetric around 1, for low values of which occur for the most extreme 15% of non-normal Type Ia supernovae with red colors, the effect can be essentially cancelled by , giving an observed dilation of .
4 Fit to the data.
We fit each of our observed seven SNe to the -band template light curve using the fitting program MINUIT (James and Roos 1994). Each SN is fit to this template, expressed now in normalized counts, (rather than in magnitudes). We fit three variables: the height of the light curve, the day of peak light and a time dilation, , of the width of the light curve.
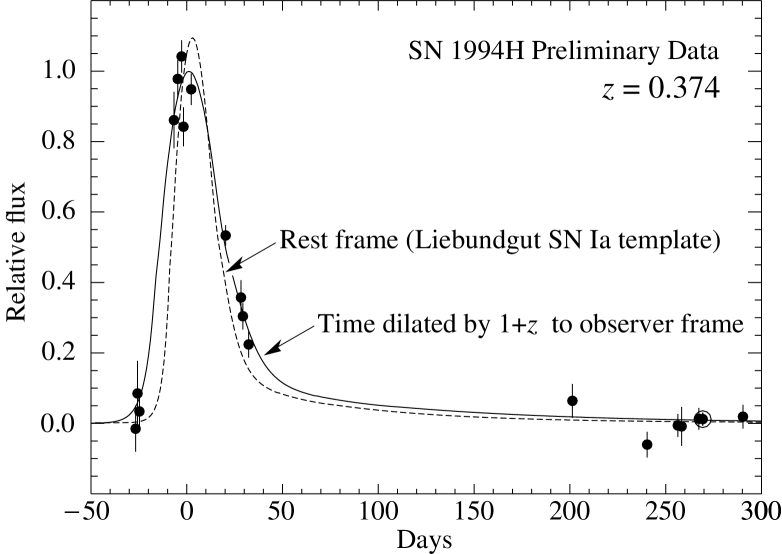
As an illustration of the cosmological time dilation effect, we show in Fig 1 one of our seven SNe -band light curve data points, SN 1994H, plotted against the observed time axis. The dashed curve is the best fit Leibundgut template with corrections, with no time dilation, i.e. fixed at . This gives a . The solid curve is the best fit with fixed at for a . This corresponds to the slowing down of our “clock”, with the cosmological time dilation expected for a redshift of .
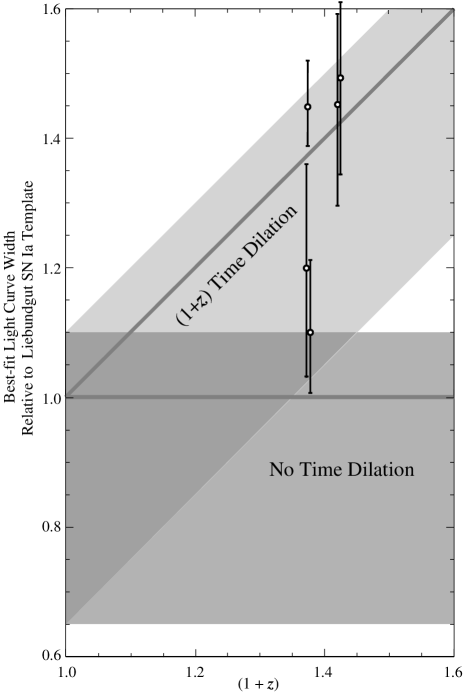
Given the asymmetric spread of light curve widths discussed above, we can predict what the distribution should look like at high redshifts for a universe with and without time dilation. These predictions are indicated by the shaded bands of Figure 2. Note that at redshifts between , any examples of Type Ia supernovae with an observed width greater than provide evidence for the time-dilation model; the narrower supernovae neither help nor hurt in distinguishing the models since the two ranges both are consistent with supernovae with observed width smaller than 1.1. At redshifts higher than , all supernovae become useful for separating the two models, since there is no overlap. Fig 2 also shows the actual data for the best-measured five of our seven SNe, plotted on top of these predicted ranges for the two models.
We can make this test even more powerful, even at redshifts 0.1 , by using another independent observable to indicate the intrinsic width of the supernova. Vaughan et al (1995) and Branch et al (1996) have shown that supernova color can indicate the width (and brightness) of a given supernova. color can distinguish among the narrow supernovae, while color appears to identify the width and brightness of a supernova within the entire range from . (It is possible to confuse intrinsic color differences with reddening, if sufficient photometry points are not available, however this is not a problem for the brighter, slower supernova light curves that appear bluer, and thus are not confused with reddened supernovae.)
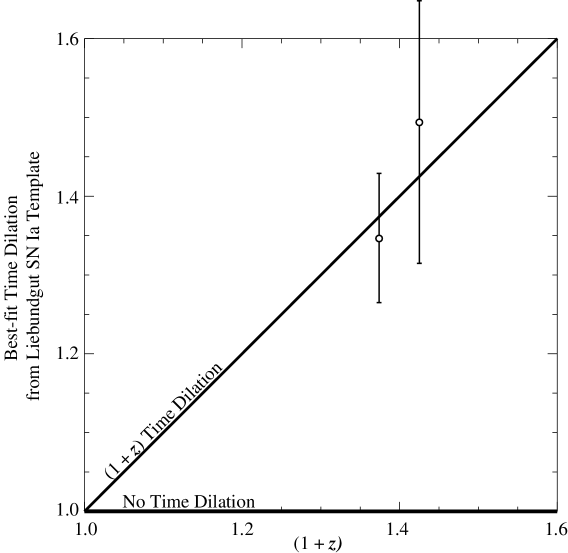
So far we have completed color analysis of points on the light curve for two of the supernovae, SN94H and SN94G. SN94H has an observed color near peak consistent with a rest-frame color of , indicating that this supernova is like the nearby SN 1991T, which has a stretch factor of . SN94G has an color lightcurve that is consistent with a supernova with , and not consistent with narrower light curve supernovae. (Note that neither of these light curves is consistent with significant reddening.) In Figure 3, we plot these two supernovae after dividing out the intrinsic width, , deduced from their color, and adding in quadrature the extra error bar’s uncertainty. On this plot the two models now appear as lines, not ranges.
It is clear from Figures 2 and 3, that the time dilation model is the much better fit to the data. The for the time dilation hypothesis, the diagonal line on Figure 3, while for the no-time-dilation hypothesis, the line along the x-axis. Thus for the majority of our distant SNe the values for are dominated by the cosmological time dilation. We are obtaining color information on all the more recent supernovae to make it possible to plot future observations on Figure 3, after identifying the intrinsic width from the color.
5 Historical note.
A measurement such as we have performed was first proposed by O. C. Wilson, in 1939, as a simple test of the conjecture that astronomical redshifts are explained by an expanding universe model, rather than, e.g., “the gradual dissipation of photonic energy,” later called the “tired light” model. The expanding universe has by now won almost universal acceptance, this classical test, while attempted by Rust ( 1974 ) has however never been demonstrated until now, due to the lack of sufficiently distant “standard clocks.” In an expanding universe, the time dilation, , should match the redshift of spectral features, , while a tired light model implies no time dilation, , at any redshift. (Even in an expanding universe, some “tiring” of light could occur, and this test could also be turned around to bound the extent to which photons lose energy traveling through intergalactic space.) While some of the errors in our fit of the lightcurve dilation-factor are large, it is clear that we have observed the time dilation of macroscopic clocks at cosmological distances.
6 Discussion
There is one source of concern that must still be addressed: how certain are the Type Ia identifications? We expect to find primarily Type Ia since these are the brightest SNe by typically 2 magnitudes. For three of our SNe we have spectral identification and their light curves are consistent with the other four. One of the remaining four SNe was discovered in an eliptical galaxy, and therefore is highly likely to be a Type Ia. In sum, the current set of data are very likely to all be SNe Ia.
Acknowledgements.
This work was supported in part by the National Science Foundation (ADT-88909616) and the U.S. Dept. of Energy (DE-AC03-76SF000098).References
- [1] Branch, D., Fisher, A., & Nugent, P. 1993. A.J. 106:2383.
- [2] Branch, D., Nugent, P., & Fisher, A. 1996. Paper in this conference.
- [3] Branch, D. & Miller,D. L. 1993. Ap.J.Lett.405:L5.
- [4] Hamuy, M., Phillips, M. M., Wells, L. A., & Maza, J. 1993. PASP, 105:787
- [5] Hamuy, M., et al. 1993b. A.J. 106:2392
- [6] Hamuy, M., Phillips, M. M., Maza, J., Suntzeff, N.B., Schommer, R., & Aviles, R. 1995. A.J., 109:1
- [7] James F. ”MINUIT, Function Minization and ERROR Analysis, Version 94.1”, CERN program Library long writeup D506.
- [8] Kim, A. et al. 1996 paper at this conf.
- [9] Kim, A., Goobar A., & Perlmutter S. 1996 P.A.S.P., in press.
- [10] Leibundgut, B., Tammann, G. A., Cadonau, R., & Cerrito, D. 1991. Astron. Astrophys. Suppl. Ser. 89:537.
- [11] Perlmutter, S., et al. 1995. Ap.J.Lett., 440, L41.
- [12] Perlmutter, S., et al. 1994b. International Astronomical Union Circular, nos. 5956 and 5958.
- [13] Perlmutter, S., et al. 1996. paper at this conference and to be published.
- [14] Phillips, M. M. 1993. Ap.J.Lett.413:L105.
- [15] Riess, A. G., Press, W. H., & Kirshner, R. P. 1995. Ap.J.Lett., 438, L17
- [16] Rust, B. W. 1974. Ph.D. Thesis Univ of Illinois ORNL 4953
- [17] Vaughan, T., Branch, D., Miller, D., & Perlmutter, S. 1995. Ap.J., 439, 558.
- [18] Vaughan, T., Branch, D., & Perlmutter, S. 1995. preprint.
- [19] Wilson, O. C. 1939. Ap. J. 90:634