2 Department of Astronomy, University of Padova, Vicolo dell’Osservatorio 5, 35122 Padova, Italy
C. Chiosi
Probing the Age of Elliptical Galaxies
Abstract
In this paper we address the question whether age and metallicity effects can be disentangled with the aid of the broad-band colours and spectral indices from absorption feature strengths, so that the age of elliptical galaxies can be inferred. The observational data under examination are the indices and , and the velocity dispersion for the sample of galaxies of Gonzales (1993), supplemented by the ultra-violet data, i.e. the colour (1550-V), of Burstein et al. (1988). The analysis is performed with the aid of chemo-spectro-photometric models of elliptical galaxies with infall of primordial gas (aimed at simulating the collapse phase of galaxy formation) and the occurrence of galactic winds. The galaxy models are from Tantalo et al. (1995). The study consists of four parts. In the first one, the aims are outlined and the key data are presented. In the second part, we summarize the main properties of the infall models that are relevant to our purposes. In the third part we present the detailed calculations of the spectral indices for single stellar populations and model galaxies. To this aim, we use the analytical relations of Worthey et al. (1994) who give index strengths as a function of stellar parameters. In the last part, we examine the age-metallicity problem. In contrast with previous interpretations of the and data as a sort of age sequence (Gonzales 1993), we find that the situation is more complicate when the space of the four variables , , (1550-V), and is examined. Galaxies in the and plane do not follow a pure sequence either of age or metallicity. The observed (1550-V) colours are not compatible with young ages. Basically, all the galaxies in the sample are old objects (say as old as 1315 Gyr) but have suffered from different histories of star formation. Specifically, it seems that some galaxies have exhausted the star forming activity at very early epochs with no significant later episodes. Others have continued to form stars for long periods of time. This is perhaps sustained by the analysis of the gradients in the and indices across the galaxies. There are galaxies with no age difference among the various regions. There are other galaxies in which large gradients in the mean age of the star forming activity between the central and the peripheral regions seem to exist. The nucleus turns out to be younger and more metal-rich than the outer regions. Finally, there are galaxies in which the nucleus is older but less metal-rich than the external regions. All this perhaps hints not only different histories of star formation but also different mechanisms of galaxy formation difficult to pin down at the present time. From the analysis of the , , (1550-V), and space, and of the age and metallicity gradients in single galaxies, the suggestion is advanced that the overall duration of the star forming activity is inversely proportional to the velocity dispersion (and perhaps galactic mass).
keywords:
Galaxies: ages - Galaxies: photometry - Ultraviolet: galaxies1 Introduction
These days, it is understood that age and metallicity govern the properties of the stellar populations in galaxies of different morphological type. Unfortunately, even in the simplest case of early-type galaxies (ellipticals), age effects often mask metallicity effects so that separating the two is a cumbersome affair (cf. Renzini 1986; Buzzoni et al. 1992, 1993; Worthey 1994 for more details). The age-metallicity dilemma originates from the fact that increasing either the metallicity or the age makes the integrated spectral energy distribution (ISED) of a single stellar population (SSP) redder.
The subject of galaxy ages has been tackled with different techniques of populations synthesis (evolutionary and optimizing, broad-band colours and narrow-band indices) with rather contrasting results.
From evolutionary synthesis models and broad-band colours the indication arises that elliptical galaxies are made of old stellar populations moderately metal rich and age of about 15 Gyr. Supplementary episodes of star formation at more recent epochs seem to be excluded.
In contrast, the optimized synthesis models (cf. O’ Connell 1986 and references) suggest that large age spreads are possible with a substantial contribution from young stars to the integrated light (for the prototype galaxy M32 as young as 5 Gyr).
Recently, the study of spectral indices reveals a powerful tool to discriminate age from metallicity effects. According to Buzzoni et al. (1992, 1993) the use of calibrated Mg2 and indices strengthens the conclusion reached with the broad-band colours. On the contrary, according to Gonzales (1993 and references) the indices and hint that a substantial age spread ought to exist.
The problem is further complicated by the poor knowledge of the star formation history of elliptical galaxies. Indeed the view that all elliptical galaxies are primordial old objects (cf. Bower et al. 1992a,b) coexists with the view that every elliptical galaxy is the product of merger events involving smaller galaxies (cf. Schweizer & Seitzer 1992, Alfensleben & Gerhard 1994, Charlot & Silk 1994).
In this work we would like to try a more articulated analysis aimed at separating age from metallicity effects. The study is based on the recent models for elliptical galaxies by Bressan et al. (1994), Tantalo (1994), and Tantalo et al. (1995), however implemented with the calibrations for narrow band indices obtained by Worthey et al. (1994). In order to separate the age from metallicity we look at the properties of the galaxies in the four dimensional space of the parameters , , , and velocity dispersion . The indices and are particularly suited to separate age from metallicity effects because is a measure of the turn-off colour and luminosity, and age in turn, whereas is more sensitive to the RGB colour and hence metallicity (Buzzoni et al. 1992, 1993, Gonzales 1993).
The paper is organized in the following way. Section 2 briefly summarizes current information on basic data for elliptical galaxies, i.e. the observational hints on metallicities and age ranges for the stellar content of elliptical galaxies and bulges, the line strength indices and the colour-magnitude relation (CMR) of elliptical galaxies and its current interpretation. Section 3 describes the recent models for elliptical galaxies by Bressan et al. (1994) and Tantalo et al. (1995). Section 4 presents the calculation of the narrow band indices for SSPs. Section 5 deals with the integrated narrow band indices for models of elliptical galaxies, with particular attention to the evolution in the - plane. Section 6 addresses the question whether the observed distribution in the - plane could result from recent bursts of star formation superposed to much older populations. Section 7 analyses data and theoretical predictions in the four dimensional space of coordinates , , , and , and presents a general discussion of the results emerging from this study. Section 8 deals with the gradients in and across individual galaxies, and proposes a new method to separate age from metallicity. In particular it shows that different regions of a galaxy may have different age and metallicity and provides clues to understand the mechanism of galaxy formation. Finally, Section 9 presents some concluding remarks.
2 Basic Observational data
In this section we summarize current information on basic data for elliptical galaxies that are either constraints or targets of our models.
2.1 Hints on metallicities and ages
Direct determinations of metallicities in elliptical galaxies are still rather limited. Most of the information comes from metal line-strength indices and their radial variations (Carollo et al. 1993, Carollo & Danziger 1994, Davies et al. 1993) or colour gradients (Schombert et al. 1993). The evidence arises that the metallicities for elliptical galaxies are solar or larger. Furthermore, for bright elliptical galaxies there are also indications that the -elements (O, Mg, Si, etc..) are enhanced with respect to Fe. The average [Mg/Fe], in particular, exceeds that of the most metal-rich stars in the solar vicinity by about 0.2-0.3 dex, and the ratio [Mg/Fe] is expected to increase with the galactic mass up to the this value. Due to their proximity, the metallicity of stars in the Galactic Bulge is currently measured by spectroscopic methods (cf. Rich 1990, McWilliam & Rich 1994). The mean metallicity is slightly lower than solar and long tails towards the metal-poor () and metal-rich end () are also present. High metallicities seem also to be indicated by the color-magnitude diagrams (CMD) of stellar populations in the bulges of nearby Galaxies (M31 and M32). In the case of M32 (Freedman 1989, 1992), these stars are most likely in the RGB and AGB phases and metallicities as high as [M/H]=0.1 are possible (cf. Bica et al. 1990, 1991). Concerning the age, from the magnitude of the brightest AGB stars in M32, Freedman (1989, 1992) concludes that a fraction of these could be as young as 5 Gyr.

2.2 Line strength indices and
Table 1 contains the key data relevant to our purposes, namely the fully corrected indices and and the velocity dispersion (km sec-1) of Gonzales (1993) for two different galaxy coverage, i.e. the central region within Re/8, where Re is the effective radius, and the wider region within Re/2. Column (1) is the galaxy identification NGC number, column (2) the logarithm of the index, column (3) is the logarithm of the index, column (4) is the logarithm of the velocity dispersion in km sec-1 for the Re/8-data. Columns (5), (6) and (7) show the same but for the Re/2-data. The content of the remaining columns will be described below.
The fundamental plane versus for the Re/8 data is shown in Fig. 1 together with the error bars for each galaxy. It is worth noticing that passing from the Re/8 to Re/2 data, there is a mean decrease in amounting 0.032, and a mean increase in amounting to 0.003.
| NGC | Note | - | S | - | B-V | B-V | V-K | V-K | - | |||||||
|---|---|---|---|---|---|---|---|---|---|---|---|---|---|---|---|---|
| (1) | (2) | (3) | (4) | (5) | (6) | (7) | (8) | (9) | (10) | (11) | (12) | (13) | (14) | (15) | (16) | (17) |
| Re/8 | Re/8 | Re/8 | R2/2 | Re/2 | Re/2 | |||||||||||
| 221 | 0.36 | 0.45 | 1.86 | 0.33 | 0.45 | 1.81 | 4.50 | 15.70 | 0.84 | 16.64 | ||||||
| 224 | 0.22 | 0.59 | 2.19 | 0.23 | 0.58 | 2.19 | 3.51 | 0.87 | ||||||||
| 315 | 0.24 | 0.57 | 2.51 | 0.25 | 0.54 | 2.49 | 23.61 | 1.00 | 24.61 | |||||||
| 507 | 0.24 | 0.55 | 2.42 | 0.31 | 0.53 | 2.42 | ||||||||||
| 547 | 0.20 | 0.58 | 2.37 | 0.15 | 0.55 | 2.34 | ||||||||||
| 584 | 0.32 | 0.55 | 2.29 | 0.31 | 0.52 | 2.23 | 3.93 | 21.72 | 0.93 | 0.94 | 3.18 | 22.66 | ||||
| 636 | 0.28 | 0.55 | 2.20 | 0.27 | 0.52 | 2.17 | 20.65 | 0.92 | 0.92 | 21.57 | ||||||
| 720 | 0.25 | 0.59 | 2.38 | 0.36 | 0.58 | 2.25 | 21.60 | 0.99 | 0.97 | 22.59 | ||||||
| 821 | 0.22 | 0.56 | 2.28 | 0.26 | 0.53 | 2.25 | 21.61 | 0.98 | 0.98 | 22.59 | ||||||
| 1453 | 0.20 | 0.58 | 2.46 | 0.23 | 0.55 | 2.42 | SS | 22.26 | 1.5 | 1.02 | ||||||
| 1600 | 0.19 | 0.60 | 2.50 | 0.24 | 0.60 | 2.49 | 23.17 | 0.97 | 0.98 | 3.34 | 24.14 | |||||
| 1700 | 0.32 | 0.55 | 2.36 | 0.32 | 0.52 | 2.35 | SS | 22.50 | 3.7 | 22.28 | 0.92 | 0.91 | 3.18 | 23.20 | ||
| 2300 | 0.23 | 0.58 | 2.40 | 0.21 | 0.56 | 2.35 | SS | 21.45 | 2.8 | 21.56 | 1.04 | 1.02 | 3.42 | 22.60 | ||
| 2778 | 0.25 | 0.56 | 2.19 | 0.19 | 0.53 | 2.11 | 18.14 | 0.91 | 19.05 | |||||||
| 3377 | 0.32 | 0.51 | 2.03 | 0.33 | 0.45 | 1.95 | SS | 19.06 | 1.5 | 19.49 | 0.90 | 0.90 | 2.95 | 20.39 | ||
| 3379 | 0.21 | 0.57 | 2.31 | 0.20 | 0.54 | 2.27 | 3.86 | SS | 20.44 | 0. | 20.17 | 0.97 | 0.96 | 3.26 | 21.13 | |
| 3608 | 0.23 | 0.57 | 2.25 | 0.24 | 0.53 | 2.21 | SS | 19.87 | 0. | 19.87 | 0.97 | 0.94 | 3.17 | 20.84 | ||
| 3818 | 0.23 | 0.58 | 2.24 | 0.26 | 0.52 | 2.18 | SS | 19.61 | 1.3 | 19.49 | 0.92 | 0.92 | 20.41 | |||
| 4261 | 0.13 | 0.59 | 2.46 | 0.11 | 0.56 | 2.43 | SS | 21.78 | 1.0 | 21.74 | 0.99 | 0.99 | 3.29 | 22.73 | ||
| 4278 | 0.19 | 0.56 | 2.37 | 0.22 | 0.53 | 2.31 | 2.88 | SS | 19.93 | 1.5 | 19.79 | 0.96 | 3.21 | 20.75 | ||
| 4374 | 0.18 | 0.56 | 2.45 | 0.19 | 0.54 | 2.43 | 3.55 | SSV | 21.80 | 2.3 | 21.85 | 0.98 | 0.95 | 3.28 | 3.29 | 22.73 |
| 4472 | 0.21 | 0.57 | 2.45 | 0.22 | 0.56 | 2.41 | 3.42 | V | 22.21 | 0.98 | 0.96 | 3.32 | 3.36 | 23.10 | ||
| 4478 | 0.26 | 0.55 | 2.11 | 0.24 | 0.52 | 2.13 | V | 19.44 | 0.89 | 3.13 | 3.24 | 20.33 | ||||
| 4489 | 0.38 | 0.47 | 1.67 | 0.36 | 0.42 | 1.61 | ||||||||||
| 4552 | 0.17 | 0.59 | 2.40 | 0.18 | 0.56 | 2.37 | 2.35 | V | 0.96 | 3.33 | 3.31 | 21.68 | ||||
| 4649 | 0.15 | 0.60 | 2.49 | 0.14 | 0.57 | 2.45 | 2.24 | 21.81 | 1.01 | 0.99 | 3.36 | 22.82 | ||||
| 4697 | 0.24 | 0.53 | 2.21 | 0.22 | 0.47 | 2.19 | 3.41 | SSV | 21.76 | 0. | 21.51 | 0.95 | 0.94 | 3.22 | 22.46 | |
| 5638 | 0.22 | 0.56 | 2.19 | 0.23 | 0.52 | 2.14 | ||||||||||
| 5812 | 0.23 | 0.58 | 2.30 | 0.23 | 0.56 | 2.26 | ||||||||||
| 5813 | 0.15 | 0.55 | 2.31 | 0.09 | 0.53 | 2.32 | 3.29 | |||||||||
| 5831 | 0.30 | 0.56 | 2.20 | 0.31 | 0.57 | 2.18 | SS | 20.28 | 2.6 | 20.22 | 0.95 | 3.42 | 21.85 | |||
| 5846 | 0.16 | 0.58 | 2.35 | 0.10 | 0.54 | 2.32 | 3.11 | 21.85 | 0.99 | 3.42 | 22.84 | |||||
| 6127 | 0.18 | 0.58 | 2.38 | 0.18 | 0.55 | 2.34 | ||||||||||
| 6702 | 0.39 | 0.53 | 2.24 | 0.40 | 0.51 | 2.22 | 3.26 | |||||||||
| 6703 | 0.27 | 0.55 | 2.26 | 0.26 | 0.51 | 2.22 | ||||||||||
| 7052 | 0.17 | 0.58 | 2.44 | 0.25 | 0.55 | 2.42 | ||||||||||
| 7454 | 0.33 | 0.45 | 2.03 | 0.32 | 0.40 | 2.04 | ||||||||||
| 7562 | 0.23 | 0.51 | 2.39 | 0.24 | 0.54 | 2.38 | 3.30 | |||||||||
| 7619 | 0.13 | 0.59 | 2.48 | 0.17 | 0.56 | 2.44 | SS | 22.23 | 0. | 22.35 | 1.01 | 1.02 | 3.47 | 23.36 | ||
| 7626 | 0.16 | 0.58 | 2.40 | 0.16 | 0.54 | 2.38 | SS | 22.28 | 2.6 | 22.36 | 1.00 | 1.00 | 3.39 | 23.36 | ||
| 7785 | 0.21 | 0.56 | 2.38 | 0.18 | 0.54 | 2.34 | 22.22 | 0.95 |
2.3 UV excess and colour
Much of the available information is from the study of Burstein et al. (1988). The main points are the following: (1) All studied elliptical galaxies have detectable flux short-ward of Å, with large galaxy to galaxy differences in the level of the UV flux. The intensity of the UV emission is measured by the colour (1550-V). (2) The colour (1550-V) correlates with the index Mg2, the velocity dispersion and the luminosity (mass) of the galaxy. The few galaxies (e.g. NGC 205) in which active star formation is seen do not obey these relations. (3) An important constraint is posed by the HUT observations by Ferguson et al. (1991) and Ferguson & Davidsen (1993) of the UV excess in the bulge of M31. In this case the UV emission shows a drop-off short-ward of about 1000 Å whose interpretation requires that the temperature of the emitting source must be about 25,000 K. Only a small percentage of the Å flux can be coming from stars hotter than 30,000 K and cooler than 20,000 K.
The colours of Burstein et al. (1988) are listed in column (8) of Table 1.
2.4 The CMR of early-type galaxies
Colours and magnitudes of elliptical galaxies define a mean CMR, according to which the colours get redder at decreasing absolute magnitude and hence increasing mass of the galaxies.
The slope of the CMR is commonly understood as indicative of a mass-metallicity sequence (Dressler 1984, Vader 1986) resulting from the effect of galactic winds (Larson 1974; Saito 1979a,b; Bressan et al. 1994). In brief, independently of their total mass, galaxies evolving as either closed or open boxes (cf. Tinsley 1980) should reach metallicities governed by the degree of gas gas consumption. Elliptical galaxies, having exhausted their gas, should possess almost identical (high) metallicities. Therefore, in order to have a mass-metallicity sequence, a mechanism halting star formation and thus leaving different metallicities must be invoked: galactic winds are the right agent (cf. Arimoto & Yoshii 1986, 1987; Matteucci & Tornambé 1987; Yoshii & Arimoto 1987; Bressan et al. 1994; Tantalo et al. 1995).
The tightness of the CMR seems to depend on the galaxy environment and could reflect the process of galaxy formation.
Looking at the CMR of Bower et al. (1992a,b) for galaxies in the largest known nearby clusters Virgo and Coma, the colour dispersion is very small (uncertainty in absolute magnitudes is less of a problem here), with typical rms scatter of 0.05 mag of which 0.03 mag can be accounted for by observational errors. Bower et al. (1992a,b) using the rate of colour change for SSPs of Bruzual (1983) argued that for the Hubble time Gyr and coordination in the galaxy formation process (their parameter ) the galaxy ages are confined in the range Gyr. It is an easy matter to check that the Bower et al. (1992a,b) conclusion neither depends on the particular rate of colour change they have adopted nor the use of single SSPs instead of a manyfold of SSPs with different chemical composition weighted on the past rate of star formation (thus closer to the complexity of a real galaxy). This can be checked using the SSPs of Bressan et al. (1994) and Tantalo et al. (1995) or the models presented below.
In contrast, examining the colour dispersion (relatively small also in this case) of the CMR for nearby galaxies in small groups and field, Schweizer & Seitzer (1992) found it compatible with recent mergers of spiral galaxies spread over several billion years. Also in this case the CMR implies a mass-metallicity sequence.
Since the interpretation of the CMR bears very much on the kind of process of galaxy formation and evolution, its use as a constrain on the galactic models has different implications. If the CMR is indicating nearly coeval, old galaxies ranked along a mass-metallicity sequence, passive evolution after the initial star forming activity and onset of galactic winds is appropriate. This facilitates the use of the CMR as a constrain on galactic models (cf. Bressan et al. 1994, Tantalo et al. 1995). In contrast, if the CMR is compatible with mergers spreading over long periods of time, first the evolutionary history of an elliptical galaxy is more complicated, and the use of the CMR as a constraint is less secure.
In order to cast light on this topic we try a closer inspection of the data and derive the CMR for the Gonzales (1993) sample to be compared with that of Bower et al. (1992a,b) and Schweizer & Seitzer (1992). Cross-checking of the three lists reveals that, while the Gonzales (1993) and the Schweizer & Seitzer (1992) samples have many objects in common (17 galaxies), there is only one galaxy in common to all the three groups (NGC 4374), and four in common to Gonzales (1993) and Bower et al. (1992a,b), namely the galaxy above plus NGC 4472, NGC 4478, and NGC 4552. The galaxy NGC 4374 is particularly interesting because Schweizer & Seitzer (1992) have estimated for it a merger age of about 7 Gyr.
In addition to this, we tried to assign magnitudes and colours to as many of the Gonzales (1993) galaxies as possible making use of magnitudes and colours taken from Bender et al. (1992, 1993) and Marsiaj (1992). All the data are presented in Table 1. Column (9) indicates whether the galaxy belong to the Schweizer & Seitzer (1992) list (SS) and/or the Virgo cluster (V or SSV); columns (10) and (11) are the magnitude and the fine structure parameter S, respectively, of Schweizer & Seitzer (1992). The parameter S is a rough measure of dynamical youth or rejuvenation (0 no trace of fine structure, 10 strong fine structure). Column (12) and (13) are the magnitude and colour (B-V), respectively, taken from Bender et al. (1992, 1993). In a few cases these magnitudes are somewhat different from those of Schweizer & Seitzer (1992). Columns (14) is the (B-V) colour listed by Marsiaj (1992). In general, it agrees with that of Bender et al. (1992, 1993). Columns (15) and (16) are the (V-K) colours of the Bower et al. (1992a,b) and Marsiaj (1992) lists, respectively. Also in this case, for the few galaxies in common the agreement is remarkable. This means that Marsiaj’s (1992) (V-K) colours assigned to the remaining galaxies (when possible) can be considered as reasonably good. Finally, column (17) lists the magnitude obtained from columns (12) and (13).
The resulting versus CMR is shown in panel (a) of Fig. 2, whereas that of Bower et al. (1992a,b) is displayed in panel (b). In this latter, we adopt for Virgo the distance modulus =31.54 (Branch & Tammann 1992) and apply to Coma the shift (cf. Bower et al. 1992a,b). In Fig. 2 we also plot the loci of constant ages (17, 10, 8 and 5 Gyr) for the models presented in Sect. 3. The comparison of the two CMRs yields the following results: (1) The slopes of the two CMRs agree each other and with the theoretical prediction. This means that both groups of galaxies reflect a similar mass-metallicity sequence. (2) Indeed the Bower et al. (1992a,b) CMR is less scattered than the one of Schweizer & Seitzer (1992), thus explaining the different interpretations. 3) NGC 4374 and NGC 4697, for which rather recent merger and accompanying stellar activities have been proposed by Schweizer & Seitzer (1992), are compatible with the Bower et al. (1992a,b) conclusion at the same time. 4) Finally, as galactic models are imposed to match the slope and the mean (V–K) colours of the CMR, the results do not depend on the particular CMR in usage. Therefore, owing to its better definition, we prefer to adopt the Bower et al. (1992) CMR to infer the slope of the underlying mass-metallicity sequence.

3 Theoretical models of elliptical galaxies
In this section we summarize the main properties of the models of elliptical galaxies used in the present analysis. They are taken from the studies of Bressan et al. (1994), Tantalo et al. (1995) in which an attempt is made to to explain in a coherent fashion the pattern of spectro-photometric properties of elliptical galaxies, i.e. the CMR, the origin of the UV excess and its dependence on the Mg2 index and total luminosity, etc. The models in question differ for the kind of description adopted to follow the chemical history of the galaxy: the one-zone closed-box scheme in Bressan et al. (1994) and the one-zone infall scheme in Tantalo et al. (1995), this latter aimed at simulating in a very simple fashion the formation of a galaxy by collapse of primordial gas (cf. Chiosi 1981 for more details).
(1) Elliptical galaxies are supposed to be made of two components, i.e. luminous material of mass embedded in a halo of dark matter of mass , whose presence affects only the gravitational potential of the galaxy and the binding energy of the gas. The key assumption of the closed-box models is that at the start of the star formation process (at time t=0) all the luminous mass is present in form of gas. In contrast, in the infall models the mass of the luminous component (supposedly in form of gas) is let increase with time according to
| (1) |
where is the accretion time scale. The constant is obtained from imposing that at the galaxy age a certain value of is reached. Therefore, the time dependence of is
| (2) |
As far as the dark component is concerned, we simply assume it to be constant in time and equal to a certain fraction of the asymptotic value of the luminous mass (), and to obey the spatial distribution with respect to given by the model of Bertin et al. (1992) and Saglia et al. (1992), according to whom good fits of elliptical galaxies are possible for ratios and equal to . With this assumption little effects are to be expected from the presence of dark matter.
(2) The stellar birth rate. i.e. the number of stars of mass M born in the time interval dt and mass interval dM is
| (3) |
where per is the rate of star formation as a function of time and chemical enrichment, while is the initial mass function (IMF). The rate of star formation is taken to be proportional to the available gas mass , i.e.
| (4) |
with . The constant of proportionality represents the inverse star formation time scale in suitable units. The IMF is the Salpeter law
| (5) |
with . The IMF is normalized by choosing the parameter
| (6) |
fixing the fraction of total mass in the IMF above and deriving the lower limit of integration . The upper limit of integration is , the maximum mass in our data base of stellar models, while the mass limit is the minimum mass contributing to the chemical enrichment of the interstellar medium over a time scale comparable to the total lifetime of a galaxy. This mass is approximately equal to .
| 3.0 | 0.10 | 12.0 | 0.26 | 0.0710 | 0.0360 | 2.088 |
| 1.0 | 0.10 | 7.2 | 0.31 | 0.0629 | 0.0307 | 0.648 |
| 0.5 | 0.10 | 5.2 | 0.35 | 0.0543 | 0.0265 | 0.295 |
| 0.1 | 0.10 | 3.0 | 0.34 | 0.0328 | 0.0166 | 0.041 |
| 0.05 | 0.10 | 2.5 | 0.29 | 0.0235 | 0.0122 | 0.016 |
| 0.01 | 0.10 | 1.0 | 0.43 | 0.0158 | 0.0080 | 0.002 |
(3) The detailed treatment of the chemical enrichment, i.e. without instantaneous recycling (cf. Tinsley 1980), is included so that the temporal evolution of chemical abundances is properly taken into account (see Bressan et al. 1994 for more details on the equations governing the chemical evolution of the models).
(4) The models include the presence of galactic winds triggered by the energy deposit into the interstellar gas due to the explosion of type I and II supernovae, and also stellar winds from massive stars. When the energy storage overwhelms the gravitational binding energy of gas this is supposed to be expelled from the galaxy thus halting further star formation. The prescription is exactly the same as in Bressan et al. (1994).
(5) The models are identified by the mass of the luminous component in units of (thereinafter referred to as ). We remind the reader that this mass never coincides with the present day mass in stars. In the closed-box models is the initial value of the luminous mass, part of which is converted into stars and part is expelled by galactic winds. Furthermore, the mass in living stars, , most contributing to the light emitted by a galaxy is subjected to decrease with time because of the continuous death of stars leaving collapsed remnants and gas. In the case of infall models is the asymptotic value of the luminous mass which is never reached because galactic wind is supposed to stop star formation and gas accretion at the same time (cf. Tantalo 1994, and Tantalo et al. 1995). The same arguments for the mass in stars given for the closed box models apply also to the infall models. In Table 2 we give the correspondence between and at the present age (15 Gyr).
(6) Finally, the isochrones at the base of the population synthesis calculations are from the Padua library (Bertelli et al. 1994). Ample ranges of chemical composition are considered, whose parameters Y and Z obey the enrichment law =2.5 (cf. Pagel 1989, Pagel et al. 1992). The main assumptions to be recalled here in view of the discussion below are (i) the use of the solar pattern of abundances for the so-called -elements with respect to Fe, [/Fe]=0; (ii) the use of in the mass loss rate along the RGB and AGB phases (cf. Bressan et al. 1994, Tantalo et al. 1995 for all details).
| Age | ||||||||
|---|---|---|---|---|---|---|---|---|
| 3.00 | 17.0 | -24.514 | -23.662 | 0.604 | 0.999 | 0.742 | 3.330 | 2.069 |
| 3.00 | 15.0 | -24.597 | -23.744 | 0.597 | 1.001 | 0.743 | 3.339 | 2.217 |
| 3.00 | 12.0 | -24.766 | -23.916 | 0.553 | 0.981 | 0.732 | 3.347 | 2.288 |
| 3.00 | 10.0 | -24.972 | -24.110 | 0.525 | 0.968 | 0.727 | 3.375 | 2.155 |
| 3.00 | 8.0 | -25.146 | -24.315 | 0.483 | 0.937 | 0.711 | 3.339 | 2.632 |
| 3.00 | 5.0 | -25.560 | -24.741 | 0.444 | 0.911 | 0.691 | 3.348 | 6.093 |
| 1.00 | 17.0 | -23.282 | -22.470 | 0.594 | 1.000 | 0.735 | 3.273 | 2.715 |
| 1.00 | 15.0 | -23.369 | -22.556 | 0.586 | 1.002 | 0.736 | 3.280 | 2.938 |
| 1.00 | 12.0 | -23.542 | -22.733 | 0.547 | 0.986 | 0.726 | 3.289 | 3.160 |
| 1.00 | 10.0 | -23.738 | -22.919 | 0.522 | 0.973 | 0.720 | 3.316 | 3.070 |
| 1.00 | 8.0 | -23.918 | -23.122 | 0.479 | 0.946 | 0.705 | 3.287 | 3.536 |
| 1.00 | 5.0 | -24.332 | -23.551 | 0.420 | 0.908 | 0.682 | 3.280 | 6.068 |
| 0.50 | 17.0 | -22.448 | -21.668 | 0.573 | 0.994 | 0.729 | 3.222 | 3.396 |
| 0.50 | 15.0 | -22.537 | -21.758 | 0.566 | 0.997 | 0.729 | 3.225 | 3.792 |
| 0.50 | 12.0 | -22.714 | -21.940 | 0.531 | 0.983 | 0.720 | 3.234 | 4.595 |
| 0.50 | 10.0 | -22.901 | -22.118 | 0.507 | 0.971 | 0.713 | 3.258 | 4.712 |
| 0.50 | 8.0 | -23.084 | -22.320 | 0.465 | 0.946 | 0.699 | 3.233 | 5.096 |
| 0.50 | 5.0 | -23.498 | -22.751 | 0.396 | 0.902 | 0.674 | 3.217 | 6.019 |
| 0.10 | 17.0 | -20.362 | -19.652 | 0.472 | 0.947 | 0.706 | 3.080 | 3.359 |
| 0.10 | 15.0 | -20.454 | -19.752 | 0.470 | 0.955 | 0.706 | 3.071 | 3.887 |
| 0.10 | 12.0 | -20.639 | -19.945 | 0.445 | 0.946 | 0.698 | 3.073 | 5.402 |
| 0.10 | 10.0 | -20.802 | -20.110 | 0.420 | 0.931 | 0.689 | 3.078 | 5.937 |
| 0.10 | 8.0 | -20.994 | -20.314 | 0.384 | 0.909 | 0.677 | 3.064 | 6.061 |
| 0.10 | 5.0 | -21.398 | -20.730 | 0.321 | 0.862 | 0.652 | 3.051 | 5.804 |
| 0.05 | 17.0 | -19.337 | -18.675 | 0.416 | 0.915 | 0.691 | 2.977 | 3.243 |
| 0.05 | 15.0 | -19.433 | -18.780 | 0.418 | 0.928 | 0.692 | 2.969 | 3.818 |
| 0.05 | 12.0 | -19.620 | -18.974 | 0.397 | 0.922 | 0.686 | 2.970 | 5.373 |
| 0.05 | 10.0 | -19.778 | -19.137 | 0.373 | 0.908 | 0.677 | 2.970 | 5.915 |
| 0.05 | 8.0 | -19.979 | -19.344 | 0.342 | 0.887 | 0.666 | 2.963 | 5.993 |
| 0.05 | 5.0 | -20.359 | -19.741 | 0.279 | 0.836 | 0.639 | 2.941 | 5.628 |
| 0.01 | 17.0 | -17.282 | -16.704 | 0.329 | 0.860 | 0.664 | 2.789 | 3.037 |
| 0.01 | 15.0 | -17.393 | -16.819 | 0.335 | 0.880 | 0.667 | 2.793 | 3.751 |
| 0.01 | 12.0 | -17.580 | -17.014 | 0.317 | 0.879 | 0.664 | 2.794 | 5.381 |
| 0.01 | 10.0 | -17.740 | -17.176 | 0.298 | 0.867 | 0.656 | 2.798 | 5.805 |
| 0.01 | 8.0 | -17.957 | -17.393 | 0.275 | 0.850 | 0.647 | 2.803 | 5.792 |
| 0.01 | 5.0 | -18.307 | -17.768 | 0.214 | 0.792 | 0.616 | 2.757 | 5.225 |
3.1 Main results for infall models
For the reasons amply discussed by Bressan et al. (1994) and Tantalo et al. (1995) infall models match the region 2000 - 3500 Å of the spectrum of an elliptical galaxy much better than the closed-box ones. Therefore in the analysis below we adopt the infall models of Tantalo et al. (1995). They successfully reproduce the CMR for Virgo and Coma galaxies by Bower et al. (1992a,b) and the UV properties of elliptical galaxies for the following parameters: enrichment law =2.5, infall time scale Gyr, , , and decreasing from 12 for the 3 galaxy down to 2.5 for the 0.05 object.
The main properties of these models are presented in Table 2 which contains the specific star formation efficiency , the age at the onset of the galactic wind, the maximum metallicity Z, the mean metallicity , and the mass in stars at the present epoch.
The chemical structure of the models is represented by the normalized, cumulative distribution of the mass in stars per metallicity bin at at the present epoch (say 15 Gyr) displayed in Fig. 3. It is worth noticing the very small percentage of stars of low metallicity as compared to the case of the closed-box models of Bressan et al. (1994).

A summary of the temporal evolution of absolute bolometric and visual magnitudes, and respectively, the broad-band colours , , , , and colour excess is given in Table 3 for selected values of the age. The CMR of these models is shown in Fig. 2 for various values of the age as indicated.
Like in Bressan et al. (1994) UV excess is generated by a suitable admixture of three components (see also Greggio & Renzini 1990). (1) The classical post asymptotic giant branch (P-AGB) stars (see Bruzual 1992, Bruzual & Charlot 1993, Charlot & Bruzual 1991) P-AGB stars are always present in the stellar mix of a galaxy. The major problem with these stars is their high effective temperature and the relation between their mass and that of the progenitor. The initial-final mass relationship is not firmly established. The most popular empirical determination is by Weidemann (1987). Matching this relation depends on the efficiency of mass loss during the AGB phase and other details of model structure (cf. Chiosi et al. 1992).
(2) The hot horizontal branch (H-HB) and AGB-manqué stars of very high metallicity (say ). which are expected to be present albeit in small percentages in the stellar content of bulges and elliptical galaxies in general. Indeed, these stars have effective temperatures in the right interval and generate ISEDs whose intensity drops short-ward of about 1000 Å by the amount indicated by the observational data. (Ferguson et al. 1991, Ferguson & Davidsen 1993). The formation of these stars can occur either with low values of the enrichment ratio () and strong dependences of the mass-loss rates on the metallicity (Greggio & Renzini 1990) or even with canonical mass-loss rates and suitable enrichment laws () as in Horch et al. (1992) and Fagotto et al. (1994a,b,c).
(3) Finally, the very blue HB stars of extremely low metallicity (Lee 1994). These stars have effective temperatures hotter than about 15,000 K but much cooler than those of the P-AGB stars. Therefore, depending on their actual effective temperature, they can generate ISEDs in agreement with the observational data. However, most likely they are not the dominant source of the UV flux because the analysis by Bressan et al. (1994) clarifies that in the wavelength interval Å the ISEDs of the bulge of M31 and of elliptical galaxies like NGC 4649 are fully consistent with the notion that virtually no stars with metallicity lower than ought to exist in the mix of these stellar populations.
Our model galaxies with =2.5 emit UV radiation by old H-HB stars only for ages older than about 5.6 Gyr and in presence of even a tiny fraction of stars in suitable metallicity bins (say ). The precise value of the age depends also on the final-initial mass relationship for the emitting stars (cf. Bressan et al. 1994, Tantalo et al. 1995 for details). Fig. 4 show the colour of our galactic models as a function of the age. It is worth pointing out the different behaviour of the colour passing from the 3 galaxy, in which H-HB, AGB-manqué, and P-AGB stars concur to generate the UV flux, to the 0.01 galaxy, in which only P-AGB stars produce the UV radiation. This trend is caused by the decreasing mean and maximum metallicity at decreasing galaxy mass (cf. Bressan et al. 1994 for details).

Concluding this section, it is worth pointing out that in our models the efficiency of star formation per unit mass of gas increases at increasing galactic mass ( goes from 2.5 to 12.0 as the mass increases from 0.05 to 3 ). This is the reason for the nearly constant value of age at which galactic winds occur halting star formation. Similar trend for the parameter has been invoked by Matteucci (1994) to explain the abundance ratios [Mg/Fe] observed in elliptical galaxies (see below).
3.2 General remarks on the models
We like to call the attention on three somewhat critical aspects of the models that could be used to invalidate the present analysis. The points in question are (i) the adoption of the one-zone description which does not allow us to take into account spatial gradients in colours and metallicity, (ii) the solar partition of abundances used in the stellar models, and finally (iii) our treatment of galactic winds.
(i) It is clear that the colours and magnitudes of the galaxies in the Bower et al. (1992a,b) sample refers to the whole galaxy, whereas the UV excess and its companion colour of Burstein et al. (1988) in most cases refer to the central region of a galaxy. This is also true for the various indices measured by Gonzales (1993) to be discussed below. The existence of gradients in colours and metallicities across elliptical galaxies is a well established observational fact (Carollo et al. 1993; Carollo & Danziger 1994, Davies et al. 1993, Schombert et al. 1993). This means that insisting on the one-zone description as in the present models, could be source of difficulty when comparing model results with observational data. It seems reasonable to argue that higher metallicities can be present in the central regions thus facilitating the formation of the right type of stellar sources of the UV radiation (H-HB and AGB manqué stars), whereas lower metallicities across the remaining parts of the galaxies would make the other integrated colours such as (V-K) bluer than expected from straight use of the one-zone model for the whole galaxy.
(ii) Recent observations indicate that the pattern of abundances in elliptical galaxies is skewed towards an overabundance of -elements with respect to Fe (cf. Carollo et al. 1993; Carollo & Danziger 1994). As already recalled, the library of stellar models in use is based on the standard (solar) pattern of abundances. Work is in progress to generate libraries of stellar models and isochrones with . Preliminary calculations for the solar metallicity (Z=0.02) show the effect to be small in the theoretical CMD. In addition, calculations of the Mg2 index from synthetic spectra for different metallicities and partitions of -elements (Barbuy 1994) show that passing from to the Mg2 index of an old SSP (15 Gyr) increases from 0.24 to 0.30.
(iii) Concerning galactic winds, we would like to comment on the recent claim by Gibson (1994) that Bressan et al. (1994) underestimate the effect of supernova explosions and on the contrary overestimate the effect of stellar winds from massive stars. In brief, Bressan et al. (1994) assuming the CMR to be a mass-metallicity sequence looked at the metallicity that would generate the right colours. They found that considering supernovae as the only source of energy, by the time the galactic winds occur, the gas fraction has become too low and the metallicity too high in turn, that the CMR is destroyed (it runs flat). To cope with this difficulty they included another source of energy, i.e. the stellar winds from massive stars. In analogy with the behaviour of a SN remnant’s thermal energy, which decreases with time as for times greater than , Bressan et al. (1994) assumed that the energy of stellar winds obeys the same law but with a different , i.e. for times greater than . The time was considered as a parameter. They found that yr is a good choice. This time roughly corresponds to the evolutionary lifetime of a 10 star. In other words it is the time scale over which a group of newly formed O-type stars would evolve away from the SSP. They found that shorter than this would not allow sufficient powering of the interstellar medium, so that galactic winds would occur much later than required by the CMR. Bressan et al. (1994) provided also an explanation for the different results found by other authors (Arimoto & Yoshii 1987, Matteucci & Tornambe’ 1987, Angeletti & Giannone 1990, and Padovani & Matteucci 1993). Admittedly, this additional source of energy was invoked to keep the standard interpretation of the CMR.
4 Narrow-band indices for SSPs and galaxies
In this paper we make use of the recent library of empirical calibrations of twenty one indices of absorption feature strengths calculated by Worthey (1992) and Worthey et al. (1994). The calibrations are presented in form of analytical fits that give the index strength as a function of stellar atmospheric parameters, i.e. , (gravity), and [Fe/H] both for warm (up to 13,260 K) and cool stars (down to 3570 K). The definition of the indices are given in Worthey (1992) and Worthey et al. (1994) to whom we refer. Suffice the recall here that the index is the geometric mean of the two indices and , = where in turn the index is the mean of the indices and , =( + )/2.
According to their definition, all indices are constructed by means of a central band-pass and two pseudo-continuum band-passes on either side of the central band (cf. Worthey et al. 1994 for details). The continuum flux is interpolated between the mid points of the pseudo-continuum band-passes.
The integrated indices for SSPs and model galaxies are calculated using the following method.
For every combination of , g and [Fe/H], first we derive the flux in the continuum band-pass from the library of stellar spectra used by Bressan et al. (1994) implemented by the revision of Tantalo et al. (1995), and then we calculate the flux in the central pass-bands with the analytical fits of Worthey et al. (1994) for the same values , g and [Fe/H]. Let us call and the flux in central pass-band and in the continuum, respectively.
The integrated and (thereinafter indicated as ) for the stellar content of a galaxy of age are given by
| (7) |
where is one of the two fluxes for a star of mass , metallicity , and age . Separating the contribution from single SSPs, the above integral becomes
| (8) |
where
| (9) |
are defined as the integrated fluxes, either or for a single SSP, i.e. of a coeval, chemically homogenous assembly of stars with age and metallicity Z.
Knowing the integrated fluxes either for a SSP or a galaxy, the definition of each index is applied to get back the integrated index.
The rate of star formation and initial mass function in equation (8) are the same as in equations (4), (5), and (6).
| Age | Mg2 | Age | Mg2 | |||||||
|---|---|---|---|---|---|---|---|---|---|---|
| 3.00 | 17.0 | 0.157 | 0.552 | 0.277 | 3.00 | 10.0 | 0.204 | 0.533 | 0.261 | |
| 1.00 | 17.0 | 0.167 | 0.536 | 0.265 | 1.00 | 10.0 | 0.209 | 0.517 | 0.250 | |
| 0.50 | 17.0 | 0.177 | 0.520 | 0.254 | 0.50 | 10.0 | 0.215 | 0.500 | 0.239 | |
| 0.10 | 17.0 | 0.211 | 0.468 | 0.221 | 0.10 | 10.0 | 0.241 | 0.446 | 0.205 | |
| 0.05 | 17.0 | 0.234 | 0.433 | 0.201 | 0.05 | 10.0 | 0.256 | 0.412 | 0.186 | |
| 0.01 | 17.0 | 0.278 | 0.368 | 0.170 | 0.01 | 10.0 | 0.284 | 0.349 | 0.157 | |
| 3.00 | 15.0 | 0.155 | 0.551 | 0.277 | 3.00 | 8.0 | 0.245 | 0.518 | 0.249 | |
| 1.00 | 15.0 | 0.163 | 0.535 | 0.265 | 1.00 | 8.0 | 0.245 | 0.502 | 0.238 | |
| 0.50 | 15.0 | 0.172 | 0.518 | 0.253 | 0.50 | 8.0 | 0.248 | 0.485 | 0.228 | |
| 0.10 | 15.0 | 0.201 | 0.466 | 0.219 | 0.10 | 8.0 | 0.273 | 0.430 | 0.195 | |
| 0.05 | 15.0 | 0.220 | 0.432 | 0.200 | 0.05 | 8.0 | 0.289 | 0.396 | 0.177 | |
| 0.01 | 15.0 | 0.257 | 0.369 | 0.169 | 0.01 | 8.0 | 0.315 | 0.334 | 0.150 | |
| 3.00 | 12.0 | 0.179 | 0.539 | 0.267 | 3.00 | 5.0 | 0.298 | 0.496 | 0.232 | |
| 1.00 | 12.0 | 0.185 | 0.524 | 0.255 | 1.00 | 5.0 | 0.308 | 0.476 | 0.220 | |
| 0.50 | 12.0 | 0.191 | 0.508 | 0.244 | 0.50 | 5.0 | 0.317 | 0.457 | 0.209 | |
| 0.10 | 12.0 | 0.216 | 0.457 | 0.212 | 0.10 | 5.0 | 0.345 | 0.400 | 0.179 | |
| 0.05 | 12.0 | 0.232 | 0.423 | 0.193 | 0.05 | 5.0 | 0.362 | 0.362 | 0.161 | |
| 0.01 | 12.0 | 0.261 | 0.360 | 0.163 | 0.01 | 5.0 | 0.394 | 0.291 | 0.133 |

Tabulations of indices for SSPs with different chemical composition and age are given in Table 4. In order to present results independent of the particular choice made for the IMF normalization, the SSPs of Table 4 are calculated assuming the Salpeter IMF with , and fixed lower and upper limits of integration, and , respectively. Care must be paid applying these indices for SSPs to real assemblies of stars (either clusters or galaxies).
The correlation between and for SSPs with different metallicities is shown in Fig. 5. The age goes from 1 Gyr to beyond 15 Gyr in steps of as indicated. The inspection of the data in Table 4 and comparison with similar results obtained by Gonzales (1993) show that excellent agreement exists between the two studies. The dip and the loop-like structure in the SSPs with the lowest and highest metallicity are caused by the onset of the HB and appearance of the H-HB stars, respectively. Only for the sake of provisional comparison we plot in Fig. 5 also the Re/2-data (open triangles) and Re/8-data (filled circles) of the Gonzales (1993) sample. It is soon evident that the locus drawn by the observations has the same slope of the SSPs with metallicity comprised between Z=0.02 and Z=0.05.
5 Elliptical galaxies in the - plane
With the aid of the technique described in the previous sections, we calculate the temporal evolution of the narrow band indices for model galaxies with different . Table 5 lists the indices and Mg2 of our galactic models at selected values of the age, namely 17, 15, 12, 10, 8 and 5 Gyr.
The evolutionary path of model galaxies in the - plane is shown in Fig. 6 together with the Re/8-data of the Gonzales (1993) sample. The galactic models are labelled by their . Along each sequence the age increases from the top to the bottom, going from 1 to beyond 15 Gyr as indicated. Although the Re/2-data would indeed be closer to the theoretical results for the one-zone models we are using, we prefer to adopt the Re/8-data referring to the central part of the galaxies. However, we would like to clarify that similar results would be obtained using the Re/2-data. Indeed passing from Re/2 to Re/8 the net effect is that and indices get slightly ”redder” by the quantities and as indicated by the vectors shown in Fig 6.
In any case, compared with the Re/8-data, our values for are somewhat bluer than observed. This could reflect the solar partition of abundances adopted for the stellar models in use. It could also mean that the very central parts of the galaxies are more metal-rich than predicted by the one-zone model. Indeed there is much better agreement between the Re/2-data and theoretical models. Therefore, we consider the above discrepancy to be marginal and not invalidating the analysis below. It will be taken into account whenever necessary. On the basis of the above remarks, we consider it reasonable to impose coincidence between our reddest models and the red edge of the observational distribution, and apply to the models an offset of . The required shift is comparable with the increase in the Mg2 index found by Barbuy (1994) for and reported in section 3.2. This shift will always be applied when comparing models with observations. The same is true for the Re/2-data. In such a case the shift along the axis amounts only to about .
As expected the evolutionary paths of the galaxies run parallel to that of SSPs. This is the consequence of interpreting the CMR as a mass-metallicity sequence, along which both the mean and the maximum metallicity of a galaxy are ultimately determined by the onset of galactic winds. In the canonical view of the CMR (slope), galactic winds and consequent interruption of the star forming activity occur earlier at decreasing galactic mass (lower mean and maximum metallicities). Since the subsequent evolution is passive at frozen chemical composition, the behaviour of a SSP is mimicked. Therefore, in the - plane galactic models shift to the left at decreasing mass and mean metallicity in turn, cf. the entries of Table 2 and the values marked along the line of Fig. 6 labelled ”CMR-strip” (see below) which shows the mean slope of the old isochrones (10 to 17 Gyr). The mean metallicity is annotated above, whereas the maximum metallicity is written below the line in correspondence to the galactic models with different .
For the purposes of comparison, in Fig. 6 we also show the most massive closed-box model of Bressan et al. (1994), namely the case with 3 (triangles). It is interesting to note the large effect passing from closed-box to infall models. At given , the closed-box models are much bluer both in and than the infall models. No galaxy is found in the region occupied by the closed-box model with 3 and lower. This is another argument in favour of the infall models.
In order to quantify the effect of variations in metallicity and age on the position of a galaxy in the - plane, we calculate the vectors and at constant age and constant metallicity. To this aim, we consider models of given to derive and and models of fixed age and different to get and , with obvious meaning of the symbols. We find the following relations over wide ranges of ages and metallicities
| (10) |
| (11) |
and
| (12) |
| (13) |
Looking at the data of Fig. 6, although some scatter is present along the axis, most of the galaxies fall into the region between the sequences with 0.5 and 3 . This implies that the metallicity distribution within most of the galaxies in the sample is quite similar with both the mean and maximum metallicity nearly identical (see the metallicity distributions of the 0.5 and galaxies shown in Fig. 3). However, there are a few galaxies (M32 and NGC 7454, in particular) that apparently fall along sequences of smaller and hence, in our scheme, lower metallicities. In contrast, there is a large scatter along the axis that seems to hint large variations in the age from galaxy to galaxy. This indeed is the conclusion reached by Gonzales (1993). For instance, the prototype galaxies M32 and NGC 4649 would turn out to be as young as 3 Gyr and as old as 17 Gyr, respectively.

There is a puzzling feature coming out from the close inspection of Fig. 6. In brief, as the galactic models have been constrained to match the slope and the colours of the CMR under the assumption that this latter a metallicity-mass sequence of old (say 15 Gyr), nearly coeval objects, we expect galaxies to be located in the - plane along a the line indicated as CMR-strip, which is the analog of the CMR of Fig 2. It is soon evident that the slope of the CMR-strip does not agree with the slope traced by the observational data. One may argue that this results from the lack of homogeneity between the samples of Gonzales (1993) and Bower et al. (1992a,b). Coevality holds for the cluster galaxies of Bower et al. (1992a,b), whereas the spread in age applies to the field galaxies of Schweizer & Seitzer (1992) and Gonzales (1993). In both cases, as the CMRs of cluster and field galaxies have similar slope, one would expect galaxies to scatter within the area comprised between the youngest and oldest isochrone pertinent to the sample.
In the scenario of coeval, old galaxies, the four objects of Bower et al. (1992a,b) in common with Gonzales (1993) – see the entries of Table 1 – should fall in the red corner of the - plane with little dispersion. This is not true, because NGC 4478 has a significantly bluer suggesting a younger age, much younger than the range permitted by the tightness of the CMR. Conversely, in the scenario of galaxies with different ages (as perhaps induced by mergers), the associated chemical enrichment must be such that galaxies acquire very similar metallicity distributions.
What we learn from this preliminary analysis of the observed distribution of galaxies in the - plane is:
-
•
In spite of their total luminosity and mass, most galaxies seem to possess nearly identical chemical structures.
-
•
Ages seem to vary from galaxy to galaxy.
-
•
Galaxies do not simply distribute along the locus expected for objects matching the mass-metallicity sequence of the CMR.
The following questions can be addressed: Is the age spread real ? Does it imply a truly different starting epoch of the star formation activity, or other effects could change the evolutionary path of a galaxy in the - plane and mimic a spread in age ? Why the predictions from the CMR do not find close correspondence in the - plane ?


6 Recent episodes of star formation ?
As already recalled, a growing body of literature on fine structures and kinematic anomalies suggest the early type galaxies were either formed or restructured by mergers in relatively recent times (cf. Schweizer & Seitzer 1992, Charlot & Silk 1994, and references). In addition, studies of population synthesis (Faber et al. 1992 and references) and photometric data (color-magnitude diagrams) of the stellar content in nearby galaxies (cf. the case of M32 by Freedman 1989, 1992) seem to suggest that E+S0 galaxies contain various admixtures of intermediate age stars. The merger hypothesis implies star burst of various intensity (cf. the models of merging spirals by Alfensleben & Gerhard 1994), whose net result is the formation of an E/S0 galaxy. It is worth clarifying here that the term ”merger” may refer to quite different views: either the classical merger of equal-mass spiral galaxies (Schweizer & Seitzer 1992) or most of the stars forming at an early epoch and very modest star formation at later epochs (low red-shifts) as pointed out by Charlot & Silk (1994), who apparently concluded that the data could not help to distinguish between these two scenarios.
How a recent burst of star formation, superposed to much older populations, would affect the evolutionary path of a galaxy in the - plane is easy to foresee by means of the following experiments. Having in mind the case of M32 for which the existence AGB stars as young as about Gyr (Freedman 1989, 1992) has been suggested, we suppose that at the arbitrary age of 12 Gyr a small burst of short duration occurs. The intensity of the burst is such that only 1.0% of the current luminous mass of the galaxy is turned into stars, whereas its duration is only yr. As expected and in analogy to what is known from similar experiments in the and colours (cf. the models of Alfensleben & Gerhard 1994), the occurrence of a burst of star formation induces a loop in the - plane. At the start of the burst both and get bluer, and when the burst is over they recover the previous values. This is shown in Fig. 7 and Fig. 8. For this burst, the recovery time scale is about 1 Gyr. Therefore, in order to be detected a burst of this type should have occurred as recently as 1 Gyr ago. Of course, the intensity and duration of the burst may change from galaxy to galaxy, so that both the amplitude of the loop in the - plane and the time scale at which the pre-burst values are recovered may be different from the ones we have been using. Stronger and longer bursts induces larger amplitudes of the loop and somewhat longer recovery time scales.
| Kpc | ergs | |||||
|---|---|---|---|---|---|---|
| 3 | 2.08 | 39.1 | 6.18(60) | 308 | 2.488 | 2.506 |
| 47.8 | 1.05(61) | 334 | 2.523 | |||
| 1 | 0.65 | 20.6 | 1.14(60) | 237 | 2.374 | 2.395 |
| 26.1 | 2.13(60) | 261 | 2.416 | |||
| 0.5 | 0.29 | 13.3 | 3.64(59) | 197 | 2.295 | 2.322 |
| 17.8 | 7.82(59) | 223 | 2.348 | |||
| 0.1 | 0.041 | 4.5 | 2.06(58) | 127 | 2.104 | 2.148 |
| 7.3 | 7.58(58) | 155 | 2.191 | |||
| 0.05 | 0.016 | 2.7 | 5.32(57) | 103 | 2.012 | 2.068 |
| 5.0 | 2.78(58) | 133 | 2.123 | |||
| 0.01 | 0.002 | 0.9 | 2.69(57) | 64 | 1.80 | 1.88 |
| 2.1 | 2.61(56) | 92 | 1.96 |
On the basis of these experiments, one could argue that the large spread along the direction is the result of a recent episode of star formation (either triggered by a merger or caused by an internal agent) superposed to an older population whose properties are temporarily masked by the star forming activity so that deciphering the true age of the system from the location in the - plane is not possible.
However, before accepting this conclusion, we feel it wise to examine in detail the correlation of and with the colour and the velocity dispersion .


7 The four-dimensional space - - and
The narrow range of the mean and maximum metallicities inferred from the - plane (with the few exceptions to be discussed separately), their relatively high values suggested by the comparison with theoretical models (see also the summary on observational hints), and the provisional hypothesis that all galaxies are old nearly coeval objects would imply that in contrast to the observations (see Table 1) all galaxies of our sample should emit UV radiation at comparable levels (see the variation of the colour as a function of the age for the 0.5 and 3 galaxies). Unless galaxies are younger than a few Gyr, this remark would apply also to the case in which a significant age difference from galaxy to galaxy is allowed.
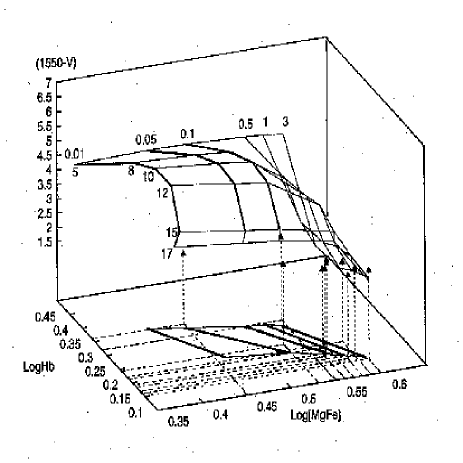
The situation is shown in the Fig. 9 and 10 displaying the separated relations - and - for the galaxies in Table 1. As well known the colour gets bluer (stronger UV flux) with increasing and decreasing . The data are compared with the locus of theoretical models with different , and mean metallicity in turn, and different age. The solid and dashed lines in Figs. 9 and 10 show the loci of constant mass and constant age, respectively. The comparison is made using the Re/8-data because the colours refer to the central region of the galaxies (cf. Burstein et al. 1988).
Our model galaxies with =2.5 emit UV radiation by old H-HB stars only for ages older than about 5.6 Gyr and in presence of suitable metallicities. Excluding the very initial stages with ongoing star formation in which strong UV flux can be generated, the colour quickly increases to a maximum and then decreases again (cf. Bressan et al. 1994, Tantalo et al. 1995). This means that in the age range 1 to 6 Gyr the - relation is almost insensitive to the age and very close to the 5 Gyr isochrone displayed in Fig. 9. Similar considerations hold for the diagram - of Fig. 10.
In the - plane (Fig. 9), but for two objects (M32 and NGC 584), all remaining galaxies have data compatible with ages from 8 to about 15 Gyr. The index of M32 and NGC 584 is too blue for their colour. The observed and of M32, in particular, could be matched only going to ages as young as about 1 Gyr. However, in such a case the corresponding colour would be much bluer than the observational value of 0.85.
No such discrepancy is found in the - plane of Fig. 10 where all galaxies are compatible with old ages from 8 to 17 Gyr. M32 in particular seems to have an age of about 13 Gyr.


To improve upon the above analysis we make use of three additional observational hints, i.e. the - , - , and - relations. The data refer to the central regions of the galaxies (the Re/8-data set of Table 1). For the sake of internal homogeneity, we adopt the and data of Burstein et al. (1988) limited to those objects classified by the authors as quiescent (no evidence of active star formation).
In order to estimate the velocity dispersion of galactic models we made use of the gravitational potential and a rough estimate of the radius of the luminous component. The gravitational potential is taken from Bertin et al. (1992) and Saglia et al. (1992),
| (14) |
where is the gravitational constant and
| (15) |
For , /=0.2 and /=0.2 as in Bertin et al. (1992) and Saglia et al. (1992 ) we get
| (16) |
The radius is derived from the Saito (1979a,b) and Arimoto & Yoshii (1986, 1987) relationships
| (17) |
Finally, the velocity dispersion as a function of is
| (18) |
It goes without saying that the theoretical velocity dispersion is affected by a large degree of uncertainty, a rough estimate of which can be evaluated considering as a sort of parameter ranging from the original value down to and taking for the mean of the two estimates (). All these quantities are given in Table 6.
In Fig. 11 we compare the theoretical - relations for different values of the age with the data. The scatter both in and is large, with galaxies falling along isochrones and lines of constant mass spanning an ample range of values. However, the hint arises that galaxies with large velocity dispersion are on the average older than galaxies with low velocity dispersion. In this diagram, M32 has an age of about 6-7 Gyr.
In Fig. 12 we compare the theoretical - relations with the data. But for a general agreement between the slopes of the observational and theoretical relation, the scatter of the data is so large that firm indications about the underlying ages are not possible. For the particular case of M32 an old age is most likely. There are galaxies (NGC 4489 and NGC 7562) that apparently deviate from the mean trend.
Finally, the theoretical - relations are superposed to the data in Fig. 13. Considering all the uncertainties, we draw the provisional conclusion that all objects of this sample are old. However, looking at the particular case of M32, it could be either as old as about 13 Gyr or as young as about 5 Gyr.
What we learn from the above analysis is that galaxies tend to cluster into two groups. In the first one (NGC 4649 as prototype) galaxies have old ages (say from 8 to 17 Gyr) and normal behaviour in the various planes. We cannot say whether the large age range is real or caused by the many uncertainties affecting the analysis. In the second group (M32 as a prototype), galaxies alternatively change from old to young according to the relationship under consideration, which is an obvious point of contradiction.
To explore further the cause of the above discrepancy, we look at the three-dimensional - - relation for the small group of galaxies for which the three parameters are simultaneously known (11 objects in total, cf. Table 1), and and compare it with the galactic models of 0.5 and 3 . The - - relation is shown in Fig. 14 for the Re/8-data. The various lines connect loci of constant age (thin) and constant mass (thick).
The inspection of the data in this space reveals that there is a group of galaxies (NGC 4649 as a prototype) whose age is confined in the range 13 15 Gyr (no better estimate is possible) and whose colour is normal and compatible with the theoretical expectation for old objects containing a certain fraction of high metallicity stars. Differences from object to object can be accounted for by differences in mass and hence mean metallicity and perhaps in age by as much as 3 Gyr (in agreement with the estimate from the colour dispersion ).
There is another group of galaxies (M32 and NGC 584 as prototypes) whose is too blue for their and . It seems as if in the - plane an old object has been shifted along the line pertinent to its mass by some recent episode of star formation which has changed without changing and significantly. The episode should not have occurred more recently than about 1 Gyr ago, otherwise the colour would have changed.
Among the various hypotheses that could be invoked to explain the puzzling distribution of data in the space of the parameters , , , and , namely very low metallicities, large range of absolute ages, and burst of star formation, this latter seems to be the only viable solution.
We have already shown in Fig. 7 and Fig. 8 how in the - plane an old, red galaxy would be rejuvenated by the occurrence of a burst of stellar activity. The extension and duration of the loops in the - plane depends on the intensity and duration of the burst, and whether or not chemical enrichment takes place. Since the detailed exploration of space of parameters characterizing a burst is beyond the scope of this study (in any case no independent observational hints are available), we limit ourselves to a few general considerations.
In the rather idealized case that a burst of star formation can occur with no accompanying chemical enrichment, the net effect would be a narrow loop along the evolutionary path of a galaxy of given mass. The recovery time scales for and colour are slightly different: the former depending on the intensity of the burst can be as long as 1 1.5 Gyr, whereas the latter as soon as star formation is over quickly goes back to the previous values. As chemical enrichment is excluded, no effects (or very small) can be seen in the index.


In the more realistic case, in which chemical enrichment accompanies the star burst, the evolution in the - plane is more complicated, because both and are now changed by the burst. The increase in metallicity would shift the galaxy (or part of it) to redder values of while performing the loop in the - plane.
The hypothesis of a burst of star formation while offering an elegant way out to the difficulties encountered above, renders the interpretation of these data more uncertain and arbitrary.
The key difficulty with this hypothesis, is that in the case of a primordial origin of elliptical galaxies (all coeval within the age range indicated by the CMR), a mechanism synchronizing the bursting activity among galaxies would be required.
In the other alternative that all or a number of elliptical galaxies are the product of a merger, the star burst hypothesis is viable and can account for the scatter along the axis. The only marginal requirement to be satisfied is that the bursting activity does not significantly change the global pre-burst metallicity distribution (see the narrow range of metallicities implied by the distribution in the - plane). This is the case in which most of the stars in the merging galaxies are formed at an early epoch and some small amount of star formation occurs at the merger epoch. The opposite alternative, in which most of the stars are formed in the burst, while easily explaining the scatter in , could perhaps introduce a scatter in metallicity much larger than that inferred from the observations.
8 Age and metallicity gradients in galaxies
The galaxies in our sample possess gradients in and passing from the Re/2 to the Re/8-data set (cf. Gonzales 1993 and the entries of Table 1) that likely reflect gradients in age and/or metallicity. In order to clarify the role played by these gradients in understanding the structure and the evolution of galaxies, we perform the following analysis. Let us define the quantities
| (19) |
| (20) |
where N and W stand for the Re/8- and R/2-data set, i.e. for the central regions and the whole galaxy, respectively.
The relation between and is shown in Fig. 15, in which the cross shows an estimate of the typical uncertainty affecting the data. The size of the error bars is assumed to be twice the mean value of the errors in the data of Fig. 1.
Despite the above uncertainty, with the aid of equations (13) through (16) we draw in Fig. 15 the system of coordinates represented by the two vectors and Gyr and centered on the (0,0) point of the - plane. The new system of coordinates represents the ageing and enriching vectors of galaxies or parts of these. Projecting the data of the - plane onto the new system of coordinates we get the mean age and metallicity differences, and , respectively, between the central regions and the whole galaxy. These quantities are given in Table 7 and their correlation is plotted in Fig. 16.
| NGC | NGC | |||||||||
|---|---|---|---|---|---|---|---|---|---|---|
| 221 | +0.00 | +0.03 | +0.006 | -3.962 | 4472 | +0.01 | -0.01 | +0.002 | +0.679 | |
| 224 | +0.01 | -0.01 | +0.002 | +0.679 | 4478 | +0.03 | +0.02 | +0.015 | -4.566 | |
| 315 | +0.03 | -0.01 | +0.009 | -0.604 | 4489 | +0.05 | +0.02 | +0.023 | -5.849 | |
| 507 | +0.02 | -0.07 | -0.006 | +7.962 | 4552 | +0.03 | -0.01 | +0.009 | -0.604 | |
| 547 | +0.03 | +0.05 | +0.021 | -8.528 | 4649 | +0.03 | +0.01 | +0.013 | -3.245 | |
| 584 | +0.03 | +0.01 | +0.013 | -3.245 | 4697 | +0.06 | +0.02 | +0.026 | -6.491 | |
| 636 | +0.03 | +0.01 | +0.013 | -3.245 | 5638 | +0.04 | -0.01 | +0.013 | -1.245 | |
| 720 | +0.01 | -0.11 | -0.017 | 13.887 | 5812 | +0.02 | +0.00 | +0.008 | -1.283 | |
| 821 | +0.03 | -0.04 | +0.004 | +3.358 | 5813 | +0.02 | +0.06 | +0.019 | -9.208 | |
| 1453 | +0.03 | -0.03 | +0.006 | +2.038 | 5831 | -0.01 | -0.01 | -0.006 | +1.962 | |
| 1600 | +0.00 | -0.05 | -0.009 | +6.604 | 5846 | +0.04 | +0.06 | +0.026 | -10.491 | |
| 1700 | +0.03 | +0.00 | +0.011 | -1.925 | 6127 | +0.03 | +0.00 | +0.011 | -1.925 | |
| 2300 | +0.02 | +0.02 | +0.011 | -3.925 | 6702 | +0.02 | -0.01 | +0.006 | +0.038 | |
| 2778 | +0.03 | +0.06 | +0.023 | -9.849 | 6703 | +0.04 | +0.01 | +0.017 | -3.887 | |
| 3377 | +0.06 | -0.01 | +0.021 | -2.528 | 7052 | +0.03 | -0.08 | -0.004 | +8.642 | |
| 3379 | +0.03 | +0.01 | +0.013 | -3.245 | 7454 | +0.05 | +0.01 | +0.021 | -4.528 | |
| 3608 | +0.04 | -0.01 | +0.013 | -1.245 | 7562 | -0.03 | -0.01 | -0.013 | +3.245 | |
| 3818 | +0.06 | -0.03 | +0.017 | +0.113 | 7619 | +0.03 | -0.04 | +0.004 | +3.358 | |
| 4261 | +0.03 | +0.02 | +0.015 | -4.566 | 7626 | +0.04 | +0.00 | +0.015 | -2.566 | |
| 4278 | +0.03 | -0.03 | +0.006 | +2.038 | 7785 | +0.02 | +0.03 | +0.013 | -5.245 | |
| 4374 | +0.02 | -0.01 | +0.006 | +0.038 |
The plane of Fig. 16 is divided in four quadrant’s characterized by the sign (either positive or negative) of and . The meaning of the four quadrant’s is as follows:
-
•
and : the nucleus is younger and more metal-rich than the external regions of the galaxy. This corresponds to a sort of out-inward process of galaxy formation, in which star formation in the nucleus continued for significant periods of time, up 10 Gyr in some cases. Looking at number of galaxies in this regions, this case seems to be the most probable in nature.
-
•
and : the nucleus is expected to be older and more metal-rich than the external regions. Only a few galaxies are found in this quadrant but with small differences in the age and metallicity. These galaxies could have been formed by a sort of in-outward mechanism on a rather short time scale.
-
•
and : the nucleus is older but less metal-rich than the external regions. These objects do not find a straightforward explanation. They could correspond to cases of merge in which an old compact primeval object with scarce chemical enrichment subsequently captured other smaller galaxies in which chemical enrichment has already proceeded to substantial levels.
-
•
and : the nucleus should be younger and less metal-rich than the external regions. No galaxy is found in this quadrant. This kind of galaxy structure and star formation in turn is not allowed.
-
•
There appears to be a tight correlation between and as indicated by the linear best-fit
(21) with in Gyr. This relation indicates that galaxies as a whole or their constituent parts in spite of the large variety of properties (masses, dimensions, colours, luminosities, etc.) are ultimately governed by age and metallicity, and that chemical enrichment in these obeys an universal law.
This analysis cannot yield the true ages and metallicities of the nuclear and peripheral regions of a galaxy but only their mean difference.
It goes without saying that the above results depend on the transformation from the - to the - plane. However, the transformation in use cannot be grossly in error because it stems from the properties of SSPs and model galaxies. As already amply discussed in the previous sections both match the data in the basic - .
The numerous group of galaxies in the first quadrant ( and ) is of particular interest. In spite of the afore mentioned uncertainty, for these galaxies we suggest that a sort of out-inward process of formation ought to have occurred, lasting in many cases up to several Gyr. In this context, it would be interesting to know whether the time correlates with other important parameters such as the velocity, dispersion , the mass to blue luminosity ratio , the effective radius Re, and the total mass. The inspection of the data contained in Tables 1 and 7, indicates that there could be a weak correlation between and the velocity dispersion :
| (22) |
where is in Gyr, is in , and the correlation coefficient is 0.43. This relation has been derived discarding the four objects with the longest, perhaps suspected, , namely NGC 547, NGC 2778, NGC 5813 and NGC 5846. Similar but weaker dependencies on the total mass and effective radius can be found.
Therefore, the hint arises that the time difference between the global and the nuclear activity decreases at increasing velocity dispersion and perhaps total mass. This time difference can be taken as an indication of the overall duration of the star forming period.
9 Concluding remarks
In this paper we have addressed the question whether age and metallicity effects on the stellar content of elliptical galaxies can be disentangled by means of broad-band colors and line strength indices derived from detailed chemo-spectro-photometric models. The main goal of our study is to cast light on a number of interwoven questions: are elliptical galaxies made only of old stars generated in a dominant initial episode of star formation? is there any evidence of subsequent star forming episodes ? If so, has this activity an internal origin or is it induced by the merger mechanism ?
The analysis of the observational data in the space of the parameters , , , and and of the gradients in and within individual galaxies allow us to draw a number of conclusions.
-
•
The distribution of galaxies in the - plane does not correspond to a mere sequence of metallicity with bluer galaxies significantly more metal-poor than the red ones. Metallicity effects are expected to broaden the distribution mainly along the axis.
-
•
Equally, the distribution of galaxies in the - plane does not constitute a mere sequence of age with bluer galaxies significantly younger than the red ones. Although some scatter in the age is possible, it is not likely to be as large as indicated by the formal match of data with isochrones in this diagram. M32 in particular according to its should have an age of about 3 Gyr, in disagreement with its =4.5 for which much older ages are needed according to the present theory of population synthesis.
-
•
The observed distribution of galaxies in the - plane does not agree with the CMR-strip on the notion that they evolve as passive objects in which star formation took place in an initial episode. Most likely, the history of star formation was more complicated than this simple scheme.
-
•
The observed colours are not compatible with ages younger that about 6 Gyr. UV excesses stronger than =5.5 at younger ages are possible only if the age is younger that Gyr. However, in such a case the remaining UBV colours would be too blue compared with the observational data. Most likely, all galaxies in the sample are globally older than at least 6 Gyr.
-
•
As far as ages are concerned, our analysis is still unable to give a definitive answer. Besides the group of galaxies like M32 and NGC 584 whose properties lead to contrasting results depending on the particular relationship among the four parameters , , and under examination, the remaining galaxies appear to span a wide range of ages going from 8 to 15 Gyr. However, this large scatter can be partly due to observational uncertainties and partly to a real age spread. It is worth pointing out that for the very small subgroup of galaxies with all the four parameters simultaneously available, the objects with an old age ( Gyr) like NGC 4649 show an age spread amounting only to about 3 Gyr, which is consistent with the small scatter in the CMR of cluster galaxies.
-
•
The present analysis cannot yet cast light on the dominant mechanism by which elliptical galaxies are formed. However, the following considerations can be made. If elliptical galaxies are all old, coeval and evolving in isolation, the difficulties encountered with the interpretation of the , , , and data can be removed by invoking later mild episodes of star formation. The major problem with this suggestion is that in the case of evolution in isolation, some mechanism synchronizing the bursts of star formation should be required in order to dislocate galaxies from the CMR-strip to their observed location in the - plane. Indeed, even if the statistics is limited, no galaxies are seen along the CMR-strip but for those at the red end. A simple way out could be that the star forming activity is limited to the nuclear region, thus affecting the index without changing significantly the global value of the broad-band colours (cf. the case of NGC 4374 and NGC 4697 for which little age scatter is indicated by the CMR, whereas a significant age scatter is suggested by the indices). No such difficulty would exist if already formed ellipticals suffer in more recent times from interaction with other small size galaxies (for instance the capture of small gas rich systems) thus inducing some mild star formation activity with some chemical enrichment. Equally, if elliptical galaxies are the result of classical mergers of spiral galaxies. In such a case a spread in mimicking an age sequence for the resulting composite population would naturally follow. The accompanying chemical enrichment can be easily adjusted to match the small observational scatter along the axis.
-
•
Although based on a handful of objects, there is a interesting scenario emerging from the analysis of the four dimensional space , , , and . In brief, galaxies of high velocity dispersion tend to be confined at the red end of the - distribution. Their properties are consistent with being old objects (some scatter in the age is perhaps possible) that are able to exhaust the star forming process at very early epochs with no need for later episodes of stellar activity. In contrast, galaxies of lower velocity dispersion have more contrasting properties. It seems as if in these systems star formation, following the initial activity most likely at epochs as old as in other galaxies, later went through a series of episodes taking place in different epochs that vary from galaxy to galaxy. Equivalently, it could be that star formation continued perhaps at minimal levels over significantly longer periods of time. This would mimic a sort of age sequence.
-
•
The analysis of the gradients in and within individual galaxies has revealed that for the majority of these the nucleus is younger and more metal-rich than the peripheral regions, thus resembling a out-inward mechanism of galaxy formation, and that the global process of star formation may last very long, with duration varying from galaxy to galaxy. It seems that the duration of the star formation activity is inversely proportional to the galactic velocity dispersion and perhaps mass. There are two less numerous subgroups for which the nucleus is older and more metal-rich or older and less-metal rich than the periphery of the galaxy. The interpretation of these structure is not straightforward and it is left to future investigation.
-
•
The fact that most galaxies are found in the group characterized by a younger and more metal-rich nucleus calls to mind the fact that recent bursts of star formation in the merger scenario are expected to peak in the centers of elliptical galaxies (Alfensleben & Gerhard 1994). However, an internal cause related to the building up process of galaxy formation cannot be excluded as perhaps suggest by the correlation between velocity dispersion and .
-
•
The idea that the overall duration of the star forming activity is inversely proportional to the velocity dispersion and perhaps mass of galaxies does not contradict the current information of abundance ratios in elliptical galaxies (Carollo et al. 1993, Carollo & Danziger 1994, Matteucci 1994). Indeed it would be consistent with the expected trend for the ratio [Mg/Fe] inferred from the narrow band indices (Faber et al. 1992; Worthey et al. 1992; Davies et al. 1993). From the comparison of the observed indices with model indices, assuming solar partition of elemental abundances, it is concluded that the average [Mg/Fe] in giant elliptical galaxies exceeds that of the most metal rich stars in the solar vicinity by about 0.2-0.3 dex. Furthermore, the ratio [Mg/Fe] is expected to increase with the galactic mass up to the this value. According to Matteucci (1994) a possible explanation of this trend is that the efficiency of star formation is an increasing function of galactic mass. As a consequence of this, massive ellipticals should have formed on shorter time scales than smaller ellipticals. In brief, the constant super-solar value for giant ellipticals hints that only an unique source of nucleosynthesis is contributing to chemical enrichment. This is just the case of massive stars exploding as type II supernovae and thus releasing elemental species (Mg and Fe in particular) in fixed proportions. This implies a short time scale of star formation, i.e. of about 0.1 Gyr. The trend decreasing with galactic mass means that another source of Fe intervenes altering the [Mg/Fe] ratio. It is worth recalling that Mg is produced by massive stars. Therefore, it is the contribution to Fe that must change. The goal is achieved invoking type I supernovae generated by mass accreting white dwarfs in binary systems. The minimum time scale for their formation is longer than 0.1 Gyr. This implies a longer duration of the star forming period. In this context, we would like to recall that in order to match the CMR with our infall models we had to increase the efficiency parameter by a factor of 12 as the galactic mass increases from 0.01 to 3 . Furthermore, the duration of the star forming activity determined by the onset of galactic winds was found to decrease with the galactic mass (see in Table 2). The trend is small but in the right direction.
Acknowledgements.
The authors deeply thank an anonymous referee for so carefully reading an early draft of this paper and for making some very useful comments which improved the manuscript. The financial support from the Italian Ministry of University, Scientific Research and Technology (MURST) and the Italian Space Agency (ASI) is also gratefully acknowledged.References
- [1] Alfensleben U-F., Gerhard O. E. 1994, A&A 285, 751
- [2] Angeletti L., Giannone, P. 1990, A&A 234, 53
- [3] Arimoto N., Yoshii Y. 1986, A&A 164, 260
- [4] Arimoto N., Yoshii Y. 1987, A&A 173, 23
- [5] Barbuy B. 1994, ApJ 430, 218
- [6] Bender R., Burstein D., Faber S.M. 1992, ApJ 399, 462
- [7] Bender R., Burstein D., Faber S.M. 1993, ApJ 411, 153
- [8] Bertelli G., Bressan A., Chiosi C., Fagotto F., Nasi E. 1994, A&AS 106, 275
- [9] Bertin G., Saglia R. P., Stiavelli M. 1992, ApJ 384, 423
- [10] Bica E., Alloin D., Schmidt A. 1990, A&A 228, 23
- [11] Bica E., Barbuy B., Ortolani S. 1991, ApJ 382, L15
- [12] Bower R. G., Lucey J. R., Ellis R. S. 1992a, MNRAS, 254, 589
- [13] Bower R. G., Lucey J. R., Ellis R. S. 1992b, MNRAS 254, 601
- [14] Branch D., Tammann G. A. 1992, ARA&A 30, 359
- [15] Bressan A., Chiosi C., Fagotto F. 1994, ApJS 94, 63
- [16] Bruzual G. 1992, in The Stellar Populations of Galaxies, B. Barbuy and A. Renzini (eds.), Kluwer Academic Publishers, Dordrecht, p. 311
- [17] Bruzual G., Charlot S. 1993, ApJ 405, 538
- [18] Bruzual G. 1983, ApJ 273, 105
- [19] Burstein D., Bertola F., Buson L. M., Faber S. M., Lauer T.R. 1988, ApJ 328 440
- [20] Buzzoni A., Chincarini G., Molinari E. 1993, ApJ 410, 499
- [21] Buzzoni A., Gariboldi G., Mantegazza L. 1992, AJ 103, 1814
- [22] Carollo C. M., Danziger I. J. 1994, MNRAS 270, 523
- [23] Carollo C. M., Danziger I. J., Buson L. 1993, MNRAS 265, 553
- [24] Charlot S., Bruzual G. 1991, ApJ 367, 126
- [25] Charlot S. & Silk J. 1994, ApJ 432, 453
- [26] Chiosi C. 1981, A&A 83, 206
- [27] Chiosi C., Bertelli G., Bressan A., 1992, ARA&A 30, 305
- [28] Chiosi C., Bressan A. 1995, A&A, to be submitted
- [29] Davies R. L., Sadler E. M., Peletier R. F. 1993, MNRAS 262, 650
- [30] Dressler 1984
- [31] Faber S.M., Worthey G., Gonzales J.J. 1992, in The Stellar Population of Galaxies, B. Burbuy and A. Renzini eds., Kluwer Academic Publishers, Dordrecht, 255
- [32] Fagotto F. 1995, A&A, submitted
- [33] Fagotto F., Bressan A., Bertelli G., Chiosi C. 1994a, A&AS 100, 647
- [34] Fagotto F., Bressan A., Bertelli G., Chiosi C. 1994b, A&AS 104, 365
- [35] Fagotto F., Bressan A., Bertelli G., Chiosi C. 1994c, A&AS 105, 39
- [36] Ferguson H. C., Davidsen A. F. 1993, ApJ 408, 92
- [37] Ferguson H. C., Davidsen A. F., Kriss G. A., et al. 1991, ApJ 382, L69
- [38] Freedman W. L. 1989, AJ 98, 1285
- [39] Freedman W. L. 1992, AJ 104, 1349
- [40] Gibson B.K. 1994, MNRAS 271, L35
- [41] Gonzales J.J. 1993, Ph.D. Thesis, Univ. California, Santa Cruz
- [42] Greggio L., Renzini A. 1990, ApJ 364, 35
- [43] Horch E., Demarque P., Pinsonneault M. 1992, ApJ 388, L53
- [44] Larson R. B. 1974, MNRAS 166, 585
- [45] Lee Y-W. 1994, ApJ 423, 248
- [46] Marsiaj P. 1992, Master Thesis, University of Padua, Italy
- [47] Matteucci F. 1994, A&A 288, 57
- [48] Matteucci F., Tornambe’ A. 1987, A&A 185, 51
- [49] McWilliam A., Rich R. M. 1994, ApJS 91, 749
- [50] O’Connell R. 1986, in Spectral Evolution of Galaxies, C. Chiosi and A. Renzini (eds.), Dordecht: Reidel, p. 195
- [51] Padovani P., Matteucci F. 1993, ApJ 416, 26
- [52] Pagel B.E.J. 1989, in Evolutionary Phenomena in Galaxies, J. Beckmam and B. E. J. Pagel (eds.), Cambridge University Press: Cambridge, p. 201
- [53] Pagel B.E.J., Simonson E.A., Terlevich, R. J., Edmunds M.G. 1992, MNRAS 255, 325
- [54] Renzini A. 1986, in Stellar Populations, C. A. Norman, A. Renzini, M. Tosi (eds.), Cambridge University Press: Cambridge, p. 213
- [55] Rich R. M. 1990, ApJ 362, 604
- [56] Saglia R. P., Bertin G., Stiavelli M. 1992, ApJ 384, 433
- [57] Saito M. 1979a, PASJ 31, 181
- [58] Saito M. 1979b, PASJ 31, 193
- [59] Schombert J. M., Halan P.C., Barsony M., Rakos K.D. 1993, AJ 106, 923
- [60] Schweizer F. & Seitzer P. 1992, AJ 104, 1039
- [61] Tantalo R. 1994, Master Thesis, University of Padua, Italy
- [62] Tantalo R., Chiosi C., Bressan A., Fagotto F. 1995, A&A, submitted
- [63] Tinsley B. M. 1980a, ApJ 241, 41
- [64] Tinsley B. M. 1980b, Fundamentals of Cosmic Physics 5, 287
- [65] Vader J.P. 1986, ApJ 306, 390
- [66] Weidemann V. 1987, A&A 188, 74
- [67] Worthey G. 1992, Ph.D. Thesis, Univ. California, Santa Cruz
- [68] Worthey G. 1994, ApJS, 95, 107
- [69] Worthey G., Faber S.M., Gonzales J.J., Burstein D. 1994, ApJS 94, 687
- [70] Yoshii Y., Arimoto N. 1987, A&A 188, 13