On the Origin of the UV Continuum Emission from the High Redshift Radio Galaxy 3C25611affiliation: Based on observations at the W. M. Keck Observatory.
Abstract
We report spectropolarimetric observations obtained with the W. M. Keck Telescope of the high redshift (z=1.824) aligned radio galaxy 3C256. Our observations confirm that the spatially extended UV continuum emission from this galaxy is polarized () with the electric vector perpendicular to the aligned radio and optical major axes (). This strongly suggests that a significant fraction of the rest frame UV continuum emission from the galaxy is not starlight, but is instead scattered light from a powerful AGN which is hidden from our direct view. The narrow emission lines, including MgII, are unpolarized. The percentage polarization of the continuum emission and the polarization position angle are roughly constant as a function of wavelength. Although the present data do not permit us to discriminate between cool electrons and dust as the origin of the scattering, scattering by a population of hot ( K) electrons cannot be the dominant process, since such a population would overproduce X-ray emission. A large population of cooler electrons ( K) could be responsible for both the line emission and the scattered light, but would require that the dust to gas ratio in the scattering cones is times smaller than that in our Galaxy and would imply that a large fraction of the baryonic mass in the galaxy is in the ionized component of its interstellar medium. Dust scattering is more efficient, but would result in detectable extinction of the emission line spectrum unless the dust distribution is more highly clumped than the line emitting gas. Finally, we detect a strong (Å) broad (FWHM 6500) absorption line centered at Å. We discuss several possibilities for its origin and conclude that the most likely candidate is absorption by a high velocity BAL cloud near the nucleus of 3C256.
To appear in ApJ, July 1, 1996, vol. 465
1 Introduction
Radio galaxies are often regarded as important probes of galaxy evolution primarily because they are the only spatially extended, ‘galaxy–like’ objects that are detectable to very large lookback times. Until recently, most evolutionary studies of these objects were founded on the assumption that their observed optical continuum emission is dominated by unreddened starlight (Bruzual 1986; Djorgovski, Spinrad, & Marr 1985). The uniformity of the observed Hubble diagram (e.g., McCarthy 1993, Eales et al. 1993), and the fairly symmetric and undisturbed near infrared morphologies of high redshift radio galaxies seem to support this basic picture of radio galaxies as quiescently evolving elliptical galaxies.
However, three discoveries made during the last decade have thrown this complacent view of high redshift radio galaxies as young ellipticals into considerable disarray. The first is that the observed optical (rest frame UV) morphologies of high redshift radio galaxies are aligned with their radio axes (McCarthy et al. 1987, Chambers et al. 1987), suggesting a causal relationship between the active nucleus and the extended optical continuum emitting material (e.g., Dunlop and Peacock 1993). The second is the discovery that the rest frame UV continuum emission is generally highly polarized with the electric vector oriented perpendicular to the radio axis (di Serego Alighieri et al. 1989, 1993, 1994; Jannuzi & Elston 1991), which implies that a significant fraction of the observed optical continuum emission is nonstellar, and arises from processes related to the active nucleus. In fact, di Serego Alighieri et al. (1994) detect a polarized, possibly broad MgII emission line, suggesting that the intrinsic nuclear source is indeed similar to that in quasars. Finally, the recent HST observations of the spectacular, complex morphologies of high redshift radio galaxies (Miley et al. 1992, Dickinson, Dey, & Spinrad 1996, Dey et al. 1996a, Longair, Best, & Röttgering 1995) are in stark contradiction to the idea that these objects are normal ellipticals. Although these data bode ill for evolutionary studies of stellar populations in high redshift radio galaxies at optical wavelengths, they provide the opportunity to investigate the nature of the hidden active nucleus in these galaxies, the interactions between the AGN and the ambient environment, and the relevance of these interactions to the evolution of powerful AGN. They may also provide constraints on the chemical evolution (and dust formation) timescale of early galaxy evolution.
One question crucial to the study of these high redshift galaxies is: what is the origin of their peculiar, aligned morphologies? Several mechanisms have been proposed to explain the alignments (see McCarthy 1993 for a review). Star formation triggered by the radio source (DeYoung 1981, 1989, Rees 1990), scattering of light from a hidden AGN off dust or electrons (di Serego Alighieri et al. 1989, Fabian 1989), and inverse Compton scattering of cosmic microwave background photons by relativistic electrons in or near the radio lobes (Daly 1992) appear to be the most relevant physical processes at high redshift. Spectropolarimetric observations can help distinguish between these processes: if the continuum emission is dominated by unreddened starlight from a young population of stars, the continuum should be unpolarized and should show stellar absorption features. Alternatively, if scattered AGN light is the dominant constituent of the extended continuum light, then the continuum should be highly polarized with the electric vector perpendicular to the optical major axis, and the spectrum of the polarized flux should be similar to that of a quasar showing broad emission lines. In addition, if the mechanism responsible for the alignment effect is scattering, spectropolarimetric observations of high redshift galaxies provide us with the ability to investigate the properties of gas and dust in the environs of these high redshift galaxies at a large lookback time. For inverse Compton scattering, the continuum polarization is likely to be low, and there should be a fairly close spatial coincidence between the optical/UV rest frame continuum and the low frequency radio continuum emission, which is generally not observed (e.g., Miley et al. 1992, Dickinson, Dey, & Spinrad 1995, Dey et al. 1996a, Longair, Best, & Röttgering 1995).
In this paper, we present spectropolarimetric observations of the high redshift (z=1.824) radio galaxy 3C256 obtained using the W. M. Keck Telescope. This paper is the first missive from an ongoing project to determine the origin of the UV continua of high redshift radio galaxies, in an effort to understand their morphological and evolutionary properties.
3C256 is a particularly good target for a detailed spectropolarimetric study for several reasons. First, 3C256 is an excellent example of the alignment effect: the optical (rest frame UV) morphology is well aligned with the radio axis, has a relatively high surface brightness, and is spatially extended over similar scales as the radio source (Fig. 1). Second, broad band imaging polarimetric observations have shown that the continuum emission from 3C256 is polarized and spatially extended (Jannuzi 1994, Jannuzi et al. 1995). 3C256 can therefore provide an important test of the AGN unification hypothesis, which attributes the different observed properties of radio galaxies and quasars primarily to the effects of orientation and obscuration (see Antonucci 1993, and references therein). If the continuum emission is dominated by scattered light from a hidden quasar nucleus, then spectropolarimetric observations allow a search for the broad line component in the scattered flux. Third, 3C256 is considered to be a candidate protogalaxy because of its large Ly luminosity, a blue continuum spectral energy distribution, similar optical and infrared morphologies (Spinrad & Djorgovski 1984, Spinrad et al. 1985, Eisenhardt, personal communication), and a magnitude that is 1 mag fainter than that predicted by the mean relation for radio galaxies (Eisenhardt & Dickinson 1992, Eales et al. 1993). Since the integrated continuum from the galaxy is known to be polarized (Jannuzi 1994, Jannuzi et al. 1995), it is important to determine the true spectral energy distribution of the stellar population after subtracting out the scattered component. Finally, in a study of the coadded spectrum of high redshift radio galaxies, in which the signal was dominated by 3C256, Chambers & McCarthy (1990) reported the tentative detection of absorption lines typical of young stellar populations and argued that the rest frame UV continuum emission from the extended aligned component in these objects is dominated by starlight. The deep total light spectrum that results from our co-added spectropolarimetric observations allows the most sensitive search to date for stellar absorption features in a single radio galaxy.
We describe our observations in section 2, and present our primary results in section 3. A discussion of these results and some preliminary spectroscopic information derived from the same data are presented in section 4.
Throughout this paper we assume that =50 and =0.1. The scale at (the redshift of 3C256) is then 11.3 kpc/′′ and the lookback time is nearly 12 Gyr, or 72% of the age of the universe. In comparison, for =75 and =0.5 the angular scale is 5.6 kpc/′′ and the lookback time is 6.9 Gyr, or 79% of the age of the universe.
2 Observations
3C256 was observed using the Keck spectropolarimeter with the Low Resolution Imaging Spectrometer (LRIS; Oke et al. 1995) at the Cassegrain focus of the 10-m W. M. Keck Telescope on U.T. 1995 March 1. The spectropolarimeter is a dual beam instrument which uses a calcite analyser and a rotatable waveplate (see Goodrich et al. 1995 for details). We used a 300 line/mm grating (blazed at Å) to sample a wavelength range 4000–9000Å, and a 1′′ wide slit which resulted in an effective resolution FWHM of 10Å. The LRIS detector is a Tek 20482 CCD with 24m pixels which corresponds to a pixel scale of 0214 pix-1. The read noise was roughly 8.0 and the gain was /adu.
We obtained three sets of observations with the spectrograph slit oriented along the major axis of the optical continuum emission from the galaxy (PA=140∘). Each set is comprised of observations made in four waveplate positions (, , , ) which sample the electric vector in four position angles on the sky (, , , respectively). The exposure time per waveplate position was 1200 for the first two sets, and 900 for the third set, resulting in a total exposure time of 55 minutes per waveplate position. After each set, we reacquired the galaxy by using an offset from a nearby star. The seeing during our observation was mediocre (1′′ to 13), conditions were non-photometric, and the maximum airmass was 1.55.
Since we observed the galaxy for about 4 hours, the parallactic angle rotated during our observations from PA∘ to 180∘(airmass 1.55 to 1.00). Nevertheless, we estimate that errors in relative spectrophotometry due to any differences between the slit PA and the parallactic angle are small, since the relative broad band photometry synthesised from our spectroscopy agrees well with spectral energy distribution measured from broad band imaging in , and by Peter Eisenhardt and Richard Elston (Eisenhardt, personal communication). The continuum in our spectral bandpass (Å) may be represented by a power law . The colors of the galaxy in a 1036 aperture derived from our spectroscopic observations are , , and . The and filters partly sample wavelength regions not covered by our spectra, and therefore these magnitudes were derived by smoothly extrapolating the observed spectrum to shorter and longer wavelengths. These colours are in fairly good agreement with the Eisenhardt photometry and with the published color measured by Le Fèvre et al. (1988).
In order to calibrate the instrumental polarization, we observed the star G191B2B through UV and IR polaroid filters in four waveplate positions. G191B2B is also a zero polarization standard (Schmidt, Elston, & Lupie 1992) as well as a flux calibration standard (see below) and as an additional check on any residual polarization effects we measured this star in the four waveplate positions. In order to calibrate the polarization position angle zero point we observed the polarization standard stars HD245310 and HD155528 (Schmidt, Elston, & Lupie 1992). The Galactic latitude of 3C256 is 69∘ and the interstellar percentage polarization is estimated to be very low (0.2%; Appenzeller 1968, Mathewson & Ford 1970).
The data were corrected for overscan bias and flat–fielded using internal lamps taken immediately following the observations. The A– and B–band (O2) telluric absorption features were removed by determining a template optical depth curve from the spectrum of a standard star, scaling by the appropriate airmass, and dividing it into the data. The flux calibration was performed using observations of G191B2B (Massey et al. 1988, Massey & Gronwall 1990). The star was observed both with and without an order sorting GG495 filter in order to correct for the second order light contamination in the spectral region Å. All the spectroscopic reductions were performed using the NOAO IRAF package. The spectropolarimetric analysis was carried out using our own software, and is based on the methods described in Miller, Robinson, & Goodrich (1988). The spectral modelling discussed in §4.2 was carried out using the SPECFIT package in IRAF (Kriss 1994).
Radio observations of 3C256 at 4.89 GHz and 14.96 GHz were obtained using the VLA in A-array configuration on U.T. 17 August 1987. The 4.89 GHz map is shown in figure 2.
3 Results
3.1 Morphology of the Continuum and Line Emission
As is seen in figure 1 (and more clearly in the higher spatial resolution imaging observations presented by Le Fèvre et al. 1988), 3C256 is comprised of roughly three regions of optical emission which are well aligned with the radio axis. The optical image shows two clumps of emission in the south (‘a’ and ‘b’ in Le Fèvre et al. 1988) and a fainter, more diffuse component extending to the north west in PA=140∘. The radio source has a double–lobed morphology (fig. 2). The radio lobes are separated by 4′′ and the lobe flux ratio (north:south) is nearly 10:1 (Table 1). No radio core is detected to a flux density limit of 1.0 mJy (5 at 4.89 GHz). Table 1 lists the observed flux densities in the lobes. The total flux measured from the 4.89 GHz map agrees well with the single dish measurements ( mJy; Gregory & Condon 1991, Becker, White & Edwards 1991). The radio lobes have extremely steep spectral indices, but this may be due to some fraction of the radio flux being resolved out of the 15 GHz map.
For comparison with the positions listed in Table 1, the optical position of the galaxy is approximately . Although the relative astrometry between the radio and optical frames is uncertain (), the morphological and angular size differences between the radio and optical images ensure that there cannot be a one-to-one correspondence between both radio lobes and the regions of bright optical emission. However, based on the approximately similar size scales of the optical and radio extents, we speculate that the fainter south eastern radio lobe may coincide with the south eastern-most compact optical continuum emitting region (component ‘b’ in Le Fèvre et al. 1988) and the (much brighter) northern radio lobe is associated with the faint, diffuse, extended north western optical component (labelled ‘Fuzz’ in figure 1; component ‘c’ in Le Fèvre et al. 1988).
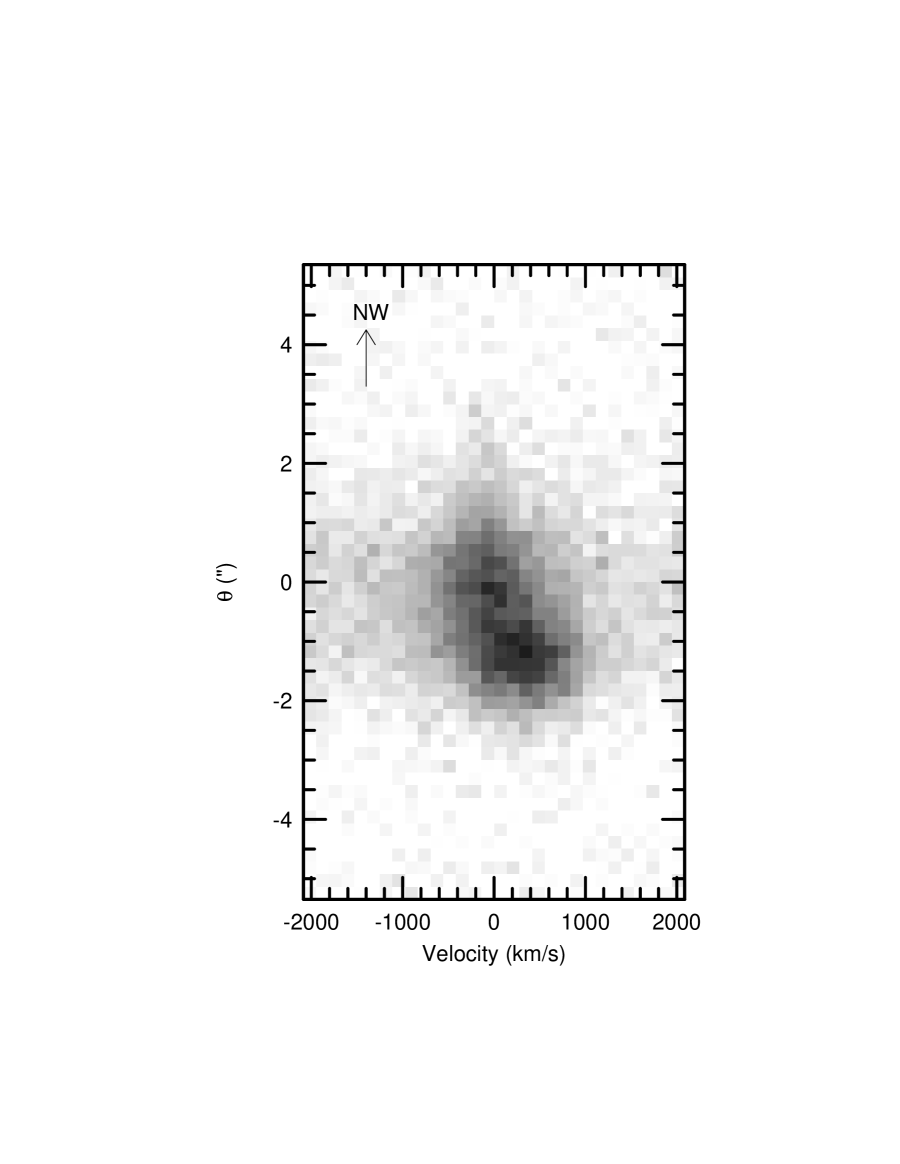
From our longslit spectra we find that the line emission shows a morphology similar to that seen in the Le Fèvre et al. image: there are two clumps of emission in the south east and a more diffuse faint component extending to the north west (figure 3). The brightest region of line emission is associated with the south eastern region, and the faint, diffuse extended region of line emission appears to be associated with the north western region. In this respect, the emission line properties of 3C256 differ from those of most other high redshift radio galaxies, where the brighter radio lobe is usually associated with regions of bright optical emission (McCarthy, van Breugel, & Kapahi 1991).
The velocity structure of the emission line gas consists of three components. The emission lines associated with the south eastern component have broad line widths (FWHM1160) whereas the central and north western regions have relatively narrow line widths (FWHM700 and 200 respectively) and show less velocity structure. Overall, there is a roughly monotonic velocity gradient along the major axis of the galaxy with an end-to-end velocity difference of 400. Note that the emission line region with the broadest line width (the SE region) is associated with the fainter radio lobe. Similar results are found in 3C324 and 3C368 (Dickinson et al. 1995, Dey et al. 1996a), where regions with the broadest line emission (FWHM1000–1500) are associated with the faintest radio components.
3.2 One–Dimensional Imaging Polarimetry
As in most high redshift radio galaxies, there is no clearly identifiable nucleus in either the optical or the radio images of 3C256. Nevertheless, it is important to determine whether the polarization in the galaxy arises from some unresolved region, or whether the polarized flux is spatially extended. To address this question, we extracted cross-cuts of 3C256 by coadding our spectropolarimetric data in the wavelength range Å (1400–2300Å in the rest frame). The wavelength range was chosen to cover a large region of galaxian emission where the signal-to-noise ratio was not adversely affected by sky subtraction or fringing in the CCD. These cross-cuts allow us to determine the one dimensional spatial distribution (along the slit PA=140∘) of the percentage polarization and polarized flux.
The results of our one-dimensional imaging polarimetry are presented in figure 4, and clearly demonstrate that the polarized flux is spatially extended. In the central regions of the galaxy, the percent polarization is 10%, and rises to 23%4% in the low surface brightness ‘fuzz’ in the NW portion. Note that since the narrow emission lines from the galaxy that contaminate this large wavelength range are probably unpolarized (see below), the true percentage polarization of the continuum is slightly higher. In the central regions, the total emission line equivalent width (in the observed frame) is 450Å, and the true polarization is therefore larger by a factor of and is likely to be 12%. In the low surface brightness ‘fuzz’, however, the total emission line equivalent width is only 150Å, and the continuum polarization is insignificantly higher. In all the sampled bins the electric vector is roughly perpendicular to the major axis of the galaxy.
The bottom panel shows a comparison between the spatial variation of the polarized flux (points) and that of the total flux (solid line). The polarized flux has a somewhat flatter spatial distribution than the total flux, primarily because of the excess polarization in the NW ‘fuzz’ region of the galaxy. The excess polarization in this NW ‘fuzz’ may indicate less dilution of the continuum polarization by an unpolarized component outside the main body of the galaxy. The lower polarization in the brighter regions of the galaxy relative to the NW ‘fuzz’ may also be due to geometric effects, resulting from the seeing smoothing over a region where the electric vector position angles are changing significantly thereby diluting the measured fractional polarization. Alternatively, the scattering may not always take place along the same direction relative to our line of sight; e.g., in the case of dust scattering, it is conceiveable that the near side and far side may have different fractional polarizations. However, neither of these possibilities explain the crude anticorrelation between surface brightness and fractional polarization, which is naturally explained by dilution by an extra unpolarized component.
We also computed the percentage polarization in the pure continuum region 5440–6515Å (rest frame 1926–2307Å). In two apertures of widths 21 and 42, both centered on the centroid of the continuum emission, the percentage polarization was measured to be 9.8%0.9% and 10.9%0.9% respectively. If the polarized component were unresolved, the percent polarization in the larger aperture should be 6.5%0.7%, since the total flux in the larger aperture is 1.5 times the flux in the smaller aperture. This measurement is therefore discrepant from the prediction of the point source hypothesis by 4.
3.3 Spectropolarimetry of the Continuum and Line Emission
Rather than estimate the polarization in each resolution element, we chose to first rebin the spectropolarimetric data into continuum and emission line regions in order to optimize the signal-to-noise ratio of the polarimetry. The linear Stokes parameters and the errors were then calculated for each spectral bin according to the formalism described by Miller, Robinson, & Goodrich (1988).
The results for the continuum polarization are listed in Table 2 for three different apertures: one wide extraction (20 pixels or 41) centered on the galaxy, and two smaller extractions (10 pixels or 21) centered on the bright NW and SE continuum emitting regions of the galaxy (see figure 1; regions ‘a’ and ‘b’ respectively of LeFèvre et al. 1988). In addition, we also extracted the spectra of the faint ‘fuzz’ in the NW region of the galaxy (figure 1; region ‘c’ of LeFèvre et al. 1988). For each spectral extraction, we tabulate the percentage polarization , an unbiased estimate of the percentage polarization (; Wardle & Kronberg 1974, Simmons & Stewart 1985), the error in the percent polarization , the polarization position angle (of the electric vector), and the error in the position angle . Bins that contain strong emission lines or are contaminated by telluric absorption are flagged in the last column. Electric vector position angles derived from polarization measurements are highly uncertain, and are so noted by parentheses. We exclude the region around the A-band (7570Å to 7690Å). Figures 5 through 8 show the variation of the percentage polarization (), the polarization position angle (), and the polarized flux () for the four different spectral extractions of 3C256. Since the ‘fuzz’ in the NW region of the galaxy is very faint, we were only able to estimate its polarization in very large spectral bins (figure 8).
Table 3 lists the emission line polarizations for 3C256 measured in the wide (411′′) aperture. The polarization of the narrow emission lines was estimated by first subtracting a 3rd order polynomial fit to the continuum and then calculating the linear Stokes parameters in bins centered on the emission lines. Within the errors, the narrow emission lines are all unpolarized.
The spatially extended continuum emission from 3C256 is polarized at the 11% level. The electric vector of the polarized light is oriented at PA49∘5.6∘, which is roughly orthogonal to both the major axis of the optical emission and the radio axis of the galaxy. Within the observational errors, the percentage polarization and the polarization position angle are both roughly constant with wavelength in all parts of the galaxy. It should be noted, however, that the percentage polarization in the SE component (figure 6) shows marginal evidence for both an increase with wavelength (1.7) and a different polarization position angle compared to the NW component (1.5) which may imply that the scattering population, the diluting radiation and the scattering geometry are different in this region of the galaxy, but higher signal-to-noise ratio data are required to confirm this. The narrow emission lines are unpolarized and dilute the underlying continuum polarization. In all the extractions, there is very marginal evidence for increased polarization in the continuum band situated in the red wing of the MgII emission line.
4 Discussion
4.1 Scattered Nuclear Light from 3C256
The relatively high percentage polarization of the continuum emission and the orientation of the polarization position angle imply that a significant fraction of the observed extended continuum emission is scattered light from a hidden nuclear source. The exact nature of the nuclear source is unknown at this juncture, but we speculate that it is most likely to be the AGN powering the radio source. Since the percentage polarization is roughly constant with wavelength in all parts of the galaxy (with the possible exception of the SE region; see figure 6), the spectrum of polarized flux therefore has the same spectrum as the total flux spectrum from the galaxy. Under the assumption that the total flux spectrum is a power law , then both and have optical spectral indices of , which is fairly typical of quasar spectra in this wavelength region.
Although the continuum emission may be dominated by scattered AGN light, the narrow emission lines are not polarized and therefore probably dominated by in situ emission. The total light spectrum shows that the MgII2800 emission line is slightly broader in the SE part of the galaxy, but this is probably due to the kinematics of the narrow line emitting gas. Higher signal-to-noise ratio data are required to accurately determine the spectrum of the scattered light in this region.
The hypothesis that the radio galaxy 3C256 contains a buried quasar is convenient from the perspective of AGN unification ideas, which predict that FRII radio galaxies and steep spectrum radio loud quasars are intrinsically similar objects, their observed differences being primarily due to the effects of orientation and dust obscuration (see Antonucci 1993 for a review). If the nuclear source in 3C256 is indeed a quasar, the scattered light spectrum should show the broad emission lines of CIV, CIII] and MgII that typify quasar spectra (e.g., Antonucci & Miller 1985, Miller & Goodrich 1990). We attempted to fit the MgII2800 and CIII]1909 features in the total light spectrum with a narrow gaussian component and a broad gaussian component centered at the same wavelength. Within the range of FWHM normally observed in quasars (; Brotherton et al. 1994), we derive an upper limit to the equivalent widths of the broad components of Å. Observed equivalent widths of the broad MgII feature in quasars range from 15Å to 60Å (e.g., Steidel and Sargent 1991), and therefore this limit does not rule out the ‘hidden quasar’ hypothesis. A similar limit is more difficult to obtain for the CIV line since it is lies close to an absorption feature in the spectrum (§4.2). Unfortunately, the signal to noise ratio of the present data is inadequate to determine any useful limits to the presence of broad lines in the polarized flux spectrum.
4.1.1 What is the Scattered Fraction?
Before we discuss the scattering mechanism responsible for the polarization in 3C256, it is important to determine the fraction of scattered light in the observed spectrum. Since the percentage polarization is 11% across the main body of the galaxy (e.g., figure 4), we could naively assume that the scattered light is completely polarized, and that 89% of the observed light is in situ diluting (unpolarized) emission from the galaxy. However, this scenario is extremely unlikely given the spectrum of the unpolarized continuum emission: since the percentage polarization is wavelength independent, the unpolarized flux would have the same spectrum as the total light. The remarkable similarity between the rest frame continuum spectra of 3C256 and NGC1068 (figure 9) suggests that the rise in the continuum emission longward of Å relative to a smooth extrapolation from shorter wavelengths may be primarily due to the presence of blended FeII emission lines (e.g., Antonucci, Hurt, & Miller 1994). Since broad FeII emission over such a large volume would be completely unprecedented, it is far more likely that a significant fraction of the continuum emission is scattered nuclear light.
A crude estimate of the true percentage polarization of the scattered light (and the relative importance of the diluting continuum) is provided by our one-dimensional imaging polarimetry. If we assume that the true percentage polarization of the scattered light is roughly constant across the face of the galaxy, then the rise in the percent polarization in the region of the NW ‘fuzz’ can be interpreted as a decrease in the diluting flux in this region. As discussed above, in the wavelength range 1416–2300Å the percent polarization in the extended NW ‘fuzz’ region is 23.0%3.7% whereas it is only 9.6%0.9% in the central region. If we assume that the intrinsic polarization of the scattered light is constant over the entire galaxy, then since the intrinsic percentage polarization must be at least equal to that observed in the NW ‘fuzz’. Since the observed polarization is given by where is the scattered flux and is the unpolarized diluting continuum emission, the fraction of diluting flux in the central regions is . Moreover, since the total flux in the ‘fuzz’ is 1/6 that in the center, the scattered flux in the ‘fuzz’ must be only 0.4 that in the central region. Similar continuum components that dilute the continuum polarization have also been detected in nearby Seyfert galaxies (e.g., Antonucci & Miller 1985, Miller & Goodrich 1990, Tran 1994).
The estimate that the diluting radiation contributes at least 58% of the total light in the central regions is perhaps somewhat surprising. As mentioned above, this implies that the continuum spectrum of the unpolarised radiation must be similar to that of the total spectrum, and then its resemblance to the nuclear spectrum of NGC1068 is puzzling. Of course, our simple minded assumption that the intrinsic polarization is constant throughout the galaxy may be false: might be larger in the ‘fuzz’ if the scattering mechanism is different, or enhanced due to an increased population of scatterers. It is also important to note that the polarization in the brighter central regions of the galaxy may be diluted by various geometric and sampling effects, as discussed in §3.2. High spatial resolution imaging polarimetry is required in order to properly address this question.
4.1.2 What is the Scattering Mechanism?
Is it possible to determine from these data whether the scatterers are primarily electrons or dust? Electron scattering is wavelength independent over the entire spectral regime. Dust generally produces wavelength dependent scattering at optical rest frame wavelengths, but in the UV the spectrum produced by dust scattering depends upon the albedo of the dust grains, which in turn depends upon the physical properties of the grains (composition, size distribution). For example, the dust cloud in PKS 215269 is optically thin at optical wavelengths and causes Rayleigh scattering of the optical AGN light, but the scattered flux spectrum flattens at UV wavelengths (di Serego Alighieri et al. 1988, Fosbury et al. 1990). In fact, at UV wavelengths optically thick dust scattering can mimic the wavelength independence of electron scattering for wavelengths longward of about 2500Å (Kartje 1995; Laor, pers. comm.).
In this section, we use mass estimates for the scatterers to try to distinguish between electrons and dust as the dominant scattering population. We first discuss a simple model for electron scattering, then consider whether hot ( K) or warm ( K) gas is responsible for scattering the light, and finally briefly discuss the possibility of dust particles as the scattering population.
One intriguing piece of evidence is provided by the total light spectrum of 3C256. Figure 9 shows a comparison of the rest frame UV spectra of 3C256 and NGC 1068 (from Antonucci, Hurt and Miller 1994). It is important to note that the spectrum of NGC1068 was obtained in a 500 pc 160 pc aperture centered on the nucleus, whereas the spectrum of 3C256 is extracted in an aperture kpc in size. In NGC1068, the percentage polarization in the nucleus is wavelength independent for at least (after correction for dilution by starlight; Miller & Antonucci 1983, Antonucci et al. 1994) and is therefore believed to be indicative of electron scattering. Although the similarity between the spectra displayed in Fig. 9 may suggest, by analogy, that electrons are also responsible for scattering and polarizing the light in 3C256, the inefficiency of electron scattering argues against this mechanism as the origin of the scattered light due to the implied large mass of ionized gas.
A Simple Biconical Electron Scattering Model for 3C256
Let us consider the null hypothesis that all the observed optical/UV flux from 3C256 is due to electron scattering of nuclear light. Let us further assume that the nuclear source in 3C256 radiates into two cones of half opening angle , but is hidden from direct view (i.e., , where is the angle between the line of sight and the cone axis), and that the cones are filled with ionized gas of uniform electron density . For the axisymmetric geometry, uniform density and optically thin case considered here, the two angles and are related via the intrinsic percentage polarization (Brown & McLean 1977; also see equation 3 of Miller, Goodrich & Matthews 1991). In particular, if the intrinsic polarization is greater than 23% (i.e., at least as large as the observed polarization of the NW ‘fuzz’), then is always less than . This model is similar to that presented for NGC 1068 by Miller, Goodrich and Mathews (1991), and we refer the reader to that paper for details regarding these arguments.
In the case of 3C256, the opening angle for the scattering cone is probably not large: the optical continuum and line emission of the galaxy are confined to a fairly narrow, elongated structure (figure 1 and LeFèvre et al. 1988). If the gas distribution is assumed to be spherically symmetric but only illuminated/ionized within the cone, the optical image can be used to constrain the opening angle to the range . This is slightly less than the value of argued by Barthel (1989) to be the typical cone opening angle, and is within the range of cone angles observed for ionization cones in low redshift Seyfert galaxies (Wilson & Tsvetanov 1994). We therefore adopt this range () as representative for the discussion that follows.
The ratio of the scattered luminosity to the incident luminosity is
where is the scattering phase function for electron scattering, is the Thomson cross section, and the integrals are performed over the path length and solid angle occupied by the scattering region. For the conical model adopted here
where is the length of each cone in units of 20 kpc, and
where and (Miller, Goodrich, & Matthews 1991, Brown & McLean 1977). Since the optical depth , as long as and , the optical depth is and the scattering can be considered to be optically thin.
Hence, if we know we can derive the electron density required to produce the observed scattered flux. The total mass in the ionized component of the ISM (responsible for the electron scattering) within the cone is then
The derived mass is fairly insensitive to the exact value of the cone opening angle.
What is the value of ? The radio loud quasars in the redshift range from the Steidel and Sargent (1991) sample have rest frame 2200Å luminosities in the range . The total luminosity at 2200Å of 3C256 is
so if
then, for ,
and
Note that this is only the mass of the ionized gas responsible for the scattering (i.e., within the cone); if we assume that the gas is in a spherical distribution, the mass estimates for the ionized component would be larger by , or roughly one order of magnitude.
The density and mass estimates above are derived based on the assumption that all the light observed from 3C256 is due to electron scattering. This assumption is at odds with the discussion in the previous section, where, based on the assumption that the intrinsic polarization is constant across the galaxy, the scattered light in the central regions of the galaxy was suggested to comprise less than 42% of the total light. Including a significant contribution from an unpolarized, diluting continuum alters the above arguments in two ways. Since the intrinsic polarization is higher than the measured polarization, the scattering angle is larger, and the cone angle is constrained to a smaller range. This reduces the lower limit on the electron density, but does not affect the mass estimate. The more important effect is that the estimate of , and therefore decreases by a factor of ().
Under the null hypothesis, the lower limit on the mass of the ionized gas in the cone is comparable to the total mass of our Galaxy. This does not necessarily rule out electron scattering, however, but implies that the ionized component alone has a mass comparable to that of the baryonic mass of a giant elliptical galaxy. If we restrict the total mass of the 3C256 to be less than that of a present day cD galaxy (), this raises the question as to why most of the mass is confined to the region within the ionization cone (or the boundaries defined by the radio source).
K Electrons as the Scattering Population
A possible explanation for such a large mass in ionized gas is to invoke the suggestion of Fabian (1989) that radio galaxies may be surrounded by large halo of hot ( K) gas, similar to that observed to surround most central cluster galaxies. The average gas density within 20 kpc of 2.2 – 8.3 required by the scattering hypothesis is larger than that observed in most clusters, but is similar to the density in the model adopted by Fabian (1989). If the hot electrons are confined (for some unknown reason) to a spherical region within 20 kpc of the nucleus, the X-ray flux in the observed energy range 0.1–2.4 keV is
where is the emissivity of thermal bremsstrahlung. Assuming that the density is constant over this region implies that
or, in the Rösat PSPC detector (assuming ; Crawford & Fabian 1995), this corresponds to
Hence the emission from even the very central 20 kpc is nearly 200 times greater than the upper limit to the soft X-ray flux from 3C256 of quoted by Crawford & Fabian (1995). If we further assume that the hot gas has a distribution similar to that observed in most clusters (, Mpc), the predicted flux and count rate exceed the upper limit by a factor of ! In addition to this problem, the cooling time of the gas would be very short (yr), and the mass deposition rate would be extremely high.
The only possibility of retaining hot electrons as a feasible scattering population in the case of this high redshift radio galaxy is to contrive that the electrons are completely restricted to the region within the cone, with negligible emission measure outside the radio source boundary, and to have the central source be among the intrinsically most luminous quasars in the universe. If we reverse the above argument and use the Rösat PSPC upper limit to predict the number density of the hot electrons, we find that scattering by this hot population does not contribute significantly to the observed polarized flux. Broad MgII2800Å line emission with widths similar to that seen in quasars is observed in the polarized flux spectra of the radio galaxies 3C226 and 3C277.2 (di Serego Alighieri et al. 1994) and the radio galaxy 3C324 (Cimatti et al. 1996), and in the total light spectrum of the radio galaxy 3C265 (Dey & Spinrad 1996) and rule out hot electrons as the scattering population for these galaxies as well.
K Electrons as the Scattering Population
Although we can convincingly rule out hot electrons as the dominant scatterers, it is more difficult to rule out scattering by a large population of cooler ( K) electrons. In fact, if we assume that the cones are filled with K, gas, then the Ly luminosity produced due to recombination would be (Osterbrock 1989). This is not very different from the observed Ly luminosity of measured by Spinrad et al. (1985), and implies that the same gas responsible for the line emission could also be responsible for scattering the nuclear emission.
The main limitation to the present discussion of whether electrons can be responsible for scattering the light is the lack of a reliable, independent density estimate. At present, we can only very crudely constrain the electron density in a one–zone model to lie in the range , where the upper limit is the critical density for the collisional deexcitation of the [NeIV]2424 emission line (Spinrad et al. 1985), and the lower limit is based on the electron scattering arguments outlined above. Modelling of the emission line spectrum should provide better constraints to the density, temperature and filling factor of the gas, and we will investigate this possibility in more detail in a future paper.
If the observed light is scattered primarily by electrons, the dust–to–gas ratio in the scattering cones must be very small. Dust particles are much more efficient than electrons at scattering light: for grains of radius 0.1m and mass density 3 embedded in a pure hydrogen nebula, the relative efficiency of dust scattering to electron scattering is
where 0.006 is the Galactic dust–to–gas ratio, and we have assumed that the scattering cross section of a dust grain is identical to its geometrical cross section, and the ratio of the scattering phase functions of dust and electrons is of order unity. Therefore, if the scattering is dominated by electrons, the dust–to–gas ratio in the scattering cones must be less than that in our galaxy, implying a dust mass (in the cones) of less than . The low dust–to–gas ratio and dust mass may imply that the radiation within the cone is responsible for destroying the dust grains, or that the thermal history of the gas has prevented significant grain formation.
Dust as the Scattering Population
Although dust particles are much more efficient than electrons at scattering light, their polarization efficiency can be lower than that of electrons. In addition multiple scattering and variations in the grain properties can result in a high scattered fraction with relatively low percentage polarization in the UV as is often observed in Galactic reflection nebulae. Moreover, model calculations by Laor (1995) suggest that the increased scattered flux observed in 3C256 for Å (Å) which we interpreted as resulting from FeII emission in the preceding discussion, can also be produced by dust scattering (Laor, pers. comm.). If we attribute all the observed continuum emission to dust scattering off grains with typical radius of 0.1m and mass density 3, the required mass of dust within the cones is
where we have assumed that the scattering angle is , and the Henyey–Greenstein (1941) scattering asymmetry parameter is (e.g., Savage & Mathis 1979 and references therein). This estimate for the dust mass, like the mass estimate for the ionized gas resulting from the electron scattering assumption, is nearly 10 times larger than the mass of dust in the disk of our Galaxy.
This crude mass estimate by itself does not rule out dust scattering as the mechanism, since we know little about the large scale dust and gas properties of these high redshift galaxies. However, the large amount of dust predicted by this simple picture, if distributed fairly uniformly, would result in significant extinction which should be apparent in the flux ratios of the narrow emission lines. If the dust is uniformly distributed within the cone, the optical depth through the cone perpendicular to the cone axis at a distance of 10 kpc from the center is , which corresponds to . However, the reddening must be low, since the HeII2733/HeII1640 ratio is observed to be 0.039, which is close to the Case B recombination value of 0.032 ( K, Hummer & Storey 1987).
This argument against dust scattering is only suggestive, since the dust may be distributed differently from the line emitting gas. It is entirely plausible that the dusty, scattering medium is clumped with high density and low filling factor, and that the line emission arises from a more diffuse, high filling factor inter–clump medium and is therefore not strongly affected by dust extinction or reddening. Moreover, at large dust optical depths, the scattering efficiency can compensate for the reddening, resulting in low measured extinction (Laor, pers. comm.). In addition, some preliminary modelling of the broad band rest frame UV to optical spectral energy distribution of 3C256 kindly provided to us by Dr. S. di Serego Alighieri suggests that a more sophisticated three component model of a dust scattered quasar, single age old stellar population, and nebular continuum is also able to fit the observed spectrum fairly well. However, the critical tests of whether dust scattering is the primary mechanism responsible for the observed properties of the galaxy would be near-infrared polarimetry (the dust scattering model predicts much lower fractional polarization in the near-IR) and near-infrared spectroscopy (to search for the spectral signatures of an old population).
Another (albeit more speculative) argument against dust as the dominant scattering mechanism in 3C256 follows from the discussion in §4.3 where we argue that 3C256 has not yet formed the bulk of its stars. If dust forms only in cool stellar envelopes, it is unlikely that dust production on a large scale in this young galaxy is efficient enough to produce the large mass of dust required for scattering. Dust formation in the ejecta of supernovae, however, may be more efficient in dispersing dust over a large volume.
The primary argument for electrons and against optically thin dust as the dominant scattering population is the lack of any wavelength dependence to the observed fractional polarization. This is exactly what one would expect for electron scattering, whereas dust scattering should imprint some wavelength dependent signature on the scattered light. For example, dust in Galactic reflection nebulae generally produces a scattered light (and probably polarized flux) spectrum that is bluer than the incident spectrum by (e.g., Calzetti et al. 1995). A particularly extreme example is that of the scattering cloud in PKS 215269, which bluens the incident spectrum by (di Serego Alighieri et al. 1988, Fosbury et al. 1990). In addition, recent scattering models of the UV continuum light in AGN (Kartje 1995) have shown that although optically thick dust scattering can produce wavelength independent fractional polarization for wavelengths Å, it also usually produces a sharp rise in the fractional polarization toward shorter wavelengths (Å). This is not observed in 3C256, where is observed to be wavelength independent down to at least 1500Å. Higher signal-to-noise ratio spectropolarimetry of 3C256 in the optical (rest frame UV) and near-infrared (rest frame optical) directed at identifying features in the polarized flux (such as the 2200Å bump) will eventually provide a definitive test between dust and electron scattering.
4.2 An Absorption Feature in the Total Light Spectrum
An intriguing characteristic of the total light spectrum is the presence of a strong, broad absorption feature centered at Å (Å; figure 10). If the line has the same redshift as the narrow line emission from 3C256, the rest wavelength is Å. This absorption feature is present in the coadded spectra of both the upper and lower rays of the spectropolarimeter, and is located in a spectral region which is not unduly affected by telluric lines or features in the flat field. The feature is seen in the raw extracted spectra of both the upper and lower rays, and can be seen in the two-dimensional spectrum. In addition, no absorption feature at the same observed wavelength is seen in the spectra of other objects obtained on the same night, and it is therefore unlikely that the absorption line is an instrumental artifact. In addition, the feature is not produced in the flux calibration process: the flux calibration sensitivity curves are smooth across this feature. An absorption line at roughly the same wavelength (Å) was also very marginally detected by Chambers and McCarthy (1990) in their composite radio galaxy spectrum which was constructed by adding spectra of 3C256 and 3C239.
The weak emission line near the center of the broad absorption trough (figure 10) is most probably NIV]1486. After correcting for the NIV] line emission, the broad absorption has an equivalent width in the observers’ frame of 355Å, and a FWHM6450100. If the line has the same redshift as the narrow line emission from 3C256, the rest equivalent width is Å. Since at least 10–40% of the continuum light is scattered AGN continuum emission, the intrinsic equivalent width of this feature is even higher (Å) if this feature arises in the in situ component alone.
What is the origin of this absorption? The possible interpretations of the absorption feature fall into three general categories according to whether it is present in the diluting component, the scattered component, or is imposed on the total spectrum by an external absorbing medium. These three situations may be distinguished by the behaviour of the percentage polarization across the absorption feature: in the first case, should rise in the trough; in the second, should decrease in the trough; and in the third, it should remain constant across the feature. Unfortunately, the data presented in this paper are inadequate to conclusively distinguish between these possibilities, but we consider the various options in more detail below in anticipation of better data.
Stellar Absorption?
If the absorption is a property of the unpolarized, diluting component, then the most likely (and certainly most intriguing) possibility is that it is a stellar photospheric line. Absorption features in the spectra of high redshift radio galaxies were first tentatively identified by Chambers & McCarthy (1990), who detected (at the level) features at 1300Å, 1480Å, and 1840Å, and weaker features at 1400Å, 1640Å, and 1720Å. Our spectrum of 3C256 covers the rest wavelength region 1410–3190Å, but the only convincing absorption line that we detect is the 1477Å line described above. A marginal line may be also present at 1712Å, but better signal-to-noise ratio spectra are required to confirm this. We see no evidence of the 1840Å line. Chambers & McCarthy interpret the absorption features that they detect (albeit marginally) in composite radio galaxy spectra as evidence that the galaxian continuum of high redshift radio galaxies is dominated by starlight from a young stellar population. However, the line that we measure, although roughly coincident with the feature identified by Chambers and McCarthy, has an extremely large equivalent width and FWHM compared to most stellar absorption features. The strongest stellar absorption lines in O and B stars in this spectral region are the SiIV1394,1403 and CIV1548,1551 resonance doublets, which generally have maximum equivalent widths in the spectra of individual stars of 12Å (Panek & Savage 1976, Sekiguchi & Anderson 1987). The identification of the 1477 absorption line with stellar CIV absorption would imply that the starlight is separated in velocity from the line emitting gas by 14300, which appears unrealistic.
The only known stellar absorption lines that are close in wavelength to our mystery line at 1477Å are weak blends at 1478Å (possible contributing ions are SrII, SI, SiII, NiII, TiIII, and NI), 1465Å (several blended FeV and FeIV lines), 1457Å (possible contributing ions are NiII, TiIII, TiIV and SI) and FeV1453 (Underhill, Leckrone, & West 1972; Kinney et al. 1993; Fanelli et al. 1992, 1987; Dean & Bruhweiler 1985). All of these features are weak, and in integrated spectra they rarely have equivalent widths greater than Å (Fanelli et al. 1992, Leitherer, Robert, & Heckman 1995). In summary, the large equivalent width of the line, the absence of any known strong stellar feature at Å, and the lack of other strong stellar absorption features in the spectrum imply that the absorption feature is probably not due to a young population.
The large FWHM of the line might suggest that the feature may arise from a wind. Broad absorptions in the P-Cygni profiles of CIV and SiIV lines in some O stars have FWZI as large as 3500(e.g., Cassinelli 1979 and references therein). However, the interpretation of the 1477Å line in 3C256 as CIV absorption due to outflowing material results in huge outflow velocities (14300 in the line center!). The possibility that the absorption is a P-Cygni profile associated with the semi–forbidden NIV]1486 line can also be ruled out since this requires huge column densities and would therefore predict very strong P-Cygni profiles associated with the HeII and CIV lines.
Interstellar or Intervening Absorption?
There are several FeIV and FeV transitions in this spectral region that have been measured against O star spectra (e.g., Dean and Bruhweiler 1985). It is conceivable that these transitions could contribute to the absorption, but it is improbable that they would result in absorption in excess of 12Å in equivalent width, and covering such a large wavelength range.
One other possibility is that the absorption is due to a foreground, intervening system, say CIV1549 at z=1.692. Although there is no associated MgII2800 absorption at the same redshift, this in itself is not too unusual since only 26% of CIV absorbers show associated MgII absorption (Steidel & Sargent 1992). The more critical problem with this expanation, however, is that equivalent width and velocity width of the absorption would be unprecedented: most CIV absorption line systems observed along the lines of sight to quasars have rest equivalent widths 3Å and velocity widths 250–300 (e.g., Steidel & Sargent 1992). The only possibility that this is an intervening absorption system is if the absorption arises in a forground supercluster similar to that seen along the line of sight to the quasar pair Tol 10372703/10382712 (Jakobsen et al. 1986, Jakobsen & Perryman 1992). In this case the broad line would be comprised of several overlapping narrow absorptions. Even in this scenario, the properties of the foreground systems would be somewhat extreme: the velocity width of the foreground supercluster would be nearly 20,000 with none of the absorbers showing associated MgII2800 absorption.
BAL Absorption?
The most plausible interpretation of the absorption feature is that it is broad CIV absorption similar to that observed in BAL QSOs. Unlike in the preceding discussion where we implicitly assumed that the absorption arises either in the diluting component or external to the galaxy, in this scenario the absorption would occur in a cloud near the nucleus of the AGN and would therefore be a feature present in the scattered light spectrum. The large velocity width (FWHM6450) and even the large relative velocity () are similar to those seen in BAL QSOs (Korista et al. 1993, Turnshek 1988 and references therein). For example, the QSO 01354001 shows a strong BAL system with a FWHM1900 and a velocity difference of 12900 (Weymann et al. 1981). In addition, Turnshek (1988) finds that FeII emission may be enhanced and broad CIV may be weaker in BAL QSOs compared with non–BAL QSOs. These correlations may explain the absence (or weakness) of broad CIV and the presence of moderately strong FeII emission in the polarized flux spectrum of 3C256. This explanation for the absorption feature is testable: if the absorption is BAL–like CIV, there should also be absorption due to SiIV at 3760Å, NV at 3388Å, and possibly Lyman at 3273Å.
The one main difficulty with the BAL interpretation for the hidden nucleus of 3C256 is that the BAL phenomenon is known to strongly anti–correlate with radio power: all known BAL QSOs are radio quiet (Stocke et al. 1984, Turnshek 1988). Steep spectrum radio loud quasars sometimes do show strong absorption features of resonance lines, but these usually occur at the same systemic velocity as the emission lines (e.g., Foltz et al. 1988). Nevertheless, from a physical standpoint, there is no strong reason why BAL clouds should not exist in radio galaxies, and there is at least one other known case of strong BAL–like absorption associated with a high redshift radio galaxy (Dey et al. 1996b).
4.3 The Stellar Fraction in 3C256
In this speculative subsection we briefly comment on the possible stellar content of 3C256. As already noted in the preceding section, there is no evidence for any stellar absorption lines in the UV spectrum of 3C256. In addition, there is no evidence of the 2600Å and 2900Å breaks that are normally observed in the spectra of cool stars and old composite populations. If we follow the definitions of Fanelli et al. (1992,1990) for these spectral breaks (i.e., and ), then we find that and . These values are representative of very early type (O and B) stars, and therefore imply that either the stellar population is dominated by hot, young stars, or the fractional contribution of starlight to the rest frame UV spectrum is very small.
An important implication of the large contribution of scattered AGN light to the spectrum of 3C256 is that the continuum magnitudes and colors must be corrected for the AGN light before any conclusions can be drawn about the underlying stellar population in the galaxy. At present, the exact fractional contribution of scattered light to the spectrum is unknown, although in § 4.1.1 we crudely estimated the fraction to be 0.1–0.42. The percentage polarization is observed to be wavelength independent; if this is due to electron scattering, then the scattered light is likely to have the same spectral shape as the total light spectrum. Therefore, approximating the observed optical scattered light spectrum by a powerlaw and (under the assumption of electron scattering) extrapolating it into the infrared, we find that the flux due to the scattered AGN component must be Jy at . The observed flux is Jy (; Eisenhardt & Dickinson 1992), and therefore the true –band (Å) magnitude of the underlying stellar population is 19.1 to 19.8. In comparison, an unevolved (M) elliptical at would have ; a typical brightest cluster elliptical like NGC1275 (M; Oemler 1976) would be at least 2.4 magnitudes brighter.
Therefore, although 3C256 is brighter than an galaxy at the same redshift, it is significantly (nearly 1.5 magnitudes) fainter than the mean radio galaxy sequence assuming that the light is scattered by electrons. (It is important to note, however, that most dust scattering models predict that the contribution of scattered light in the –band is very small. In this case, the galaxy would still be fainter than the mean relation, but the problem is not as severe.)
It is unlikely that 3C256 is an intrinsically low mass galaxy: the mass estimates derived from the scattered light are comparable to the masses of present day giant elliptical and cD galaxies. If the main sequence of the relation defines the locus of evolution of a massive elliptical and the small scatter observed in the relation for powerful radio galaxies is indicative that these galaxies have similar stellar masses, population compositions and histories (Lilly 1989, McCarthy 1993), then the position of 3C256 in the diagram implies either that 3C256 is much less massive than other powerful radio galaxies at similar redshifts, or that it has not yet formed the bulk of its stars. The latter interpretation may also be consistent with the large baryonic masses required in the interstellar component to explain the observed scattered luminosity of the galaxy. We speculate that if the light in 3C256 is scattered by electrons, then 3C256 may indeed be a very young galaxy, not because its luminosity is dominated by a young starburst, but instead because most of its mass has not yet been converted into stars.
5 Conclusions
We have observed polarized spatially extended optical continuum emission from the high redshift (z=1.824) radio galaxy 3C256. The percentage polarization is roughly independent of wavelength, and the position angle of the electric vector is perpendicular to the major axis of the UV emission, and to the axis defined by the lobes of the radio source. In addition, the narrow emission lines appear to be unpolarized and dilute the continuum polarization. There is marginal evidence that the CII]2326 and the red wing of the MgII2800 emission lines are slightly polarized, which may imply some contribution to the lines from a scattered component. These results support the hypothesis that the radio galaxy contains a buried quasar that is directed in the plane of the sky and hidden from our direct view.
We have attempted to determine whether the scattering is dominated by electrons or by dust. Since electrons are inefficient scatterers, attributing all of the observed emission to electron scattering results in a large mass estimate for the ionized component of the interstellar medium responsible for the scattering. A hot ( K) medium as suggested by Fabian (1989) can be ruled out based on the observed upper limit on the soft X-ray flux from 3C256. However, at the present juncture, we cannot rule out scattering by a cooler population of electrons; in fact, the electrons required to produce the observed Ly luminosity are sufficient to scatter the light if the density is low. If electrons are indeed the scatterers, the dust–to–gas ratio in the scattering region must be much smaller than (at least times less than) the Galactic value. If dust scattering is invoked as the sole explanation of the scattered light, the dust mass required within the cones is large and, if distributed evenly, implies that the extinction through the cone would be large and should be reflected in the ratios of the emission lines. Since the emission lines do not appear to be highly reddened, the dust scattering hypothesis requires that the dust and gas is distributed differently: the dust scatterers are clumped, whereas the line emitting gas is distributed more evenly in the galaxy. Hence although dust scattering is a more efficient process, it may not be any more attractive from an energetic standpoint than scattering by a population of cool electrons. In summary, we cannot state conclusively whether the dominant scattering population is dust or electrons: both are individually difficult to reconcile with the observations, at least using a simple filled–cone geometry. It is very likely, however, that the situations that we have considered here are overly simplistic, and that in reality both dust and electrons in a multi-phase medium are jointly responsible for the scattered light.
We also detect a strong, broad absorption feature located at Å. The line cannot be a stellar absorption feature unless the starlight is separated by 14300 in velocity from the line emitting gas and the stellar spectrum only consists of strong CIV absorption. If the absorption line is present in the scattered flux (and higher signal–to–noise ratio data are required to check this), then it may arise in the broad line region near the AGN nucleus. At present, the identification of this absorption is not certain, but the most likely explanation is that it is a CIV broad absorption line system similar to those seen in BAL QSOs.
Finally, we find no direct evidence for starlight in the observed spectrum of 3C256. In fact, if a significant fraction of the observed continuum emission is scattered AGN light, then the stellar component is quite underluminous compared to that observed in other powerful radio galaxies at similar redshifts. Since the mass estimates derived from the scattering arguments imply that 3C256 is a massive galaxy, we speculate that it is very young and has not yet formed the bulk of its stars.
We thank Tom Bida and Joel Aycock for invaluable help during our Keck LRIS run. We are very grateful to Ken Chambers, Sperello di Serego Alighieri, Peter Eisenhardt, Bob Fosbury, James Graham, Todd Hurt, Buell Jannuzi, John Kartje, Ari Laor, Joan Najita, and Dave Turnshek for useful discussions. We thank George Djorgovski for permitting us to use his images of 3C256 in this paper, and Joan Najita for a careful reading of the manuscript. We are very grateful to the referee, Dr. di Serego Alighieri, for constructive comments on the manuscript, and for calculating dust models to the observed spectrum. We would also like to thank Joe Miller and Marshall Cohen for their encouragement and support of this project. A. D. is grateful to Paul Ho for his hospitality at the CfA during the preparation of the manuscript. R. J. A. gratefully acknowledges NSF grant # AST-9321441. H. S. gratefully acknowledges NSF grant # AST-9225133. The W. M. Keck Observatory is a scientific partnership between the University of California and the California Institute of Technology, made possible by the generous gift of the W. M. Keck Foundation. This work was performed at IGPP/LLNL under the auspices of the U. S. Dept. of Energy under contract # W-7405-ENG-48.
References
Antonucci, R. 1993, ARA&A, 31, 473.
Antonucci, R., Hurt, T. & Miller, J. 1994, ApJ, 430, 210.
Antonucci, R. J. & Miller, J. S. 1985, ApJ, 297, 621.
Appenzeller, I. 1968, ApJ, 151, 907.
Barthel, P. D. 1989, ApJ, 336, 606.
Becker, R. H., White, R. L. & Edwards, A. L. 1991, 75, 1.
Brotherton, M. S., Wills, B. J., Steidel, C. C., & Sargent, W. L. W. 1994, ApJ, 423, 131.
Brown, J. C. & McLean, I. S. 1977, A&A, 57 141.
Bruzual A., G. 1986, in Nearly Normal Galaxies, Proc. of the Eighth Santa Cruz Summer Workshop, ed. S. M. Faber, (Springer-Verlag: New York) p. 265.
Calzetti, D., Bohlin, R. C., Gordon, K. D., Witt, A. N. & Bianchi, L. 1995, ApJ, 446, L97.
Cassinelli, J. P. 1979, ARA&A, 17, 275.
Chambers, K. C. & McCarthy, P. J. 1990, ApJ, 354, L9
Chambers, K. C., Miley, G. K. & Joyce, R. R. 1988, ApJ, 329, L75.
Chambers, K.C., Miley, G.K. & van Breugel, W. 1987, Nature, 329, 604.
Cimatti, A., Alighieri, S. D., Fosbury, R. A. E., Salvati, M. & Taylor, D. 1993, MNRAS, 264, 421.
Cimatti, A., Dey, A., van Breugel, W., Antonucci, R. & Spinrad, H. 1995, submitted to ApJ.
Crawford, C. S. & Fabian, A. C. 1995, MNRAS, 273, 827.
Daly, R. A. 1992, ApJ, 386, L9.
Dean, C. A. & Bruhweiler, F. C. 1985, ApJS, 57, 133.
Dey, A. & Spinrad, H. 1996, ApJ, in press.
Dey, A., van Breugel, W., Antonucci, R. & Spinrad, H. 1996a, in preparation.
Dey, A., van Breugel, W., Spinrad, H., Röttgering, H., Hurt, T., & Antonucci, R. 1996b, in preparation.
De Young, D. S. 1981, Nature, 293, 43.
De Young, D. S. 1989, ApJ, 342, L59
Dickinson, M., Dey, A. & Spinrad, H. 1995, in proceedings of Ringberg Conf. on “Galaxies in the Young Universe”, H. Hippelein, ed., in press.
di Serego Alighieri, S., Binette, L., Courvoisier, T. J.–L., Fosbury, R. A. E., & Tadhunter, C. N. 1988, Nature, 334, 591.
di Serego Alighieri, S., Cimatti, A., & Fosbury, R. A. E. 1993, ApJ, 404, 584.
di Serego Alighieri, S., Cimatti, A., & Fosbury, R. A. E. 1994, ApJ, 431, 123.
di Serego Alighieri, S., Fosbury, R. A. E., Quinn, P. J. & Tadhunter, C. N. 1989, Nature, 341, 307.
Djorgovski, S., Spinrad, H. & Marr, J. 1985, in New Aspects of Galaxy Photometry, ed. J.L. Nieto (Springer Verlag: New York), p.193
Dunlop, J. S. & Peacock, J. A. 1993, MNRAS, 263, 936.
Eales, S. A. et al. 1993, ApJ, 409, 578.
Eisenhardt, P. & Dickinson, M. 1992, in The Evolution of Galaxies and Their Environment, Proc. of the Third Teton Summer School on Astrophys., NASA CP–3190, p.29.
Fabian, A. C. 1989, MNRAS, 238, 41P.
Fanelli, M. N., O’Connell, R. W., Burstein, D. & Wu, C.-C. 1992, ApJS, 82, 197.
Fanelli, M. N., O’Connell, R. W., Burstein, D. & Wu, C.-C. 1990, ApJ, 364, 272.
Fanelli, M. N., O’Connell, R. W. & Thuan, T. 1987, ApJ, 321, 768.
Foltz, C. B., Chaffee, F. H., Weymann, R. J. & Anderson, S. F. 1988, in QSO Absorption Lines, STScI Symp. Ser. v.2, J. C. Blades, D. Turnshek & C. A. Norman, eds., (Cambridge Univ. Press: Cambridge), p.53.
Fosbury, R. A. E., di Serego Alighieri, S., Courvoisier, T., Snijders, M. A. J., Tadhunter, C. N., Walsh, J., & Wilson, W. 1990, in Evolution in Astrophysics, Toulouse, ESA SP-310.
Goodrich, R. W., Cohen, M. H. & Putney, A. 1995, PASP, 107, 179.
Gregory, P. C. & Condon, J. J. 1991, ApJS, 75, 1011.
Oke, J. B., Cohen, J. G., Carr, M., Cromer, J., Dingizian, A., Harris, F. H., Labrecque, S., Lucino, R., Schaal, W., Epps, H., & Miller, J. 1995, PASP, 107, 375.
Henyey, L. G. & Greenstein, J. L. 1941, ApJ, 93, 70.
Hummer, D.G. & Storey, P.J. 1987, MNRAS, 224, 801.
Jakobsen, P. & Perryman, M. A. 1992, ApJ, 392, 432.
Jakobsen, P., Perryman, M. A., Ulrich, M. H., Macchetto, F. & di Serego Alighieri, S. 1986, ApJ, 303, L27.
Jannuzi, B. T. 1994, in Multi Wavelength Continuum Emission of AGN, IAU Symp. 159, ed. T. J.–L. Courvoisier & A. Blecha, (Kluwer: Dordrecht), p. 470.
Jannuzi, B. T. & Elston, R. 1991, ApJ, 366, L69.
Jannuzi, B. T., Elston, R., Schmidt, G., Smith, P., & Stockman, H. 1995, ApJ, 454, L111.
Kartje, J. F. 1995, ApJ, 452, 565.
Kinney, A. L., Bohlin, R. C., Calzetti, D., Panagia, N. & Wyse, R. F. G. 1993, ApJS, 86, 5.
Korista, K. T., Voit, G. M., Morris, S. L. & Weymann, R. J. 1993, ApJS, 88, 357.
Kriss, G. A. 1994, in Proceedings of the 3rd Conference on Astrophysics Data Analysis & Software Systems, ASP Conf. Ser. v. 61, ed. D. R. Crabtree, R. J. Hanisch, & J. Barnes.
Laor, A. 1995, in preparation.
Le Fèvre, O., Hammer, F., Nottale, L., Mazure, A., & Christian, C. 1988, ApJ, 324, L1.
Leitherer, C., Robert, C., & Heckman, T. M. 1995, ApJS, 99, 173.
Lilly, S. J. 1989, ApJ, 340, 77.
Lilly, S. J. & Longair, M. S. 1984, MNRAS, 211, 833.
Longair, M. S., Best, P. N. & Röttgering, H. J. A. 1995, MNRAS, 275, L47.
Massey, P. & Gronwall, C. 1990, ApJ, 358, 344.
Massey, P., Strobel, K., Barnes, J.V. & Anderson, E. 1988, ApJ, 328, 315.
Mathewson, D. S. & Ford, V. L. 1970, MemRAS, 74, 139.
McCarthy, P.J. 1993, ARA&A, 31, 639
McCarthy, P. J., van Breugel, W. & Kapahi, V. K. 1991, ApJ, 371, 478.
McCarthy, P.J., van Breugel, W.J.M., Spinrad, H. & Djorgovski, S. 1987, ApJ, 321, L29
Miller, J. S. & Antonucci, R. J. 1983, 271, L7.
Miller, J. S. & Goodrich, R. W. 1990, ApJ, 355, 456.
Miller, J. S., Goodrich, R. W. & Matthews, W. G. 1991, ApJ, 378, 47.
Miller, J. S., Robinson, L. B. & Goodrich, R. W. 1988, in Instrumentation for Ground-Based Optical Astronomy, ed. L. B. Robinson, (Springer-Verlag: New York), p. 157.
Miley, G. K., Chambers, K. C., van Breugel, W. J. M., & Macchetto, F. 1992, ApJ, 401, L69.
Oemler, A. 1976, ApJ, 209, 693.
Oke, J. B. 1974, ApJS, 236, 27.
Osterbrock, D. E. 1989, Astrophysics of Gaseous Nebulae and Active Galactic Nuclei, (University Science Books: California).
Panek, R. J. & Savage, B. D. 1976, ApJ, 206, 167.
Rees, M. J. 1989, MNRAS, 239, 1P.
Rybicki, G. B. & Lightman, A. P. 1979, Radiative Processes in Astrophysics, (John Wiley & Sons: New York).
Savage, B. D. & Mathis, J. S. 1979, ARA&A, 17, 73.
Schmidt, G. D., Elston, R. & Lupie, O. L. 1992, AJ, 1563.
Schmidt, M. 1963, Nature, 197, 1040.
Sekiguchi, K. & Anderson, K. S. 1987, AJ, 94, 129.
Simmons, J. F. L. & Stewart, B. G. 1985, A&A, 142, 100.
Spinrad, H. 1986, PASP, 98, 269.
Spinrad, H. & Djorgovski, S. 1984, ApJ, 285, L49.
Spinrad, H., Filippenko, A. V., Wyckoff, S., Stocke, J. T., Wagner, R. M. & Lawrie, D. G. 1985, ApJ, 299, L7.
Steidel, C. C. & Sargent, W. L. W. 1991, ApJ, 382, 433.
Steidel, C. C. & Sargent, W. L. W. 1992, ApJS, 80, 1.
Stocke, J. T., Foltz, C. B., Weymann, R. J. & Christiansen, W. K. 1984, ApJ, 280, 476.
Tadhunter C. N., Fosbury, R. A. E., & di Serego Alighieri, S. 1988, in Proc. of the Como Conference, BL Lac Objects, ed. L. Maraschi, T. Maccacaro & M. H. Ulrich (Berlin: Springer-Verlag), 79.
Tran, H. D. 1995a, ApJ, 440, 565.
Tran, H. D. 1995b, ApJ, 440, 578.
Tran, H. D. 1995c, ApJ, 440, 597.
Turnshek, D. A. 1988, in QSO Absorption Lines, STScI Symp. Ser. v.2, J. C. Blades, D. Turnshek & C. A. Norman, eds., (Cambridge Univ. Press: Cambridge), p.17.
Underhill, A. B., Leckrone, D. S., & West, D. K. 1972, ApJ, 171, 63.
Wardle, J. F. C. & Kronberg, P. P. 1974, ApJ, 194, 249.
Weymann, R. J., Carswell, R. F. & Smith, M. G. 1981, ARA&A, 19, 41.
Wilson, A. N. & Tsvetanov, Z. I. 1994, AJ, 107, 1227.