A Survey of the Galactic Plane for 6.7-GHz Methanol Masers I: = 325°– 335° ; = -053 – 053
Abstract
We report the results of the first complete survey of an area of the Galactic Plane for maser emission from the 6.7-GHz transition of . The survey covers a 10.6-square-degree region of the Galactic Plane in the longitude range 325°– 335° and latitude range -053 – 053. The survey is sensitive to masers with a peak flux density greater than 2.6 Jy. The weakest maser detected has a peak flux density of 2.3 Jy and the strongest a peak flux density of 425 Jy. We detected a total of 50 distinct masers, 26 of which are new detections. We show that many 6.7-GHz masers are not associated with IRAS sources, and that some are associated with sources that have colours differing from those of a typical ultra-compact Hii region (UCHii). We estimate that the number of UCHii regions in the Galaxy is significantly more than suggested by IRAS-based estimates, possibly by more than a factor of two.
keywords:
masers – ISM:molecules – Hii regions – stars:formation – radio lines:ISM1 Introduction
In the four years since the discovery of maser emission from the transition of several searches for 6.7-GHz maser emission have been made towards sites of OH and 12.2-GHz masers [Menten 1991, MacLeod & Gaylard 1992, MacLeod, Gaylard & Nicolson 1992, Caswell et al. 1995a]. Schutte et al. [Schutte et al. 1993] have searched toward sources believed to be ultra-compact Hii regions on the basis of their colours in the IRAS (Infrared Astronomy Satellite) Point-Source Catalog [IRAS Point-Source Catalog 1985]. In nearly all cases, the 6.7-GHz masers are stronger than their 12.2-GHz and OH counterparts. Thus, the first search method is likely to find few weak 6.7-GHz masers. The IRAS satellite had a beamwidth of 2 arcmin at 100 m, so that in the extremely crowded and confused regions close to the Galactic Plane many ultra-compact Hii (UCHii) regions may not have been detected. Thus, the second search method is likely to miss a significant number of masers associated with UCHii regions.
Here we present an untargeted search of a region of the Galactic Plane known to be rich in masers of other molecular transitions. An untargeted search enables us to detect new 6.7-GHz masers associated with sites of massive star formation and also to find any masers which may be associated with different classes of object. For several reasons, the 6.7-GHz transition of is very good for detecting new sites of massive star formation. It is the second strongest maser transition known, after the 22-GHz transition of , and as it occurs at a far lower frequency, the telescope beam will be larger, enabling a more rapid search of a large portion of the Galactic Plane. In addition, the 6.7-GHz masers are less variable than either or 12.2-GHz masers [Caswell et al. 1995b]. Thus there is less chance that a source will drop below the detectability threshold in the interval between the initial survey and final observations.
The various transitions of masers have been separated into two classes on the basis of several observed properties [Batrla et al. 1987]. The original distinction between the two classes of masers was that class II masers are typically associated with UCHii regions, which often also show OH and maser emission. The 6.7- and 12.2-GHz transitions are the most common examples of class II masers. Class I masers are usually found offset from UCHii regions, and are typically weaker and have fewer components than the class II masers. Class II transitions, particularly the 12.2-GHz transition, are often seen in absorption toward the sites of class I maser emission. Recent observations by Slysh et al. detected 44.1-GHz class I masers toward many 6.7-GHz class II masers. They found that the strong 44.1-GHz masers were usually associated with weaker 6.7-GHz masers and that while the two transitions often shared the same velocity range, there was no detailed correspondence between features in the 44.1-GHz spectrum and those in the 6.7-GHz spectrum.
Since the release of the IRAS Point-Source Catalog [IRAS Point-Source Catalog 1985], many searches for masers have been made by observing towards IRAS sources which satisfy various criteria [Braz & Sivagnanam 1987, Cohen, Baart & Jonas 1988, Palla et al. 1991, Schutte et al. 1993]. The IRAS satellite made observations in four wavelength bands at 12, 25, 60 and 100 m. Each flux density measurement has an associated quality flag, indicating whether the observation is of high or moderate quality, or only an upper limit. The most frequently used criteria for selecting UCHii regions from the IRAS catalog were developed by Wood & Churchwell [Wood & Churchwell 1989]. They found that IRAS sources which satisfied & were more likely to be UCHii regions than those in other regions of the colour–colour diagram. Currently, searches using IRAS selection criteria seem to be amongst the most reliable methods of finding UCHii regions. However, if all 6.7-GHz masers are associated with UCHii regions, they may allow a more accurate determination of the number of UCHii regions in the Galaxy.
2 Observations
The observations were made between 1993 April and 1994 September using the University of Tasmania’s 26-m antenna at the Mt Pleasant Observatory. This antenna has rms pointing errors of 0.7 arcmin and a 7-arcmin HPBW at 6.7 GHz. A dual-channel, cryogenically cooled HEMT receiver, with two orthogonal circular polarizations, was used for all observations. A 1-bit digital autocorrelation spectrometer, with 512 channels per polarization covering 2.5 MHz, was used for the survey observations. This configuration gives a velocity coverage of 112.5 and a velocity resolution after Hanning smoothing of 0.44 at 6668.518 MHz, the rest frequency of the transition of . Between Galactic longitudes 325° and 330°, observations were centred on a velocity of -70 with respect to the local standard of rest, and between 330° and 335° observations were centred on a velocity of -30 . Hydra A and Virgo A were used as flux density calibrators, with assumed peak fluxes of 10.4 and 54.1 Jy in a 7-arcmin beam. The survey observations were made in an equilateral triangular grid pattern, with each grid point separated by 3.5 arcmin (half the HPBW at the observing frequency) from all adjacent points. In total, the survey consisted of observations at approximately 3500 sky positions. The on-source integration time at each grid point was 10 min. The system noise was typically 650 Jy, yielding an rms noise level of 330 mJy in each spectral channel after Hanning smoothing and averaging the two polarizations.
As the survey observations were made in a wide variety of conditions, the sensitivity limit is not uniform across the entire region. We minimised variations in the sensitivity limit of the individual spectra by limiting the range of elevations over which we observed, and then we re-observed poor-quality spectra. As maser profiles are generally very narrow, high spectral-resolution observations are required to measure the full peak flux density. The attenuation of the maser peak depends upon the width of the maser, the spectral resolution, and the position of the maser with respect to the centre of the spectral channel. To determine a typical halfwidth for the 6.7-GHz masers, we did a Gaussian component analysis of 17 of the sources in our sample. Many of the features in the maser spectra are clearly blended, significantly increasing the difficulty of the Gaussian analysis. To avoid errors introduced by our analysis we used only the strongest three components from each of the spectra, or the strongest only in the case of spectra with three or fewer components. For these 47 features, the mean width at the half-power points of the 6.7-GHz masers was 0.47 . The peak flux density of a maser of width 0.47 would be reduced, on average, to 68 per cent of its true value by observations made with the spectral resolution of this survey. As the maser will not usually be at the centre of the telescope beam, the detected maser peak flux density will be further attenuated typically by about 5.5 per cent. With an rms level of 330 mJy, our effective 5- detection limit lies in the range 2.4 (best) to 3.0 Jy (worst), with a mean of 2.6 Jy.
Most of the masers were detected in several beam positions in the initial survey. The relative intensities were then used to obtain an approximate position for the source. We then determined a more accurate position by observing a grid of 5 points centred on the approximate position (1 at the approximate position and 4 in a square surrounding it). Some of the sources have positions determined from the Parkes telescope, or Australia Telescope Compact Array (ATCA) observations, and the rms difference between these and our positions is 0.6 arcmin. Finally, we made high signal-to-noise ratio observations of all detected sources. On-source integration times ranged from 10 to 90 min, resulting in spectra with signal-to-noise ratios of at least 15:1. All but the weakest sources (326.40+0.51, 327.61-0.11 and 332.33-0.44) were re-observed using a correlator configuration of two 512-channel spectra, each spanning 0.625 MHz, resulting in a velocity resolution after Hanning smoothing of 0.11 . The three weakest sources were re-observed using the same correlator configuration as for the main part of the survey. Most sources were observed at the positions which we determined, although for several close groups of sources the Parkes and ATCA positions were used because of the difficulty in determining exact separations with our larger beam. The position at which each source was observed is listed in Table 1.
3 Results
These observations resulted in the detection of 50 individual 6.7-GHz masers (summarized in Table 1). Spectra from all sources are shown in Fig. 1. Of the 50 sources, 37 lie in the spatial and velocity range which the survey sampled completely. The remaining 13 sources were detected either because they had a sufficiently high flux density that they were detected even though they lay outside the survey region, or because they were detected by accident while refining source positions or taking off-source reference spectra. As these positioning observations were centred at the detected velocity, they occasionally resulted in the serendipitous discovery of sources offset in either position or velocity from the parameter space sampled by the survey. Of these 13 sources detected which lie outside the fully sampled parameter space of the survey, 6 were new discoveries and 7 were already known. Most of the sources in the region = 330°– 335° which lie outside the complete sample do so because their velocities are more negative than -86 (our observed limit of velocity range where spectra are centred at -30 ).


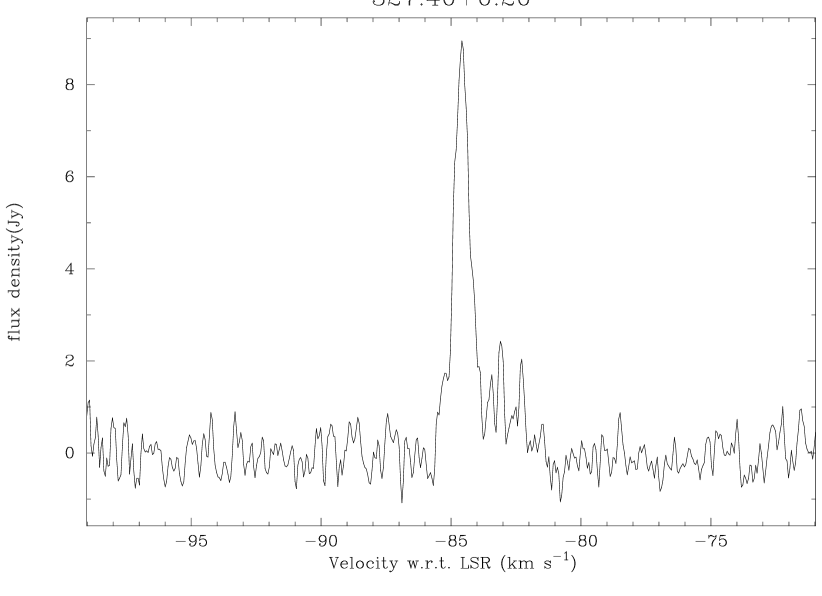


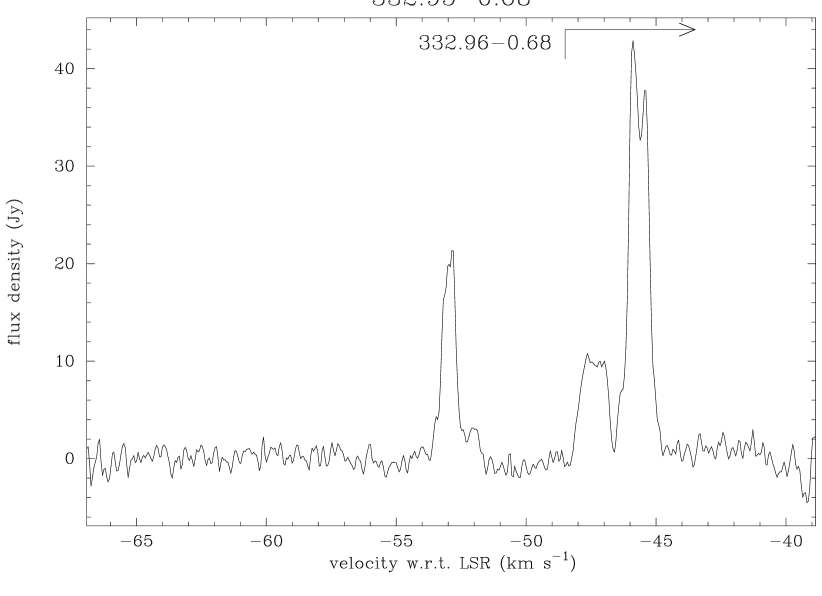


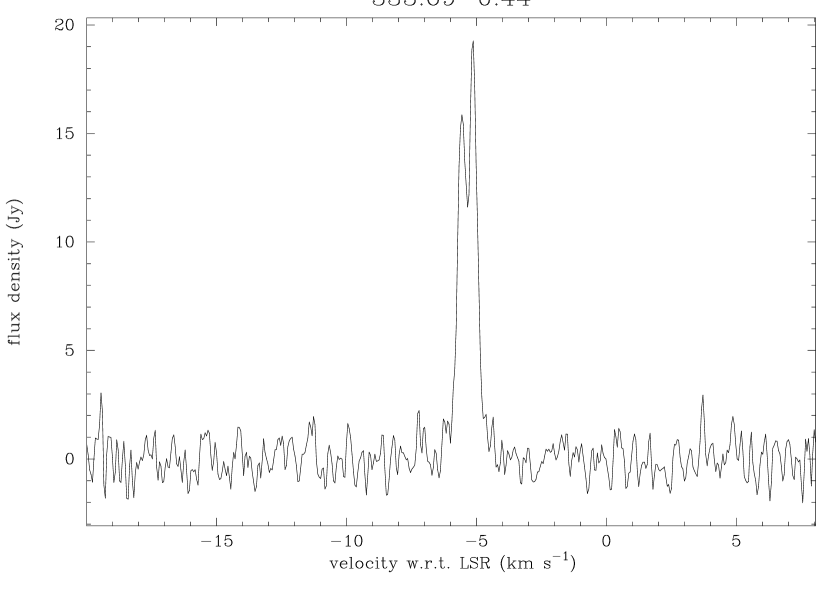


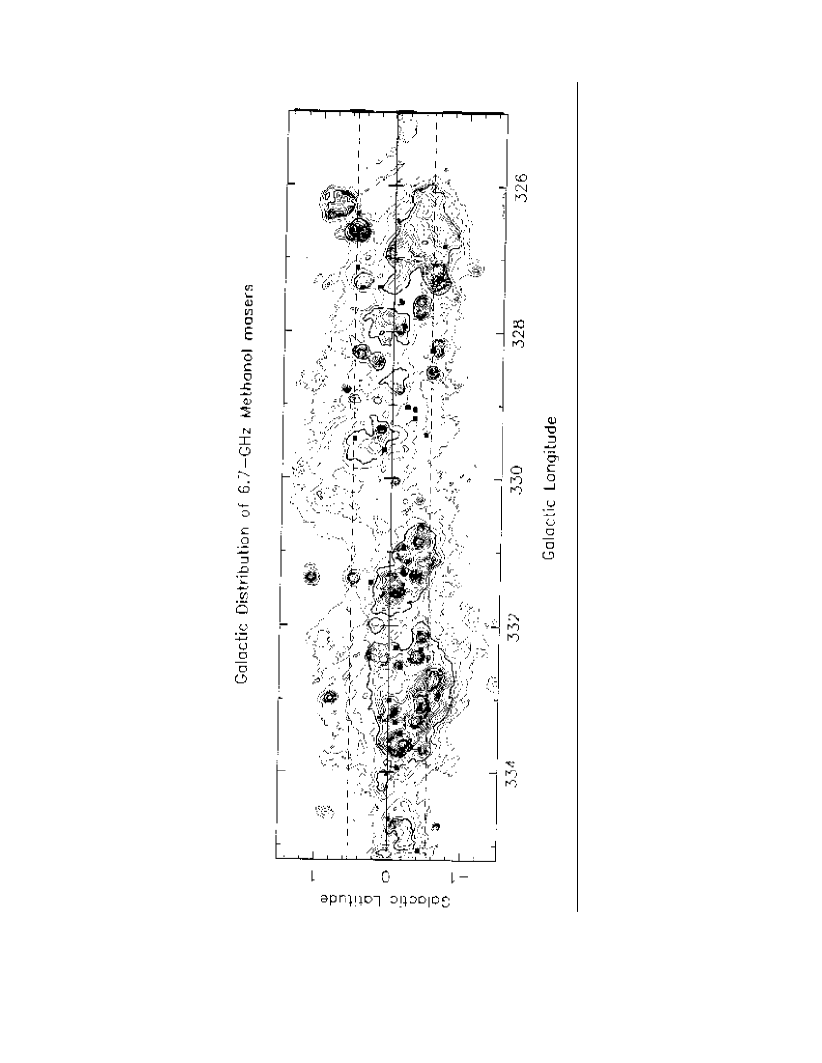
Fig. 2 shows the positions of all the detected 6.7-GHz masers, superimposed upon a 5-GHz continuum image of the region [Haynes et al. 1978]. In many cases the maser emission is closely associated with local maxima in the continuum emission. Sometimes the position of the masers is slightly offset from the local maximum, probably at the location of an ultra-compact core embedded in a cloud of more diffuse gas. Several centres of maser emission are often contained within one Hii region, indicating several separated sites of star formation within the one larger molecular cloud. In many cases, the maser emission appears to be associated with the continuum emission. Two regions in particular , 325° 326° and 3296 3310, have a generally lower level of continuum emission than the rest of the surveyed region and no masers were detected in either region. While not all of the continuum features within the survey region have 6.7-GHz masers associated with them, approximately half do, and high-latitude searches towards regions of enhanced continuum emission may prove to be an effective searching method. A comparison with the IRAS Point-Source Catalog [IRAS Point-Source Catalog 1985], reveals that only 26 of the 50 sources detected have positions within 1 arcmin of an IRAS source, and in many cases the nearest IRAS source is more than 2 arcmin away.
| Methanol | Right Ascension | Declination | Peak | Peak Vel. | Velocity | Integrated | references |
|---|---|---|---|---|---|---|---|
| maser | (J2000) | (J2000) | Flux | wrt LSR | Range | Flux | |
| () | (Jy) | () | () | (Jy) | |||
| 15:43:40.7 | -54:19:28 | 2.4 | -38.1 | 1.4 | * | ||
| 15:44:33.3 | -54:06:23 | 18 | -43.1 | -44,-36 | 18.8 | 1,14 | |
| 15:44:52.1 | -54:10:30 | 5.6 | -41.0 | -42,-38 | 8.3 | *,6 | |
| 15:51:11.1 | -54:59:01 | 10 | -57.6 | -59,-57 | 9.7 | * | |
| 15:47:33.6 | -53:52:35 | 80 | -87.1 | -90,-83 | 49.8 | 1,2,4,8 | |
| 15:49:14.0 | -53:45:36 | 106 | -82.6 | -84,-75 | 153.1 | 1,2,3,4,7,11 | |
| 15:50:21.4 | -53:56:25 | 9 | -84.6 | -86,-82 | 9.0 | * | |
| 15:52:34.0 | -54:03:12 | 3.2 | -86.2 | 1.7 | * | ||
| 15:52:47.3 | -54:03:15 | 2.3 | -97.5 | 1.8 | * | ||
| 15:54:34.8 | -53:52:18 | 6.6 | -51.7 | -52,-51 | 3.0 | * | |
| 15:57:58.5 | -53:59:23 | 421 | -44.9 | -46,-34 | 437.7 | 1,3,4,6,7,11,13,15 | |
| 15:57:59.9 | -53:58:01 | 425 | -37.4 | -50,-36 | 428.1 | 1,3,4,6,7,11,13 | |
| 15:55:51.2 | -52:42:36 | 278 | -44.5 | -47,-43 | 353.0 | 1,3,4,7,11,13,15 | |
| 16:00:22.1 | -53:12:57 | 25 | -41.9 | -47,-41 | 38.2 | 1,3,4,7,11,15,16 | |
| 16:00:36.0 | -53:12:17 | 275 | -37.5 | -41,-34 | 360.0 | 1,3,4,7,11 | |
| 16:01:12.7 | -53:15:58 | 24 | -43.9 | -48,-43 | 17.4 | * | |
| 16:01:36.3 | -53:11:49 | 13 | -55.7 | -60,-51 | 18.6 | 1,2,4,8 | |
| 16:00:29.3 | -52:44:39 | 14 | -106.5 | -107,-10 | 8.3 | * | |
| 16:03:36.5 | -53:08:58 | 144 | -66.8 | -71,-66 | 106.0 | 1,2,4,8,10 | |
| 15:59:39.9 | -52:22:45 | 13 | -72.1 | -73,-65 | 17.1 | 14 | |
| 16:02:07.3 | -52:35:13 | 30 | -60.1 | -69,-59 | 26.5 | * | |
| 16:09:53.3 | -51:55:38 | 7 | -87.6 | -89,-87 | 4.1 | 1,2,4,6,9 | |
| 16:11:00.7 | -51:51:18 | 34 | -84.4 | -92,-84 | 43.3 | 1,2,4,5,8,15 | |
| 16:11:22.3 | -51:42:26 | 165 | -78.1 | -86,-78 | 250.3 | 2,3,4,5,7,11,12,13 | |
| 16:12:23.3 | -51:46:11 | 66 | -67.4 | -68,-64 | 124.9 | 2,4,8,15 | |
| 16:10:10.3 | -51:16:18 | 25 | -88.6 | -91,-88 | 19.9 | * | |
| 16:12:14.6 | -51:34:39 | 70 | -88.5 | -93,-84 | 158.0 | * | |
| 16:12:10.9 | -51:25:24 | 12 | -84.1 | -87,-83 | 12.5 | 1,2,4,6,7 | |
| 16:12:28.7 | -51:27:04 | 35 | -103.4 | -105,-94 | 46.0 | 4 | |
| 16:16:19.3 | -51:17:50 | 16 | -61.4 | -62,-58 | 16.8 | * | |
| 16:15:50.5 | -50:55:26 | 6.3 | -47.0 | -47,-42 | 8.3 | * | |
| 16:17:29.3 | -51:09:24 | 4 | -53.8 | 4.5 | * | ||
| 16:17:19.2 | -50:46:33 | 5 | -51.0 | -56,-49 | 5.6 | * | |
| 16:21:19.9 | -50:53:40 | 21 | -52.9 | -54,-52 | 14.9 | * | |
| 16:21:23.2 | -50:53:02 | 41 | -45.9 | -48,-38 | 49.2 | * | |
| 16:18:47.3 | -50:21:56 | 3 | -53.6 | -61,-53 | 6.3 | * | |
| 16:20:53.7 | -50:37:32 | 12 | -54.5 | -55,-53 | 7.7 | 4,6 | |
| 16:20:59.5 | -50:35:47 | 11 | -49.3 | -50,-48 | 11.6 | 1,2,4,6,8,15 | |
| 16:21:02.7 | -50:35:54 | 3 | -44.4 | -45,-42 | 1.9 | 4,6 | |
| 16:21:39.1 | -50:40:06 | 17 | -56.8 | -63,-52 | 14.9 | * | |
| 16:19:41.7 | -50:19:53 | 8 | -95.3 | -95,-91 | 3.7 | 4 | |
| 16:19:46.3 | -50:17:20 | 6.5 | -82.0 | -85,-81 | 5.0 | 4 | |
| 16:19:51.0 | -50:15:18 | 4.7 | -81.9 | -92,-81 | 3.0 | 1,2,4,15 | |
| 16:19:31.7 | -50:04:03 | 9 | -43.7 | -50,-41 | 24.7 | * | |
| 16:21:18.1 | -50:09:47 | 41 | -42.4 | -49,-37 | 39.2 | 1,4,7 | |
| 16:21:13.7 | -49:58:49 | 39 | -35.9 | -37,-34 | 58.0 | * | |
| 16:23:32.6 | -50:12:05 | 19 | -5.2 | -6,-4 | 13.2 | * | |
| 16:23:19.5 | -49:48:14 | 7 | -36.8 | -37,-36 | 4.3 | * | |
| 16:25:51.1 | -49:13:07 | 61 | -30.1 | -31,-27 | 53.5 | * | |
| 16:29:28.9 | -49:11:36 | 15 | -47.0 | -48,-39 | 16.5 | * |
3.1 Comments on individual sources
326.40+0.51: This source is the weakest detected in the survey and is the only source for which we were unable to improve the positional accuracy from the initial survey observations. There is no associated IRAS source, the nearest being 15395-5411 which is more than 3 arcmin away and has colours which suggest that it is unlikely to be an UCHii region.
326.63+0.60: This maser was discovered by Schutte et al. [Schutte et al. 1993] (hereafter referred to as SWGM), who report it to have a peak flux density of 70 Jy. We measured a peak flux density of 18 Jy, implying a variation of more than a factor of 4 over a period of 15 months. A comparison of our spectrum with that of SWGM shows that the ratio of the various features has changed surprisingly little, considering the magnitude of the absolute variations. However, we detect a 2-Jy peak at -36 which is beneath the noise level in their spectrum. SWGM detected this maser by searching toward the IRAS source 15408-5356, but we measure the maser emission to be separated from the IRAS source by 1.5 arcmin.
Molecular emission towards this region was first detected by Kaufmann et al. [Kaufmann et al.1976], who discovered maser emission at a velocity of -41 . Broad 12.2-GHz absorption, 14.5-GHz absorption, recombination line emission and 44.1-GHz maser emission, have also been detected at nearby positions, all with velocities between -38 and -45 [Peng & Whiteoak 1992, Slysh et al. 1994]. Although we cannot be certain that all these sources are positionally coincident, their velocities suggest that they are, and the unusual combination of emission and absorption sources, a highly variable 6.7-GHz maser, and no detected OH maser implies that this would be an interesting source for further high-resolution study.
326.63+0.52: This maser is separated by nearly 5 arcmin from 326.63+0.60. However, there is an overlap in the velocity ranges, and the peak component is partially blended with the weaker component of 326.63+0.60. Again there is no nearby IRAS source, though the nearest source 15412-5359, (separated by 2.2 arcmin from the maser emission) is identified as an Hii region, or dark cloud.
327.12+0.51: This source is typical of stronger class II masers, with associated OH and masers covering a similar velocity range [Caswell et al. 1980, Batchelor et al. 1980]. Caswell et al. [Caswell et al. 1995a] detected no variability over the period of their observations. Our observations show that the source has remained relatively constant in the intervening period, with perhaps a slight decrease in the component at -83.5 .
327.40+0.44: This source was first detected at the position of a known 12.2-GHz maser by MacLeod et al. [MacLeod, Gaylard & Nicolson 1992]. There is an anticorrelation between the the strongest and weaker features of the 6.7- and 12.2-GHz emission and those of the associated OH and masers [Caswell et al. 1993, Caswell et al. 1980, Batchelor et al. 1980]. The 6.7-GHz emission covers a greater velocity range than any of the other transitions, which suggests that the and OH masers are part of a blue-shifted outflow.
327.40+0.20: A new detection, this source appears to be associated with the IRAS source 15464-5348, which lies in region III of the colour–colour diagram as defined by SWGM. However, it fails their 60- and 100-m flux density criteria and so they did not search the IRAS source.
327.59-0.09 & 327.61-0.11: These two new sources are separated by 2 arcmin. Each has only a single component and neither has an IRAS counterpart.
327.93-0.14: This new detection has a single asymmetric feature which is probably a blend of two or more components. The closest IRAS source (15507-5345), is separated by 1.6 arcmin from the maser emission and has colours atypical of an UCHii region.
328.24-0.55 & 328.25-0.53: These two masers are the strongest sources detected in this survey. They are also in one of the best studied regions of molecular emission in the Southern Hemisphere, exhibiting maser emission from the 6.7-, 12.2- and 44.1-GHz transitions of as well as OH [Caswell et al. 1993, Slysh et al. 1994, Caswell et al. 1980]. High-resolution images of the 6.7-GHz emission made with the ATCA by Norris et al. [Norris et al. 1993] show that the spatial morphology of the maser spots is approximately linear at both centres of emission. The 44.1-GHz emission is centred on a velocity of -41 [Slysh et al. 1994]. However, at this velocity there is no emission from the other transitions and the 12.2-GHz absorption is strongest [Caswell et al. 1995c]. This is consistent with current theories of class I maser emission which suggest that they are partially collisionally pumped [Cragg et al. 1992], possibly by high-velocity outflows interacting with the parent molecular cloud [Menten 1993]. These sources are listed as slightly variable at 6.7 GHz by Caswell et al. [Caswell et al. 1995a], and the peak flux density we measure for 328.24-0.55 appears to be slightly larger than that observed by Caswell et al.
328.81+0.63: This source is also strong and well studied, showing maser emission from the 6.7-, 12.2- and 44.1-GHz transitions of and the 1.665- and 6.035-GHz transitions of OH [Caswell et al. 1993, Slysh et al. 1994, Caswell et al. 1980, Smits 1994]. It is a good example of the radial velocity anticorrelation between class I and class II masers, noted by Slysh et al., with the 6.7-GHz emission covering the range -47 to -43 and the 44.1-GHz emission covering the range -43 to -40 . The peak of the OH emission is at a similar velocity to that of the class II but the total velocity range is larger, encompassing the ranges of both the class I and II masers. 328.81+0.63 is another source for which high-resolution studies show the spatial distribution of the 6.7-GHz maser spots to be highly linear [Norris et al. 1993]. Most of the maser species associated with this source are relatively strong, making it an excellent candidate for studying the relationship between the different molecular transitions, and star formation in general. Comparison of our spectrum with that of Caswell et al. [Caswell et al. 1995a], shows a decrease in the peak flux density of approximately 25 per cent over the last two years.
329.03-0.20 & 329.03-0.21: Maser emission from a wide range of transitions (12.2- and 44.1-GHz and OH) is associated with these two sources, though primarily with 329.03-0.21, which is the stronger at 6.7 GHz [Norris et al. 1987, Slysh et al. 1994, Caswell et al. 1980]. The closest IRAS source to both centres of maser emission is 15566-5304, which is not likely to be an UCHii region, as it has a 12-m flux density which is greater than the 25-m flux density. ATCA observations by S. P. Ellingsen et al. (in preparation) failed to detect any continuum emission associated with either of the masing regions.
329.07-0.31: This source is close to 329.03-0.20 & 329.03-0.21, and a sidelobe response from the latter can been seen quite clearly in the spectrum. Although the velocity ranges of 329.03-0.20 and 329.07-0.31 overlap, 329.03 appears to be sufficiently distant that it does not contribute significantly to the observed flux density of 329.07-0.31. The maser appears to be associated with the IRAS source 15573-5307, which falls in region I of SWGM’s IRAS colour–colour diagram. However, the 60- and 100-m flux densities fail their criteria.
329.18-0.31: This is another well-known maser source, with associated 12.2-GHz , OH and maser emission [Caswell et al. 1993, Caswell et al. 1980, Batchelor et al. 1980]. It exhibits much weaker maser emission in both class II transitions than most other sources in this category.
329.33+0.15: This new detection appears to be associated with the IRAS source 15567-5236, with the 6.7-GHz maser situated 0.6 arcmin from the IRAS source. This source is listed as a non-detection by SWGM, which implies that in mid-1993 it had a flux density of 5 Jy. We observed a peak flux density of 14 Jy, which implies a lower limit on the increase of nearly 3 in less than a year.
329.41-0.46: This object shows OH and maser emission, and both absorption and weak emission from 12.2-GHz [Caswell et al. 1980, Batchelor et al. 1980, Caswell et al. 1995c]. The strongest absorption is redshifted with respect to the peak emission in all transitions, although there is some OH emission in this region which may represent an outflow.
329.48+0.51: This is the second maser in our sample discovered by SWGM. It has a somewhat unusual spectral appearance, with at least six maser features within a 3 velocity range and one further feature blueshifted by 5 from the other emission. The offset feature is not a separate source, as far as we can determine from our single-dish grid observations.
330.95-0.18: This source is unusual in that the OH and maser emission is much more complex and covers a far greater velocity range than that of the 6.7-GHz [Caswell et al. 1980, Batchelor et al. 1980]. It is also one of the few sources for which the OH maser emission is stronger than the 6.7-GHz . Studying this source in detail and comparing it with other more typical sources may yield important insights into the physical conditions required to pump both OH and masers.
331.13-0.24: This is one of the most variable 6.7-GHz masers, with some features changing by more than an order of magnitude over a period of a few months [Caswell et al. 1995b]. Comparison of our spectrum with those published in the literature shows that large-scale variations are continuing [MacLeod & Gaylard 1992, Caswell et al. 1995a, Caswell et al. 1995b]. The maser emission is quite weak and spans a larger velocity range than the , while the OH emission has its peak in between the two centres of emission [Batchelor et al. 1980, Caswell et al. 1980]. The 44.1-GHz maser also has several discrete regions of emission, the peak corresponding to the the weaker of the two regions in our 6.7-GHz spectra and the secondary approximately coincident with the peak of the OH emission [Slysh et al. 1994].
331.28-0.19: This source is one of the better studied maser sources, with high-resolution 6.7- and 12.2-GHz images showing a positional coincidence of some of the aligned spectral features to better than 20 milliarcsec [Norris et al. 1988, Norris et al. 1993]. Caswell et al. [Caswell et al. 1995a] list this source as slightly variable, and a comparison of our spectrum with that of Caswell et al. shows that the strongest component appears to have decreased by 20 per cent over the last two years. This source also exhibits strong maser emission in the 12.2-GHz transition of . As the peak components at 6.7 and 12.2 GHz exhibit both a spectral and positional coincidence, a comparison of the variability at the two frequencies may yield important information on the pumping mechanism for the class II masers.
331.34-0.35: Caswell et al. [Caswell et al. 1995b] found that the stronger 6.7-GHz masers are typically less variable than the weaker maser sources. However, 331.34-0.35 appears to be an exception. A comparison of our spectrum with that of Caswell et al. [Caswell et al. 1995a] shows that the feature at -65 has decreased by about a factor of 2, while at the same time the feature at -68 has increased by a factor of 2 and the feature at -67 has remained relatively unchanged. Unusually, the class I 44.1-GHz maser emission lies in the same velocity range as the class II 6.7-GHz emission [Slysh et al. 1994].
331.42+0.26: This new detection lies at the edge of a large region of complex continuum emission (see Fig. 8). The nearest IRAS source 16062-5108 is 1 arcmin away and has colours atypical of an Hii region.
331.45-0.18: This is the strongest 6.7-GHz maser of those discovered by this survey and has a complex spectral morphology. It lies in the region of the Galactic Plane which Caswell et al. [Caswell et al. 1980] searched for OH maser emission, implying that there was no OH maser with peak flux density 1 Jy. Unless OH emission is present but was missed in the earlier surveys, this source lies at an extreme of the 6.7-GHz :OH flux ratio distribution. This source lies 0.6 arcmin from an IRAS source (16084-5127) which has colours placing it in region III of SWGM’s IRAS colour–colour diagram, but fails their 100-m flux density criterion.
331.54-0.07 & 331.56-0.12: The first of these sources was discovered by Caswell et al. [Caswell et al. 1995a] and is near 331.56-0.12, which can be seen at the edge of our spectrum. There is OH and maser emission in the general direction of these two sources, though exactly which features are associated with each of the sources has not yet been clearly determined [Caswell et al. 1995a]. The OH emission has a velocity range from approximately -85 to -94 and the emission has a velocity range from approximately -75 to -105 with a blueshifted outflow at a velocity of approximately -140 [Caswell et al. 1980, Batchelor et al. 1980]. 331.56-0.12 also has a 12.2-GHz maser associated with it which has a similar spectral morphology to the 6.7-GHz maser [Caswell et al. 1995c].
332.11-0.42: This is the first of several new 6.7-GHz masers discovered between Galactic latitudes 332° and 333°. This source has a good positional coincidence with the IRAS source 16124-5110, which has colours atypical of an UCHii region.
332.31-0.10: This new detection is close to the IRAS source 16119-5048. This meets the colour and flux density criteria for region III of SWGM’s IRAS colour–colour diagram, but it has an upper limit for the 100-m flux density and so was not searched by them.
332.33-0.44: This maser lies at the edge of a peak in the continuum emission (see Fig. 8), but does not appear to have an IRAS counterpart. The nearest IRAS source (16357-5100) is 1.3 arcmin away and has colours which suggest that it is probably not an UCHii region.
332.58-0.15: This source also lies at the edge of a continuum peak, but has no IRAS counterpart, the nearest IRAS source 16136-5038 being 2 arcmin away.
332.95-0.68 & 332.96-0.68: Discovered serendipitously while taking a reference spectrum for another observation, these sources are separated by only 48 arcsec, but have non-overlapping velocity ranges. 332.95-0.68 appears to be associated with the IRAS source 16175-5046, and 332.96-0.68 with 16175-5045, both of which lie in region III of SWGM’s IRAS colour–colour diagram. However, each has upper limits for two of the IRAS flux density bands and so neither IRAS source was searched by them.
333.03-0.02: This is a 6.7-GHz weak maser which lies near the edge of a continuum peak (see Fig. 8), and has no IRAS counterpart. It differs from most sources of this strength in that it has at least four components.
333.07-0.45, 333.12-0.43 & 333.13-0.44: Although positionally adjacent, these sources are widely separated in velocity. There is 12.2- and 44.1-GHz maser emission as well as OH and maser emission from this general region [Caswell et al. 1995c, Slysh et al. 1994, Caswell et al. 1980, Batchelor et al. 1980]. Caswell et al. [Caswell et al. 1995c] detected weak 12.2-GHz emission associated with 333.07-0.54 and Caswell et al. [Caswell et al. 1995a], determined that the OH emission is associated with 333.12-0.43, making this another case where the OH emission is stronger that of the 6.7-GHz emission and also covers a wider velocity range. The 44.1-GHz and maser emission cover the velocity ranges of both 333.12-0.43 and 333.13-0.44, and may not be closely associated with either source.
333.15-0.56: This new detection shows a somewhat unusual spectral morphology, with three distinct single peaks. Its position is close to a peak in the continuum emission (see Fig. 8), but has no associated IRAS source.
333.16-0.10, 333.20-0.08 & 333.23-0.06: These sources are close together and the latter two are severely blended in the 7-arcmin beam of the Hobart telescope. Caswell et al. [Caswell et al. 1995a] list all of the components of 333.23-0.06 as being variable and they measure a flux density of 3.8 Jy for the -80.5 peak, whereas in our spectrum it has a flux density of 1 Jy. The strongest peak in 333.23-0.06 is at a velocity of -81.9 but it is blended with emission from 333.20-0.08, and the true flux density of this component is probably less than half that listed in Table 1. Once again there is emission from 12.2- and 44.1-GHz , OH and [Caswell et al. 1995c, Slysh et al. 1994, Caswell et al. 1980, Batchelor et al. 1980]. Caswell et al. [Caswell et al. 1995a] determined that the OH emission is most closely associated with 333.23-0.06 and this also appears to be the case for the and 44.1-GHz maser emission. This is somewhat surprising as it is the weakest of this group of sources at 6.7 GHz.
333.33+0.11: An unusually large number of components distinguishes this source from most others with low peak flux density. We made several observations of this source while trying to determine its position and found its flux density to vary significantly over a period of a week. It appears to be associated with the IRAS source 16157-4957, which lies in region I of SWGM’s colour–colour diagram, but does not satisfy their 60-m flux density criterion.
333.47-0.17: This maser has a weak OH counterpart, with emission and absorption spanning the range of most of the 6.7-GHz emission [Caswell et al. 1980]. Comparison of our spectrum with that of Caswell et al. [Caswell et al. 1995a] shows that the flux density of the peak component in this source has nearly halved in intensity (from 70 to 41 Jy) over a period of 18 months, but the rest of the features have remained relatively constant. This source appears to be associated with the IRAS source 16175-5002, which is 0.4 arcmin away and has colours which place it in region III of SWGM’s colour–colour diagram.
333.58-0.02: This is one of the stronger new sources, showing several strong peaks within a small velocity range. There are also several weak features blueshifted from the peak emission by a few . This source has no IRAS counterpart.
333.69-0.44: This sources is associated with a peak in the continuum emission (see Fig. 8) and with the IRAS source 16196-5005. The IRAS source lies in region III of SWGM’s colour–colour diagram, but has upper limits for the 25- and 100-m flux density measurements and so was not included in their search. This source has a velocity quite close to the local standard of rest and the IRAS counterpart is identified as an Hii region or dark cloud.
333.95-0.14: This new 6.7-GHz maser appears to be associated with the IRAS source 16194-4941, which lies well outside the region of the colour–colour diagram which SWGM searched. Like the previous source, the IRAS counterpart is identified as an Hii region, or a dark cloud.
334.65-0.02: One of the strongest new sources detected, it may be associated with the IRAS source 16220-4906, which does not have the colours of an UCHii region, as the 25-m flux density is less than the 12-m flux.
335.08-0.43: This source lies at the edge of a large area of low-level continuum emission (see Fig. 8). It does not appear to be associated with an IRAS source, the closest being 16256-4905.
4 Discussion
This survey has doubled the number of 6.7-GHz masers detected in the region = 325°– 335°, = -053 – 053. Before this survey there were nearly 250 known 6.7-GHz masers in the Galaxy. If we extrapolate the results of the region we have surveyed to the entire Galaxy, this implies that there are at least 500 detectable masers of the transition of .
Previous searches for 6.7-GHz masers have not detected any which are known to be associated with objects other than sites of massive star formation, presumably because of the selection criteria in previous searches. Many of the detected sources are not associated with IRAS or radio continuum sources, and so we have no information on whether these are associated with star formation regions or with some other type of object. We used the Simbad database to search for all sources within a 3-arcmin radius of the 6.7-GHz maser detected in this survey, but found no convincing associations with other classes of object. To confirm this requires observations toward the new maser detections in other regions of the electromagnetic spectrum, including high-resolution radio images and searches for other maser transitions.
4.1 Associations with IRAS sources
This survey detected 50 6.7-GHz masers, of which 26 have an IRAS source within 1 arcmin. The details of these IRAS sources are summarized in Table 2. The following discussion is confined to only those sources in the region = 325°– 335°, = -053 – 053 (the “survey region”) which we have surveyed completely. However, we include those sources in this region which have velocities outside the range completely surveyed. Where we have calculated the fraction of IRAS sources with an associated 6.7-GHz maser, that figure applies to searches with a sensitivity limit comparable to this survey and is a lower limit for more sensitive searches.
To assess the various IRAS-based selection methods more rigorously, we chose to compare the IRAS sources associated with 6.7-GHz masers with all IRAS sources contained within the survey region. We detected 41 6.7-GHz masers within the survey region, of which 21 are within 1 arcmin of an IRAS source. There are a further 11 6.7-GHz masers separated by between 1 and 2 arcmin from an IRAS source. Of these 11 IRAS sources three also have a maser within 1 arcmin. Many of these IRAS sources have colours typical of ultra-compact Hii regions and a search toward the IRAS position with the 7-arcmin beam of the Hobart telescope would have detected a maser source. For the purposes of our analysis we will assume that all maser sources 2 arcmin or more from an IRAS source are unassociated. For the ranges listed below, the lower limit has been calculated using only the maser sources within 1 arcmin, and the upper limit with all sources 2 arcmin from an IRAS source. A search of the IRAS Point-Source Catalog [IRAS Point-Source Catalog 1985] found 876 sources contained in the survey region. If we assume a uniform distribution of IRAS sources within the survey region, then there is 7 per cent probability of any 6.7-GHz masers being within 1 arcmin of an IRAS source. Thus, for our sample of 41 6.7-GHz masers we would expect three chance associations with IRAS sources.
| Methanol | IRAS | Flux | |||||
|---|---|---|---|---|---|---|---|
| Maser | Name | 12 m | 25 m | 60 m | 100 m | ||
| () | (Jy) | (Jy) | (Jy) | (Jy) | |||
| 15437-5343 | 6 | 75 | 988 | 1425 | 1.10 | 2.22 | |
| 15454-5335 | 4 | 56 | 1153 | 2697 | 1.16 | 2.47 | |
| 15464-5348 | 2 | 10 | 109 | 397 | 0.77 | 1.83 | |
| 15541-5349 | 12 | 111 | 3033 | 6415 | 0.96 | 2.40 | |
| 15520-5234 | 16 | 538 | 10780 | 16380 | 1.54 | 2.84 | |
| 15566-5304 | 6 | 4 | 332 | 1652 | -0.19 | 1.72 | |
| 15573-5307 | 3 | 17 | 124 | 1145 | 0.74 | 1.60 | |
| 15567-5236 | 196 | 1077 | 7398 | 8360 | 0.74 | 1.58 | |
| 15596-5301 | 5 | 52 | 1102 | 2487 | 1.03 | 2.36 | |
| 16076-5134 | 36 | 237 | 2823 | 5930 | 0.82 | 1.89 | |
| 16085-5138 | 41 | 285 | 2262 | 4841 | 0.84 | 1.74 | |
| 16062-5108 | 3 | 2 | 22 | 240 | -0.08 | 0.95 | |
| 16084-5127 | 2 | 9 | 179 | 225 | 0.72 | 2.02 | |
| 16086-5119 | 15 | 161 | 1229 | 25800 | 1.03 | 1.91 | |
| 16124-5110 | 119 | 290 | 6234 | 8651 | 0.39 | 1.72 | |
| 16119-5048 | 11 | 108 | 926 | 2605 | 1.01 | 1.94 | |
| 16175-5046 | 6 | 26 | 539 | 2194 | 0.68 | 1.99 | |
| 16175-5045 | 7 | 31 | 562 | 1820 | 0.65 | 1.90 | |
| 16172-5028 | 144 | 1514 | 12380 | 26700 | 1.02 | 1.93 | |
| 16172-5028 | 144 | 1514 | 12380 | 26700 | 1.02 | 1.93 | |
| 16159-5012 | 4 | 41 | 817 | 3569 | 0.98 | 2.28 | |
| 16157-4957 | 5 | 39 | 256 | 3691 | 0.94 | 1.76 | |
| 16175-5002 | 11 | 77 | 1135 | 3210 | 0.87 | 2.03 | |
| 16196-5005 | 3 | 22 | 306 | 1120 | 0.81 | 1.95 | |
| 16194-4941 | 9 | 20 | 207 | 555 | 0.33 | 1.35 | |
| 16220-4906 | 4 | 3 | 76 | 304 | -0.09 | 1.31 |
Fig. 9 shows a plot of 60/12 m versus 25/12 m colours for all 876 IRAS sources in our survey region. Those associated with 6.7-GHz masers are marked with a filled circle. Sixteen of the sources associated with masers lie in the upper right corner of this colour–colour diagram. Wood & Churchwell [Wood & Churchwell 1989] have shown that there is a high probability that the sources in this area of the colour–colour diagram are ultra-compact Hii regions (UCHii regions). In total there are 120 IRAS sources in our sample which satisfy the criteria of & (the solid lines in Fig. 9). We will call these criteria the Wood & Churchwell minus (WC-) criteria (as they are less stringent than the full Wood & Churchwell criteria). For each flux density measurement the IRAS catalog contains a quality flag in each wavelength band. Having selected sources according to the WC- criteria, Wood & Churchwell then excluded those for which either the 25- or 60-m flux density measurement is only an upper limit, as they are most likely to be situated lower and further left in the colour–colour diagram than their current position. We call these criteria the WC criteria.
Assuming that the IRAS sources selected using WC- are uniformly distributed throughout the survey region, the probability of detecting a 6.7-GHz maser within 1 arcmin is 1 per cent. Thus, for our sample of 41 6.7-GHz masers, we would expect 0.4 chance associations with an IRAS source in the Wood & Churchwell region of the colour–colour diagram. Of the 120 sources which satisfy the WC- criteria, 16 are within 1 arcmin and 19 within 2 arcmin of a 6.7-GHz maser. If we assume that there are no chance associations, then this implies that any search based on these criteria will detect 6.7-GHz masers associated with 13–16 per cent of the selected IRAS sources.
If we apply the WC criteria, we are left with 74 sources, 14 of which are within 1 arcmin and 17 within 2 arcmin of a 6.7-GHz maser source. If we again assume no chance associations, this implies that 19–23 per cent of the IRAS sources selected using these criteria will have an associated 6.7-GHz maser.

The only published search for 6.7-GHz masers toward IRAS sources, used selection criteria based on that of Wood & Churchwell [Wood & Churchwell 1989], but with varying lower limits on the 60- and 100-m fluxes (SWGM). If we apply their selection criteria to our sample we find 31 sources which satisfy their criteria, 10 of which are within 1 arcmin and 13 within 2 arcmin of a 6.7-GHz maser. Thus, for a sample of IRAS sources selected using SWGM’s criteria, we would expect 32–42 per cent to have an associated 6.7–GHz maser. The other sources which lie inside the Wood & Churchwell UCHii region of the colour–colour diagram fail one or more of the flux density or flux quality criteria. The distribution of the Galactic latitudes at which SWGM detected new 6.7-GHz masers is relatively flat for 1.0°. This implies that IRAS colour-based selection criteria may be the most practical for finding sources which are not close to the Galactic Plane.
Hughes & MacLeod [Hughes & MacLeod 1989], developed an independent method of identifying Hii regions on the basis of their IRAS colours, which they claim has a confidence level of 89 per cent. Their criteria were that , , Jy and that the flux quality flag for the 25-, 60- and 100-m bands was not an upper limit. We call these criteria the HM criteria. Of the 876 IRAS sources in the “survey region”, 69 meet the HM criteria ; 11 of these 69 IRAS sources are within 1 arcmin and 15 within 2 arcmin of a 6.7-GHz maser. If we assume that there are no chance associations, this implies that 16–22 per cent of the IRAS sources selected using the HM criteria will have an associated 6.7-GHz maser.
756 IRAS sources are outside the UCHii region of the colour–colour diagram. Of these 5 are within 1 arcmin of a 6.7-GHz maser (compared to the 3 expected by chance alone). Therefore only 1 per cent of IRAS sources in this region of the colour–colour diagram have an associated 6.7-GHz maser.
On the basis of their IRAS colours Palla et al. [Palla et al. 1991] conducted a search for masers toward a selection of IRAS sources, identified as candidate UCHii regions or dense molecular clouds. They separated their detections into two groups, those which satisfied the WC criteria and those which did not. This latter group they labeled “low”. Although the 5 IRAS sources with associated 6.7-GHz masers which fail the WC criteria occupy a similar region of the colour–colour diagram to the “low” sample of Palla et al. [Palla et al. 1991], they differ in other ways. In particular, Palla et al. found that the masers associated with IRAS sources outside the Wood & Churchwell region of the colour–colour diagram were in general weaker than those inside. In contrast, we find that both the median and mean of the peak flux densities is greater for those sources outside the Wood & Churchwell region than those inside. However, the outside sample is small and the mean in particular is dominated by the flux density of 329.03-0.21. We have shown above that we expect 3 chance associations of 6.7-GHz masers with IRAS sources within 1 arcmin, and there is a 15.6 per cent probability of 5 or more chance associations from 41 sources. We therefore consider it likely that these associations are due to chance, although further observations are required to confirm this.
Fig. 10 and Table 3 compare the distribution of 100-m flux density (excluding those sources which have only an upper limit for the 100-m flux density) of the IRAS sources with associated 6.7-GHz masers, with that of the IRAS sources in the region. The probability of maser association clearly increases rapidly with increasing 100-m flux. In the “survey region” 132 IRAS sources have a 100-m flux density of 1000 Jy, of which 3 are within 1 arcmin and 4 within 2 arcmin of a 6.7-GHz maser. By comparison, of the 42 IRAS sources with a 100-m flux density 1000 Jy, 11 are within 1 arcmin and 14 within 2 arcmin of a 6.7-GHz maser. This implies that the probability of detecting a 6.7-GHz maser associated with an IRAS source is 2 per cent if the source has a 100-m flux density 1000 Jy, but 26–33 per cent if the source has a 100-m flux density 1000 Jy. There is quite a large degree of overlap between the & sample and the sample of sources with a 100-m flux density 1000 Jy. Taking the union of the two samples yields 17 IRAS sources within 1 arcmin, and 21 within 2 arcmin of a 6.7-GHz maser, from a sample 127 IRAS sources. Thus there is a 13–17 per cent probability that an IRAS source, selected using these criteria, is associated with a 6.7-GHz maser.
| Log10(S100) | Number of | Number of |
|---|---|---|
| IRAS | 6.7-GHz | |
| sources | masers | |
| 1.0–1.5 | 0 | 0 |
| 1.5–2.0 | 11 | 0 |
| 2.0–2.5 | 69 | 1 |
| 2.5–3.0 | 52 | 2 |
| 3.0–3.5 | 22 | 4 |
| 3.5–4.0 | 12 | 5 |
| 4.0–4.5 | 7 | 2 |
| 4.5–5.0 | 1 | 0 |

4.2 Efficiency of IRAS–based searches
Some of the searches towards sources selected from the IRAS Point-Source Catalog [IRAS Point-Source Catalog 1985] detected 6.7-GHz masers associated with a large fraction of those sources. On the other hand, this does not necessarily imply that they detected a large fraction of the maser sources within a given region. This survey represents the first opportunity to examine the overall efficiency of the various IRAS search techniques, as we are able to determine the fraction of 6.7-GHz maser sources which would be detected by any particular search method. Of the 41 6.7-GHz masers in the region we have surveyed, 9 have no IRAS counterpart within 2 arcmin of the IRAS position. We have indicated above that we expect 3 chance positional associations between IRAS sources and our sample of 6.7-GHz masers. In general these chance associations cannot be detected by any criteria which exclude most of the IRAS sources. This implies that any IRAS-based selection criteria will not detect more than 71 per cent of the masers in any given region. Three of the IRAS sources (15566-5304, 16159-5012 & 16172-5028) are within 2 arcmin of two 6.7-GHz masers. This means that the number of 6.7-GHz masers detected by any given IRAS selection criterion which includes any of these sources, will be slightly greater than the number of IRAS sources with an associated 6.7-GHz maser.
The WC- criteria detect 16–21 (39–51 per cent) of the 41 6.7-GHz masers in the “survey region”, whereas the WC criteria detect only 14–19 (34–46 per cent). The SWGM criteria yield the largest fraction of IRAS sources with an associated 6.7-GHz maser, but still detect only 10–15 (24–37 per cent) of the maser sources within the region. Interestingly the HM criteria yielded results slightly worse than the WC criteria, detecting less of the 6.7-GHz masers 11–17 (27–42 per cent) and selecting a lower percentage of IRAS sources with an associated maser. The selection criterion that the 100-m flux density of the IRAS source should exceed 1000 Jy also detected 11–17 (27–42 per cent) of the 6.7-GHz masers in the region. The final selection criteria we evaluated were the union of the 100-m and WC- criteria. A search for 6.7-GHz masers towards this sample of IRAS sources would detect 17–24 (41–59 per cent) of the masers in the region.
The efficiency of the various IRAS-based searching methods, both in terms of the fraction of IRAS sources with an associated 6.7-GHz maser and the fraction of masers detected is summarized in Table 4. It is clear that for the various IRAS selection criteria there is a compromise between the fraction of IRAS sources with associated 6.7-GHz masers and the fraction of the total masers which are detected. Our analysis shows that searching toward IRAS sources with a 100-m flux density greater than 1000 Jy is more efficient than the WC- criteria in terms of the fraction of IRAS sources associated with 6.7-GHz masers, but detects a smaller fraction of 6.7-GHz masers. A possible explanation for this is that because ultra-compact Hii regions are some of the brightest objects in the IRAS Point-Source Catalog and their flux density peaks near 100 m, many IRAS sources with a large 100-m flux density are likely to be UCHii regions. The WC- criteria are likely to select a larger fraction of all UCHii regions in the Galaxy, as they are based upon spectral properties which do not change with distance. This means that the WC- criteria are likely to detect a larger fraction of the 6.7-GHz masers.
| IRAS selection | No. of IRAS | No. of | Fraction of IRAS | Fraction of the 41 |
|---|---|---|---|---|
| method | candidates | methanol | sources yielding | known masers |
| sources found | a detection | detected | ||
| WC- | 120 | 16–21 | 13–16% | 39–51% |
| WC | 74 | 14–19 | 19–23% | 34–46% |
| SWGM | 31 | 10–15 | 32–42% | 24–37% |
| HM | 69 | 11–17 | 16–22% | 27–42% |
| 1000 Jy | 42 | 11–17 | 26–33% | 27–42% |
| Union of WC- & 1000 Jy | 127 | 17–24 | 13–17% | 41–59% |
Although the IRAS-based selection criteria have been used to detect ultra-compact Hii regions and masers, the large beamwidth of IRAS, and the high degree of confusion in these fields, means that an IRAS beam will typically contain several stars in various stages of formation. Therefore we cannot rule out the possibility that these criteria simply select active star formation regions containing UCHii regions. In this case, the IRAS position quoted may be severely confused, and not a good guide to the positions of the UCHii regions.
4.3 Implications of the number of UCHii regions in the Galaxy
This survey has shown that a significant fraction of 6.7-GHz masers cannot be detected using any IRAS-based selection criterion. Whether these masers are associated with UCHii regions has yet to be determined. If they are, they may provide a method of estimating the total number of UCHii regions in the Galaxy. Wood & Churchwell [Wood & Churchwell 1989] found 1717 IRAS sources which satisfied the criteria & and had moderate or better quality flux density measurements at 25 and 60 m. They argue that the majority of these sources are UCHii regions. Of the 41 6.7-GHz masers in the region we surveyed completely, 19 at most are associated with IRAS sources which meet these criteria. If we assume that all 6.7-GHz masers are associated with UCHii regions, and that the fraction of UCHii regions which have associated 6.7-GHz maser emission is the same for those which satisfy the WC- criteria as those which do not, then this implies that the number of UCHii regions in the Galaxy is more than a factor of 2 greater than that estimated by Wood & Churchwell. High-resolution continuum observations have failed to detect radio continuum emission associated with several 6.7-GHz masers [Ellingsen, Norris & McCulloch 1995] which may indicate that some masers are not associated with OB star formation (and hence UCHii regions). Alternatively, these masers may be associated with UCHii regions which were too weak to detect, either because they are very young or they are associated with a star an early B-type star. Our observations are consistent with an estimate of more than 3000 UCHii regions in the Galaxy, although the true number may be less, depending on the validity of our assumptions.
5 Conclusion
The results of this present work, while not being sufficiently large to determine parameters pertaining to the entire Galaxy, highlight a number of interesting phenomena. They show that many 6.7-GHz masers are not associated with sources in the IRAS Point-Source Catalog, and some may be associated with sources that have colours atypical of UCHii regions. This may be because of the large number of sources near the Galactic Plane, which can confuse the IRAS flux density measurements and cause some sources to be excluded. We will continue to investigate these sources to determine whether they belong to a separate population. If these masers are associated with UCHii regions, this will allow us to improve on previous estimates of the number of such objects in the Galaxy [Wood & Churchwell 1989]. We have also shown that most of the IRAS-based searches will detect less than 50 per cent of the 6.7-GHz maser sources.
Acknowledgments
We are grateful to Phil Button and Tino Delbourgo for their work on the digital autocorrelation spectrometer used for these observations, to Gordon Gowland and Phil Jenkins for assisting with some of the observing, and to Jim Caswell for useful discussions in planning the survey. This research has made use of the Simbad database, operated at CDS, Strasbourg, France.
References
- [Batchelor et al. 1980] Batchelor R. A., Caswell J. L., Goss W. M., Haynes R. F., Knowles S. H., Wellington K. J., 1980, Aust. J. Phys., 33, 139
- [Batrla et al. 1987] Batrla W., Mathews H. E., Menten K. M., Walmsley C. M., 1987, Nat., 326, 49
- [Braz & Sivagnanam 1987] Braz M. A., Sivagnanam P., 1987, A&A, 181, 19
- [Caswell et al. 1980] Caswell J. L., Haynes R. F., Goss W.M., 1980, Aust. J. Phys., 33, 639
- [Caswell et al. 1993] Caswell J. L., Gardner F. F., Norris R. P., Wellington K. J., McCutcheon W. H., Peng R. S., 1993, MNRAS, 260, 425
- [Caswell et al. 1995a] Caswell J. L., Vaile R. A., Ellingsen S. P., Whiteoak J. B., Norris R. P., 1995a, MNRAS, 272, 96
- [Caswell et al. 1995b] Caswell J.L., Vaile R. A., Ellingsen S. P., 1995b, Publ. Astron. Soc. Aust., 12, 37
- [Caswell et al. 1995c] Caswell J. L., Vaile R. A., Ellingsen S. P., Norris, R. P., 1995c, MNRAS, 274, 1126
- [Cohen, Baart & Jonas 1988] Cohen R. J., Baart E. E., Jonas J. L., 1988, MNRAS, 231, 205
- [Cragg et al. 1992] Cragg D. M., Johns K. P., Godfrey P. D., Brown R. D., 1992, MNRAS, 259, 203
- [Ellingsen, Norris & McCulloch 1995] Ellingsen S. P., Norris, R. P., McCulloch, P. M., 1995, MNRAS, in press
- [Gaylard & MacLeod 1993] Gaylard M. J., MacLeod G. C., 1993, MNRAS, 262, 43
- [Haynes et al. 1978] Haynes R. F., Caswell J. L., Simons L. W. J., 1978, Aust. J. Phys. Suppl., 45, 1
- [Hughes & MacLeod 1989] Hughes V. A., MacLeod, G. C., 1989, AJ, 97, 786
- [IRAS Point-Source Catalog 1985] IRAS Point-Source Catalog, 1985, IRAS Science Working Group, U.S. Government Printing Office, Washington D.C.
- [Kaufmann et al.1976] Kaufmann P. et al., 1976, Nat, 260, 306
- [MacLeod & Gaylard 1992] MacLeod G. C., Gaylard M. J., 1992, MNRAS, 256, 519
- [MacLeod, Gaylard & Nicolson 1992] MacLeod G. C., Gaylard M. J., Nicolson G. D., 1992, MNRAS, 254, 1p
- [MacLeod et al. 1993] MacLeod G. C., Gaylard M. J., Kemball A. J., 1993, MNRAS, 262, 343
- [Menten 1991] Menten K. M., 1991, ApJ, 380, L75
- [Menten 1993] Menten K. M., 1993, in Clegg A. W., Nedoluha G. E., eds, Lecture Notes in Physics Vol 412, Astrophysical Masers. Springer–Verlag, Berlin, p. 199
- [Norris et al. 1987] Norris R. P., Caswell J. L., Gardner F. F., Wellington K. J., 1987, ApJ, 321, L159
- [Norris et al. 1988] Norris R. P., McCutcheon W. H., Caswell J. L., Wellington K. J., Reynolds J. E., Peng R. S., Kesteven M. J., 1988, Nat, 335, 149
- [Norris et al. 1993] Norris R. P., Whiteoak J. B., Caswell J. L., Wieringa M. H., Gough R. G., 1993, ApJ, 412, 222
- [Palla et al. 1991] Palla F., Brand J., Cesaroni R., Comoretto G., Felli M., 1991, A&A, 246, 249
- [Peng & Whiteoak 1992] Peng R. S., Whiteoak J. B., 1992, MNRAS, 254, 301
- [Schutte et al. 1993] Schutte A. J., van der Walt D. J., Gaylard M. J., MacLeod G. C., 1993, MNRAS, 261, 783
- [Slysh et al. 1994] Slysh V. I., Kalenskii S. V., Val’tts I. E., Otrupcek R., 1994, MNRAS, 268, 464
- [Smits 1994] Smits D. P., 1994, MNRAS, 269, 11p
- [Wood & Churchwell 1989] Wood D. O. S., Churchwell E., 1989, ApJ, 340, 265