The CNO Isotopes: Deep Circulation in Red Giants and First and Second Dredge-up
Abstract
It is demonstrated that deep circulation mixing below the base of the standard convective envelope, and the consequent “cool bottom processing” (CBP) of the CNO isotopes, can reproduce the trend with stellar mass of the observations in low mass red giants. (This trend is opposite to what is expected from standard first dredge-up.) Our models assume that extra mixing always reaches to the same distance in temperature from the H-burning shell, and that CBP begins when the H-burning shell erases the molecular weight discontinuity (“-barrier”) established by first dredge-up. For Population I stars, none of the other CNO isotopes except are expected to be altered by CBP. (If depletion occurs on the AGB, as some observations suggest, it would require that extra mixing reach closer to the H-burning shell on the AGB than on the RGB — and should also result in a much lower ratio than is observed in the relevant AGB stars.)
CBP increases dramatically as one reduces the stellar mass or metallicity — roughly as on the RGB, due to the longer RGB of low mass stars, and roughly as , due to the higher H-shell burning temperatures of low metallicity stars. In low mass Population II stars, all the CNO isotopes are expected to be significantly altered by CBP. Field Population II stars exhibit RGB abundances consistent with the predictions of our CBP models that have been normalized to reproduce the Population I RGB abundances. On the other hand, globular cluster stars are observed to encounter much more extensive processing; additionally, CBP is observed to start near the base of the globular cluster RGB (overcoming any “-barrier”).
For the CNO isotopes , , , , , and , we also present self-consistent calculations of the consequences of both first and second dredge-up, i.e., of standard convection during the RGB and AGB stages, over a wide range of stellar masses (0.8 to ) and metallicities ( to 0.0001). We demonstrate that the common low and intermediate mass stars are a prime source of , , and in the universe.
The light elements (, , , , , and ) are discussed in Sackmann & Boothroyd (1998a).
1 Introduction
As a star approaches the red giant branch (RGB), its convective envelope deepens, eventually dredging up products of main sequence nucleosynthesis (first dredge-up). As the star ascends the RGB, the convective envelope first continues to deepen, and then retreats; the point of deepest convection marks the end of first dredge-up. Deepest first dredge-up leaves behind a sharp composition discontinuity. For low mass stars (), the hydrogen burning shell catches up to and erases this discontinuity while the star is still on the RGB; for higher masses (), the star leaves the RGB before this can take place. After the completion of core helium burning, the star ascends the asymptotic giant branch (AGB), and the convective envelope deepens again. For low mass stars, this is of little consequence, as it does not reach as deep as first dredge-up; however, for the higher mass stars ( for stars of solar metallicity), it reaches deeper than the layers mixed by first dredge-up, bringing more nucleosynthesized material to the surface (second dredge-up).
In the last decade, a wealth of new observations has become available for the CNO abundances in the envelopes of RGB stars (for Population I, see, e.g., Harris, Lambert, & Smith 1988; Gilroy 1989; Gilroy & Brown 1991; Charbonnel 1994; Charbonnel, Brown, & Wallerstein 1998, and references therein; for Population II, see, e.g., Carbon et al. 1982; Trefzger et al. 1983; Langer et al. 1986; Sneden, Pilachowski, & VandenBerg 1986; Suntzeff & Smith 1991; Kraft et al. 1993, 1995, 1997; Pilachowski et al. 1993, 1997; Sneden et al. 1994, 1997; Shetrone 1996a,b; Smith et al. 1996, 1997; and references therein). Several puzzles arose in interpreting these observations. For low mass Population I stars, many of the observed ratios were in conflict with the considerably higher values predicted by standard stellar evolution and nucleosynthesis theory. For globular clusters (i.e., low mass Population II stars), the observed order of magnitude decline in C/Fe on the RGB was in conflict with theory, which predicted an almost negligible decline (see, e.g., Smith & Tout 1992). An analogous puzzle has arisen from observations of oxygen isotope ratios in AGB stars (see, e.g., Harris et al. 1987, and references therein), and been accentuated recently by new high-precision measurements of oxygen isotopic ratios in meteoritic grains which were formed in circumstellar envelopes, and are believed to have originated in RGB and AGB stars (Huss et al. 1994; Nittler et al. 1994, 1997). Some of the observed abundances are much smaller than can be understood in terms of standard stellar evolution theory.
It has been suggested that the above conflicts might all be resolved if low mass stars experienced some form of extra deep mixing, below the conventional convective envelope (see, e.g., Dearborn, Eggleton, & Schramm 1976; Sweigart & Mengel 1979; Smith & Tout 1992; Charbonnel 1994, 1995; Boothroyd, Sackmann, & Wasserburg 1995, hereafter BSW95; Denissenkov & Weiss 1996). This extra mixing would take material from the convective envelope, transport it down to regions hot enough for some nuclear processing (in the outer wing of the H-burning shell), and then transport it back up to the convective envelope; BSW95 referred to this as “cool bottom processing” (CBP). Gilroy & Brown (1991), Charbonnel (1994), and Charbonnel et. al (1998) demonstrated that the conflict between RGB observations of Population I stars and standard theoretical predictions did not arise until after deepest first dredge-up. As discussed in § 3 below, the situation appears to be the same for field Population II stars, although probably not for globular cluster stars. Thus one needs a clear understanding of first dredge-up, before one can understand CBP.
Many first dredge-up calculations have dealt only with solar metallicities, i.e., Population I stars (e.g., Iben 1965, 1966a,b, 1967; Dearborn, Tinsley, & Schramm 1978; Becker & Cox 1982; VandenBerg & Smith 1988; Landré et al. 1990, hereafter La90; Dearborn 1992; Bressan et al. 1993; El Eid 1994; Boothroyd, Sackmann, & Wasserburg 1994, hereafter BSW94), and most investigators have ignored second dredge-up. There are some exceptions. The early work of Becker & Iben (1979) reported both first and second dredge-up abundances of , , , , and for , 0.01, 0.02, and 0.03, but only for stellar masses . Sweigart, Greggio, & Renzini (1989) reported first dredge-up abundances of , , , , C/N, and for , 0.01, and 0.04, but only for masses from to (for masses up to , they report RGB abundances prior to the completion of first dredge-up). The Geneva group (Schaller et al. 1992; Schaerer et al. 1993a,b; Charbonnel et al. 1993, 1996; Meynet et al. 1994) reported first dredge-up abundances (and also early-AGB abundances, prior to the completion of second dredge-up) of , , , , , , , and for , 0.004, 0.008, 0.02, and 0.04 for masses between 0.9 and — unfortunately, they provided abundance mass fractions only to six decimal places, insufficient for obtaining accurate isotope ratios at low metallicity (at worst, for , and abundances were typically reported as “0.000000” or “0.000001”). Note however that the first dredge-up values of and C/N for these models were reported by Charbonnel (1994).
Since many observations deal with field Population II stars and globular clusters, and with Magellanic Cloud stars (of intermediate metallicity), we have carried out first and second dredge-up calculations of the CNO isotopes for a wide range of metallicities. Note that the second dredge-up models were standard ones; they do not take into account any effects that extra mixing might have had in earlier stages of evolution in low mass stars.
Wasserburg, Boothroyd, & Sackmann (1995, hereafter WBS95) computed parametric models of CBP in solar-metallicity stars, which suggested that the puzzle on the RGB and the puzzle on the AGB might both be resolved. Charbonnel (1995) and Denissenkov & Weiss (1996) used a diffusive mixing algorithm to compute CBP models of certain isotopes in low-mass Population II stars; the results presented in this paper in general agree with theirs. In the present paper, we use the results of computations similar to those of WBS95 to estimate how CBP would alter the first dredge-up CNO abundances, and present a simple estimate of the relative strength of CBP as a function of stellar mass and metallicity. Similar results for the light elements , , , , , and are presented in Sackmann & Boothroyd (1998a).
For the CNO isotopes, we have computed estimates of the enrichment of the interstellar medium from first and second dredge-up and CBP in stars of near-solar metallicity, relative to the enrichment resulting from supernovae.
2 Methods
We considered stars of 38 different masses from 0.8 to , evolving them self-consistently from the pre-main sequence through first and second dredge-up until the first helium shell flash (for low and intermediate mass stars), or to the point where the program failed due to core carbon ignition during second dredge-up (for higher masses). Note that, in low mass stars, we use “second dredge-up” to indicate the deepest penetration of the convective envelope on the early AGB — this is a modification of the standard terminology, in which one would say that second dredge-up did not occur if the convective envelope reached less deep on the AGB than on the RGB (as is the case in low mass stars). For evolutionary program details, see Boothroyd & Sackmann (1988), Sackmann, Boothroyd, & Fowler (1990), and Sackmann, Boothroyd, & Kraemer (1993). Note that the rezoning algorithm has been refined to track the composition profiles more accurately. This caused only minor changes in our results, the largest change being in the ratio produced by first dredge-up: in WBS95, our values for this ratio lay near the bottom of the range of theoretical calculations by various investigators (as shown in Fig. 1 of WBS95), but with the refined rezoning our values lie near the middle of this “theoretical range” (as may be seen from Fig. 3 below).
Cool bottom processing (CBP) was computed as follows (in a manner similar to WBS95). The envelope structure was taken from a full stellar model, upon which was superimposed extra mixing (using a “conveyor-belt” circulation model). We assumed that the extra mixing reached down into the outer wing of the H-burning shell; the temperature difference between the bottom of mixing and the bottom of the H-burning shell was considered a free parameter, to be determined by comparison with the observations. It was assumed that the value of remained constant during the evolution up the RGB. The changes in the envelope structure were followed as the star ascended the RGB (“evolving RGB” CBP models, unlike the “single episode” CBP models of WBS95, where it was assumed that the envelope structure was constant in time). Envelope structures from full stellar models of mass were used, for , 0.007, 0.001, and 0.0001. Higher stellar masses were considered by simply adding more mass to the convective envelope, and changing to the appropriate first dredge-up abundances and RGB starting point; this should be a good approximation for the RGB stars we considered, namely, those with masses small enough to have degenerate helium cores (and thus a long RGB). We assumed that CBP began at the point on the RGB where the hydrogen shell reached (and erased) the the molecular weight discontinuity (“-barrier”) that was created at the point of deepest first dredge-up (Charbonnel 1994). As in WBS95, the free parameter was determined by matching the observed / ratios for the six post-RGB stars in M67, which has solar metallicity, and a main sequence turn-off mass of (in general we ignored the difference between the turn-off mass and the initial mass of RGB stars in a cluster — in M67, where it is largest, this difference should still be ). The observed / ratios in M67 range from 11 to 16 (Gilroy 1989; Gilroy & Brown 1991), comparable to observational error; if this scatter were real, it would correspond to a range in our “evolving RGB” CBP models. The mean observed ratio of 13 corresponds to a value of , which was the value we used in the CBP calculations reported in § 3. Note that this is shallower extra mixing than was used in our earlier “single episode” models of CBP on the RGB (WBS95), which used ; these “single episode” CBP models yield the observed / ratios after a mixing episode lasting yr on the lower RGB, while the “evolving RGB” CBP models of the present work do not attain the observed ratios until the tip of the RGB. The tight constraint on in our models is due to the strong temperature dependence of the CNO burning rates — a change in of only 0.01 results in a change of % in the amount of CNO processing. For the evolutionary stages considered here, with thin H-burning shells, parameterizing the effective depth of extra mixing by a constant value is roughly equivalent to assuming that extra mixing always reaches down to the point with the same molecular weight gradient (see also Charbonnel et. al 1998).
We used the OPAL 1995 interior opacities (Iglesias & Rogers 1996), with Alexander molecular opacities (Alexander & Ferguson 1994; Tout 1997) at low temperatures; these latter require a value of (where is the ratio of the convective mixing length to the pressure scale height) to obtain a correct solar model (Sackmann et al. 1990, 1993). Tests were also made using older opacity tables. Interior opacities from the Los Alamos Opacity Library (LAOL: from Keady [1985]) yielded only slightly different amounts of dredge-up (see § 3), while molecular opacities from Sharp (1992) or from Keady (1985) required a value of but had no effect on dredge-up. (Varying alone has almost no effect on the depth of dredge-up, as has already been noted by Charbonnel [1994]).
| interior | mass fractions | number ratios | |||||||
|---|---|---|---|---|---|---|---|---|---|
| Z | [Fe/H] | opacities | |||||||
| 0.02aa “Evolving RGB” CBP runs were performed for these metallicities. | OPAL, LAOL | 0.280 | 0.1733 | 0.0532 | 0.4823 | 90 | 2660 | 500 | |
| LAOL | 0.280 | 0.2179 | 0.0531 | 0.4816 | 90 | 2660 | 500 | ||
| 0.012 | OPAL | 0.264 | 0.1329 | 0.0408 | 0.5617 | 180 | 5307 | 998 | |
| LAOL | 0.264 | 0.1817 | 0.0443 | 0.5675 | 180 | 5307 | 998 | ||
| 0.007aa “Evolving RGB” CBP runs were performed for these metallicities. | OPAL | 0.254 | 0.0952 | 0.0292 | 0.6360 | 402 | 11885 | 2233 | |
| LAOL | 0.254 | 0.1418 | 0.0345 | 0.6625 | 402 | 11885 | 2233 | ||
| 0.003 | OPAL | 0.245 | 0.0764 | 0.0234 | 0.6728 | 1225 | 44360 | 6806 | |
| LAOL | 0.245 | 0.1067 | 0.0260 | 0.7460 | 1225 | 44360 | 6806 | ||
| 0.001aa “Evolving RGB” CBP runs were performed for these metallicities. | OPAL, LAOL | 0.240 | 0.0764 | 0.0234 | 0.6728 | 3582 | 106000 | 19910 | |
| LAOL | 0.240 | 0.1067 | 0.0260 | 0.7460 | 3582 | 106000 | 19910 | ||
| LAOLbb To give some insight into effects of uncertainties in initial stellar isotope ratios, these cases test the effect (for ) of assuming that some or all of the initial CNO isotope ratios are independent of metallicity. | 0.240 | 0.1067 | 0.0260 | 0.7460 | 90 | 106000 | 19910 | ||
| LAOLbb To give some insight into effects of uncertainties in initial stellar isotope ratios, these cases test the effect (for ) of assuming that some or all of the initial CNO isotope ratios are independent of metallicity. | 0.240 | 0.2179 | 0.0531 | 0.4816 | 90 | 2660 | 500 | ||
| 0.0001aa “Evolving RGB” CBP runs were performed for these metallicities. | OPAL | 0.238 | 0.0764 | 0.0234 | 0.6728 | 35820 | 1060000 | 199100 | |
| LAOL | 0.238 | 0.1067 | 0.0260 | 0.7460 | 35820 | 1060000 | 199100 | ||
We considered a number of metallicities, with initial compositions matching those of the corresponding interior opacity tables in most cases, as shown in Table 1. At solar metallicity (), we used solar system values for the initial carbon and oxygen isotope ratios and a helium mass fraction ; the ratios (by mass) , , and for the OPAL opacity case were those of Grevesse & Noels (1993) (for the LAOL opacity case, these abundances were close to Ross & Aller [1976] or Grevesse [1984]). For lower metallicities, we reduced the helium abundance via and increased the oxygen content, approximating the observed trend by for , and constant for ; observations suggest that [C/Fe] and [N/Fe] are independent of metallicity (see Timmes, Woosley, & Weaver 1995, and references therein). Note that and are not constant, since the variation in [O/Fe] means that is not linearly related to the iron abundance Fe/H. Instead, one obtains
| (1) |
where is the solar metallicity, and is the mass fraction in the Sun of those “-elements” (, , , ) that are enhanced relative to Fe at low metallicity. For the OPAL cases, opacities and compositions were interpolated at constant between standard OPAL tables (with ) and an -enhanced OPAL table (“W95hz”, with , and other -enhancements as specified by Weiss: , , , and — effective ). For the LAOL cases, no -enhanced opacities were available, and was used (see Table 1). The isotopic ratios , , and were assumed to be proportional to Fe/H (Timmes et al. 1995; Timmes 1995), i.e., initial , , and were inversely proportional to Fe/H.
On the RGB and AGB, a Reimers’ (1975) wind mass loss was included (where luminosity , radius , and mass are in solar units and the mass loss rate is in /yr; is the mass loss parameter). The value of is constrained by globular cluster horizontal branch observations, which constrain Population II stars of initial mass to lose between 0.1 and on the RGB, over a metallicity range of 2 orders of magnitude (Renzini 1981; Renzini & Fusi Pecci 1988); thus must be nearly independent of . We chose , yielding for , respectively — these values obey the above globular cluster constraint, for both Alexander and Sharp molecular opacity cases. In no case had a significant fraction of the star’s mass been lost by the time first dredge-up was encountered (or second dredge-up, in intermediate mass stars). Test runs with , or (recommended for intermediate mass stars by Kudritzki & Reimers [1978]), confirmed that the mass loss rate had negligible effect on dredge-up abundances, except for second dredge-up in low mass stars (where CBP on the RGB will in any case have altered the composition in a way that our standard second dredge-up models do not take into account).
Nuclear reaction rates from Caughlan & Fowler (1988; hereafter CF88) were used, except for the the rate, where the rate from CF88 was multiplied by a factor of 1.7, as recommended by Weaver & Woosley (1993), and for the -destruction reactions and , where the rates from Blackmon (1996, hereafter Bl96) were used. The Bl96 rates are based on the cross section measurement of Blackmon et al. (1995); they are somewhat higher than the rates of La90, in that the uncertain factor in the La90 formulae for the rates is increased to a value of in the Bl96 rates. Note that abundances calculated using the Bl96 rates are almost identical to those calculated using the La90 rates (identical below and differing by less than 20% at higher masses, despite the factor of 1.5 difference in the rates in the temperature interval ); both rates thus yield a reasonable fit to the somewhat sparse oxygen isotope observations, as discussed by BSW94 (and references therein). We also tested the effects on second dredge-up of using the rate from CF88 (instead of multiplying it by 1.7), or of using the rate from Caughlan et al. (1985) (which is nearly 3 times larger than that of CF88, i.e., about another 1.7 times larger than the rate we generally used); these changes turned out to have little effect.
3 Results
3.1 Composition Profiles and Depth of Dredge-up


Figure 1 presents the composition profiles of Population I and II stars near the base of the RGB, shortly before first dredge-up. Abundance profiles in stars of higher mass are qualitatively similar, though the peaks and dips in the profiles tend to lie at somewhat larger values of the normalized mass coordinate (a shift similar to that from Fig. 1a to 1b). The abundance changes produced by first dredge-up (presented in § 3.2) can be understood in terms of these profiles. For example, the relative width of the pocket increases somewhat with increased stellar mass in low mass stars, but is almost constant in intermediate mass stars. This explains why first dredge-up enrichment increases as a function of stellar mass for low masses, and then levels off for intermediate masses (the increasing depth of dredge-up with stellar mass is irrelevant, as the entire pocket is dredged up.) As pointed out by Charbonnel (1994), for Population I stars the observed ratios in the luminosity range expected for first dredge-up are in agreement with the theoretical models of first dredge-up (see also § 3.2); the subsequent observed reduction in in low mass stars is not due to further dredge-up, but to cool bottom processing (CBP).

Figure 2 shows the depth in mass of first and second dredge-up, over a wide range of metallicities. For solar metallicity, our depths of first dredge-up agree with those computed by El Eid (1994) and Charbonnel (1994); for , our case agrees with Charbonnel’s, but we find significantly shallower first dredge-up for ( for OPAL opacities or 0.75 for LAOL, as opposed to her value of 0.425, where is the deepest mass layer in the star reached by the convective envelope during dredge-up). This indicates that the depth of first dredge-up in low-metallicity intermediate mass stars is sensitive to the physical inputs of the stellar models (e.g., equation of state, opacities, and nuclear rates) that determine the onset of core helium burning and thus the end of the RGB. Fortunately, such differences are erased by second dredge-up. Second dredge-up in low mass stars is significantly shallower than first dredge-up, and thus would be expected to have negligible effect on their surface composition (though this may not always be true: see § 3.2.2); in intermediate mass stars, where it reaches deeper than first dredge-up, second dredge-up is of key importance. Figure 2 does not show the effect on second dredge-up of using the older LAOL interior opacities (rather than OPAL), but the relative shifts are similar to those of first dredge-up, namely, equivalent to a shift to the next-lower metallicity case for Population I stars, and little or no effect in Population II stars. (The actual shift in the depth of second dredge-up from using the LAOL opacities is thus always small.) Changing the low-temperature molecular opacities, the mixing length parameter , the rate, the CNO fractions relative to , or the mass loss rate had negligible effect on the depth of dredge-up, as noted in § 2.
Note that for our most massive stars (), central carbon ignition takes place during second dredge-up. We report the depth of second dredge-up at the point during this stage when our program failed (see dotted lines in Fig. 2); second dredge-up might reach deeper during subsequent evolution. The chemical compositions reported in this paper for these more massive stars may thus underestimate somewhat the effect of second dredge-up.
3.2 Envelope Isotope Ratios From Dredge-up and CBP
In this section, we discuss the effects of standard first and second dredge-up on the CNO isotopic abundances in stellar envelopes. We also present the results of our “evolving RGB” CBP models (CBP on the RGB only) for the four metallicities where these computations were performed. These CBP models were parametric studies, with a free parameter (giving the location, in temperature, of the bottom of extra mixing, relative to that of the bottom of the H-burning shell), fixed by matching Gilroy’s (1989) average observed ratio in the open cluster M67 (as discussed in § 2). The results are summarized in Tables 2–5; more detailed tables are available from the authors111 Send e-mail to aib@krl.caltech.edu to obtain these tables; also available at A. I. B.’s Web page: http://www.krl.caltech.edu/∼aib/. Note that Lattanzio & Boothroyd (1997) also present figures showing some of the results discussed here (using the older LAOL interior opacities).
3.2.1 Carbon Isotopes

Figure 3 demonstrates that our “evolving RGB” CBP models can account for the observed trend of with stellar mass. The field star observations of Harris & Lambert (1984a,b) and Harris et al. (1988) are also shown, but their stellar mass values are too uncertain (by a factor of ) to be of much use. There is some scatter in Gilroy’s (1989) open cluster observations ( at ); if it reflects a true scatter in the abundances, this would imply a variation of order % in the amount of processing resulting from extra mixing at that mass, corresponding to a depth parameter in the range 0.252 to 0.272 in our “evolving RGB” CBP models ( is the difference in temperature between the bottom of extra mixing and the bottom of the hydrogen shell: see § 2). Note that Charbonnel et al. (1998) obtained a similar depth estimate (using observations in field Population I stars with accurate HIPPARCOS parallaxes); this depth corresponded to a molecular weight gradient in their stellar model, in agreement with the critical -gradient required to explain observed solar lithium and beryllium depletion in the best solar models of Richard et al. (1996) and Richard & Vauclair (1997).
Even for intermediate mass stars, where there is no CBP, there is still some uncertainty in the ratio resulting from first dredge-up. The observations of Gilroy (1989) for stars of masses suggest that the theoretical models shown in Figure 3 may overestimate the amount of in the pocket by %. Note that an uncertainty in the depth of dredge-up cannot have any effect, since the entire pocket is dredged up, but a smaller pocket might possibly result from slight errors in relative rates of nuclear reactions. Another possibility is extra rotational (or diffusional) mixing in the stellar interior on the main sequence, which is not included in standard stellar models; this type of extra mixing is usually invoked to explain main sequence depletion (see, e.g., Vauclair 1988; Pinsonneault et al. 1989).

Figure 4 illustrates the effect on ratios of varying the metallicity and the interior opacities. For the dredge-up curves, the increasing trend with metallicity is due to our assumption of an increasing trend in the initial stellar ratio (see Table 1 and § 2). If one assumes instead that the initial stellar ratio is independent of metallicity (as Charbonnel [1994] did), one finds that the dredge-up curves for (lower light solid and long-dashed curves in Fig. 4b) lie slightly lower than the curves for , in agreement with the results of Charbonnel (1994). Figure 4 also shows the final RGB ratio predicted by our “evolving RGB” CBP models (diamonds); the ratio produced by CBP in Population II RGB stars is expected to approach the CN cycle equilibrium value of , due to their higher H-shell temperatures (see § 3.4).
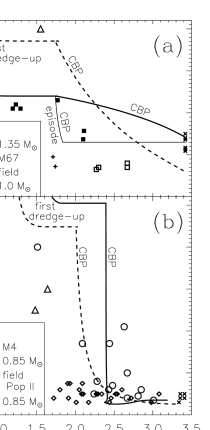

Figure 5 compares the observed and [C/Fe] ratios as a function of RGB luminosity with the results of our “evolving RGB” CBP models of appropriate mass (lines marked “CBP”). In the open cluster M67, RGB stars should have masses of (the turn-off mass being : Gilroy [1989]). Comparing the (sparse!) M67 data (solid symbols in Fig. 5a) with our model (solid line) suggests that CBP does indeed begin at the point where the H-burning shell erases the molecular weight discontinuity (“-barrier”) left behind by first dredge-up, as we had assumed (see § 2), but that CBP begins more strongly than in our “evolving RGB” models and slows down or even stops for luminosities (this is less extreme than our “single episode” CBP case, shown by the light solid line marked “CBP episode” in Fig. 5a). However, the data are too sparse to provide very strong constraints on the strength of CBP as a function of RGB luminosity — one cannot completely rule out even a CBP starting point immediately after first dredge-up (as appears to occur in globular clusters: see below). Since M67 was used to normalize our CBP models, they naturally yield the observed final ratio. The observed field Population I RGB stars (open symbols in Fig. 5a) probably have low masses; their observed sub-solar metallicities (: Charbonnel et al. 1998) suggest an old disk population, and in any case low mass stars are more common than higher mass stars. Our , “evolving RGB” CBP model does yield the observed final ratio, but again the observations suggest CBP begins more strongly and then tails off.
Figure 5b presents ratios in Population II stars. For field Population II stars, our “evolving RGB” CBP models are consistent with the observed ratios, though the data are sparse, and have relatively uncertain luminosities. For the globular cluster M4, the low-luminosity end of the observations suggests that CBP might be occurring slightly earlier than expected, but the data do not extend far enough to be certain. Pilachowski et al. (1997), present observations of in Population II RGB stars as a function of surface gravity, obtaining similar conclusions. They find that the ratio in field Population II stars drops from to at as expected, though the data are again sparse (note deepest first dredge-up in such stars occurs at ); they have no data for low luminosity globular cluster stars (). Field Population II stars are also observed to undergo further depletions of (beyond those expected from first dredge-up) at just the effective temperature where CBP would be expected to begin (Pilachowski et al. 1993; see also Sackmann & Boothroyd 1998a).
The [C/Fe] ratio shown in Figure 5c is more diagnostic, especially for globular cluster stars. The field Population II star observations (with metallicities : Sneden et al. 1986) are consistent with our “evolving RGB” CBP models. However, the higher-metallicity globular cluster M4 () exhibits more carbon depletion at a given luminosity than the field stars (rather than less). Furthermore, the globular clusters exhibit significant carbon depletion on the RGB immediately following (or perhaps even before) deepest first dredge-up on the RGB, long before the H-burning shell could reach the “-barrier” that first dredge-up should create. For M4, the relatively high values of [C/Fe] in most of the post-RGB stars suggests that there may be a “tail-off” in the amount of CBP occurring after a luminosity of is reached on the RGB, similar to that in Population I stars. For the lower-metallicity clusters M92 and M15, the [C/Fe] ratio approaches its CN-cycle equilibrium value near (subsequent CBP could only increase [C/Fe], if was burned to ). Our CBP models find only insignificant burning of , even at the lowest metallicity we considered, but there are in fact globular cluster stars with significant observed O depletions, as discussed below.
Note that Charbonnel (1995) modelled CBP in 0.8 and RGB stars with and 0.0001; as in our Population II models, her reported ratios reached their nuclear equilibrium value shortly after CBP began. Denissenkov & Weiss (1996) also modelled CBP in a , RGB star (assuming that CBP either began near the base of the RGB or shortly after deepest first dredge-up), in an attempt to match the observed trend of depletion with increasing RGB luminosity. Their abundance predictions for , , and are similar to our Population II results; like us, they find no depletion of . These models agree with observations of Population II field stars and of some globular clusters (e.g., M4, 47 Tuc, NGC 3201, NGC 2298, NGC 288), which show no O depletion (see, e.g., Kraft 1994, and references therein). On the other hand, many globular clusters show O depletions on the RGB of as much as an order of magnitude (e.g., M5, M13, M3, M92, M15, M10, NGC 4833, NGC 362: see Kraft [1994]). Our models do not yield these large O depletions, when we normalize by reproducing RGB observations in Population I stars. A change in the normalization, i.e., mixing deeper (to hotter temperatures), can readily produce the observed O depletions, as shown by the higher-temperature models of Denissenkov & Weiss (1996); they found, however, that such models could not simultaneously match the observed trend of carbon on the RGB (too much carbon was destroyed). The calculations of Denissenkov, Weiss, & Wagenhuber (1997) show that the observed O depletions and Al enhancements cannot be obtained from primordial contamination of the intracluster medium. This suggests that there are large star-to-star variations in the depth of extra mixing in globular clusters, probably due to different stellar rotation rates; a similar conclusion follows from the models of Langer, Hoffmann, & Sneden (1993) and Langer & Hoffman (1995). Kraft (1994) discusses evidence that cluster-to-cluster variations are correlated with differences in average angular momentum and rotation rates. Star-to-star variation in the depth of extra mixing is also consistent with the extended horizontal branches of globular clusters, as pointed out by Sweigart (1997) — his models indicated that extra mixing deep enough to account for large O–Na variations could lead to significant conversion of envelope hydrogen into helium, extending the RGB of such stars and thus leading to more mass loss and a bluer subsequent horizontal branch position. Finally, the fact that a “bump” is observed (at the luminosity predicted by standard models) in the RGB luminosity function of many clusters that exhibit abundance anomalies suggests that at least some globular cluster stars do not experience CBP until after the H-burning shell reaches the “-barrier” (stars which experience CBP at an earlier stage would have extra mixing deep enough to smooth out the composition discontinuity, and would not spend extra time at the “bump” luminosity).
3.2.2 Nitrogen and Oxygen Isotopes
Any envelope carbon depletion is accomplished by converting the carbon into nitrogen — the initial C/N ratio (of , for the OPAL composition) is reduced by dredge-up to a value of for stars. Dredge-up in intermediate mass stars yields for and for , while CBP in low-mass Population II stars can reduce carbon to its CN-cycle equilibrium value of . Note that hot bottom burning on the thermally pulsing AGB of intermediate mass stars can also convert carbon into nitrogen, leading to low C/N ratios (see, e.g., Boothroyd et al. 1993). While was not followed explicitly in the present work, first and second dredge-up should yield some depletion in its envelope abundance (somewhat more than that of , which is discussed below). Any star that experiences sufficient CBP to significantly affect the ratio should reduce its envelope abundance to the CN-cycle equilibrium value (namely, ), unless the extra mixing is too slow to process the entire envelope. (Hot bottom burning in intermediate mass AGB stars would likewise destroy .)


Figure 6 illustrates ratios, giving some idea of their uncertainties. Light curves illustrate the effect of using the older LAOL interior opacities, rather than the OPAL opacities (heavy curves). Although this can make a significant difference in the point of core helium ignition, and thus to first dredge-up in intermediate mass stars, the final is less sensitive to the interior opacities, with agreement generally better than 20% between the two cases. The effect of the uncertainty in the reaction rates of Bl96 (from the factor : see § 2) is not shown, as it has no effect for low mass stars and leads to an uncertainty of only % for stars with masses ; use of the older La90 rates would merely lower the curves by % for stars with masses , although the even older (and highly uncertain) CF88 rates would have yielded large uncertainties for intermediate mass stars (see BSW94). The effect of assuming a different initial ratio for the low metallicity cases is not shown either, as it has almost no effect on the part of the graph lying below the chosen initial ratio.
The largest uncertainty in the ratios comes from the fact that dredge-up reaches part-way into a steep “-peak”, and thus a slight difference in the depth of dredge-up can have a significant effect on the amount of that is dredged up (especially in low mass stars). This is illustrated in the panel of Figure 6 by comparing the results of the present work with those of Schaller et al. (1992) (long-dashed curves) and of Dearborn (1992) (triple-dot-dashed curve). Above , use of the La90 rates by Schaller et al. (1992) would lead one to expect their curve to lie % below the curve of the present work, rather than % above it. Dearborn (1992) used the highest allowed rate from the uncertainty range of CF88, but his curve lies twice as far below the curve of the present work as one would expect from the difference in nuclear rates alone (see BSW94). Below , different choices for the rates cannot affect the ratio from first dredge-up. The differences in the predicted ratios in low mass stars must be due to differences in the equation of state, in the way convection and mass zoning are handled, and (in Dearborn’s case) the opacities, between the different stellar evolution codes. The observed ratios are not inconsistent with any of these three theoretical curves, due mainly to the large uncertainty in the observed stellar masses (see Dearborn 1992; El Eid 1994; BSW94).
Significant enhancements of are expected from CBP in low mass Population II stars. Our models suggest that second dredge-up in low mass Population II stars also produces large enhancements (see Fig. 6); however, it is possible that this latter may be a spurious effect, due to numerical diffusion from the large, sharp -peak in the H-burning shell (which must be rezoned frequently as it burns outwards the early AGB of these stars).
First and second dredge-up generally cause a slight reduction (%) in the surface abundance (see, e.g., Dearborn 1992; El Eid 1994; BSW94; Tables 2–5 of the present work), but there is one possible exception. During second dredge-up in stars of , the convective envelope may reach into the outer fringes of the region that was partially mixed by semiconvection during the previous core helium burning stage, and which thus contains significant amounts of (produced via the reaction); a significant amount of enrichment can thus result from second dredge-up in these stars. In low mass Population II stars, CBP can yield large depletions.

Figure 7 compares theoretical oxygen isotope ratios with those observed in stars and in interstellar grains; note that most grains are formed during high-mass-loss episodes in the star’s lifetime, namely, near the tip of the AGB (or, for low mass stars, near the tip of the RGB). Note also that, if the oxygen isotope ratios in the interstellar medium evolve less rapidly than the Fe/H ratio, the low-metallicity theoretical curves would be shifted to the left; if the solar oxygen isotope ratios were not typical of the interstellar medium at solar metallicity, then the theoretical curves would be shifted as a whole.
The post–dredge-up stellar observations of Harris et al. (1988) (open circles in Fig. 7) lie along a roughly vertical band consistent with the theoretical predictions of first dredge-up in stars with initial oxygen isotope ratios very close to the solar values. The four AGB stars with near the CN-cycle equilibrium value (open squares) have oxygen isotope ratios consistent with theoretical predictions for intermediate mass stars undergoing hot bottom burning (note that three of these four stars have only an upper limit on ). However, the other AGB stars (crosses) tend to lie along a band from lower left to upper right, suggesting that low mass AGB stars may experience depletion. Grain data (filled circles) are more precise than stellar data. While many of the grain data are consistent with dredge-up in stars of near-solar metallicity, roughly a dozen grains show depletion by factors , and several of of these have abundances a factor of 2 lower than would be expected in intermediate mass stars undergoing hot bottom burning. It is possible, as pointed out by WBS95, for CBP on the AGB to account for such depletion. However, it would require stronger CBP (deeper extra mixing) on the AGB than on the RGB (, rather than 0.26). This might be considered unlikely, considering that CBP appears to grow weaker as a star climbs the RGB; however, it is possible that redistribution of angular momentum from a still-rapidly rotating core during the core helium burning stage (when the core has expanded and the envelope contracted subsequent to the RGB, allowing them to couple more strongly) might “regenerate” on the AGB the conditions that led to extra mixing and CBP on the RGB (see, e.g., Cohen & McCarthy 1997; VandenBerg, Larson, & de Propris 1998). A more troubling objection is that CBP strong enough to lead to significant depletion should also yield a ratio near the CN-cycle equilibrium value in spite of any enrichment from third dredge-up ( would be expected, according to WBS95); the relatively large ratios observed in most AGB stars suggest that little or no CBP is occurring there. An episode of strong CBP relatively early on the AGB, followed after extra mixing tailed off by third dredge-up of to increase the ratio to the observed range, cannot be completely ruled out. However, it might be considered surprising that all stars dredged up sufficient to yield large ratios, even the lowest-mass stars (where third dredge-up of is most difficult). Since CBP yielding the observed depletion would destroy only a relatively small fraction of the envelope carbon (WBS95), sufficient third dredge-up to increase from to would also be sufficient to yield — the stars observed by Harris et al. (1988) would thus have to be on the verge of becoming carbon stars. Note that carbon star observations suggest that stars below a cutoff mass of do not experience sufficient third dredge-up to become carbon stars (see, e.g., Claussen et al. 1987; Groenewegen & de Jong 1993; Groenewegen, van den Hoek, & de Jong 1995).
Stochastic variability in convective mixing and/or interstellar medium enrichment might yield variations in abundances from dredge-up, perhaps allowing the strongly -depleted grains to be explained by hot bottom burning (though their distribution in the isotope-isotope plot of Fig. 7 would still be somewhat surprising).
3.3 Mixing Events: Location in the H-R Diagram


For stars of solar metallicity, Figure 8a shows the position on the RGB and AGB where a number of important events take place. One can see that the end of the enrichment phase (diamonds) occurs much earlier on the RGB than the point of deepest dredge-up (squares: where the convective envelope reaches in the furthest). For low mass stars (), both these events take place fairly early on the RGB; subsequently, the convective envelope retreats outwards. The deepest convective penetration leaves behind a large composition discontinuity, which is also a major discontinuity in the mean molecular weight , i.e., a “-barrier”; as discussed in § 1, this is expected act as a barrier to any extra mixing that occurs below the base of the convective envelope. As the hydrogen-burning shell eats its way outwards through the star, it eventually reaches and destroys this -barrier (circles), allowing CBP to begin. For , one sees from Figure 8a that deepest first dredge-up occurs near the tip of the RGB, and the -barrier is not destroyed until later. In these cases, no CBP is expected on the RGB; this is in agreement with the fact that no excess enhancements are observed for (see, e.g., Gilroy 1989; WBS95).
Let us now consider the AGB. In principle, CBP is possible whenever no -barrier exists to prevent it. For stars of , the -barrier created by first dredge-up is destroyed prior to the base of the AGB — such stars might experience CBP on the early AGB. However, the driving mechanism for extra mixing may be weaker or non-existent by that point (as discussed in § 3.2), and in any case hydrogen shell burning is weak on the early AGB of intermediate mass stars (most of the star’s luminosity being supplied by the helium-burning shell), and thus not much CBP is expected. After the onset of the helium shell flashes (thermal pulses), i.e., on the TP-AGB, the hydrogen shell burns strongly again, and second dredge-up has wiped out any -barrier, so CBP might occur (if the driving mechanism for extra mixing is still active). Note however that stars of encounter hot bottom burning on the TP-AGB, wherein the convective envelope actually reaches into hot regions of the hydrogen-burning shell, and nuclear burning creates a “-barrier” just below the base of of convection.
For Population II stars of , Figure 8b presents the position in the H-R diagram of the key mixing events, and one might make an analysis similar to that of Population I stars above, with similar conclusions. As noted in § dredge, this would yield predictions that might be consistent with observations of field Population II stars, but not with globular cluster observations.
3.4 A Simple Estimate of Cool Bottom Processing
It is possible to make a rough estimate of the total amount of CBP, as measured by the amount of processing of CNO isotopes. We must assume that CBP is be independent of the speed (and geometry) of mixing; WBS95 showed that this condition is generally satisfied for the CNO isotopes. If we assume that the inner boundary of deep mixing is at the point where the -gradient becomes non-negligible, in the outer wing of the hydrogen-burning shell, then by definition the rate of hydrogen burning at the inner boundary of deep mixing is proportional the rate of hydrogen burning in the hydrogen-burning shell itself. The latter is given by , where is the envelope hydrogen mass fraction and is the mass of the hydrogen-exhausted core; since does not vary much, we can say that the rate of hydrogen burning is proportional to . The mass of CNO elements processed in the CBP region is proportional to the mass of hydrogen burned there, which in turn is proportional to — low metallicity stars must burn hotter to burn the same amount of hydrogen via the CNO-cycle, and thus experience more extensive CBP. The rate of change in the CNO isotope ratios is proportional to the mass rate of CNO processing divided by the mass of CNO in the envelope, and thus to . Generally, and do not vary much as a function of time. If we assume that the extra mixing does not “tail off” as the star climbs the RGB, then we can estimate that the total change in the envelope CNO isotope ratios due to CBP is proportional to . While this last assumption is somewhat dubious, since extra mixing does appear to “tail off” (see § 3.2.1), the above formula probably provides a reasonable estimate on the RGB, except for globular cluster stars (as shown by the extent to which our “evolving RGB” CBP models fit the final observed isotope ratios).

Figure 9 displays the value of this CBP estimate as a function of the stellar mass for three stages of evolution: the upper RGB (solid), the early AGB (dashed), and the TP-AGB (dotted, using the Population I initial-final mass relation of Weidemann [1984]). Initial-final mass relations for Population II stars are too uncertain to be useful for estimates of the importance of CBP on the TP-AGB of such stars. We assumed that early AGB processing did not start until core helium exhaustion, which happens when the star is near the base of the AGB. The AGB cases will of course be overestimates (upper limits), if the driving mechanism for the extra mixing has at least partially died away prior to the AGB, as seems likely.
3.5 Interstellar Medium Enrichment
For stars of , most of the mass loss takes place near the tip of the RGB; most of the CBP encountered on the RGB takes place before much envelope mass is lost. For stars of , most of the mass loss takes place even later, during the thermally-pulsing AGB (Boothroyd & Sackmann 1988; Sackmann et al. 1993; Boothroyd, Sackmann, & Ahern 1993); for stars of solar metallicity, Figure 9 shows that even the upper limit on AGB CBP is expected to be relatively minor. A full chemical evolution model, making use of time delay between star formation and mass loss on the RGB or AGB as well as of star formation rates as a function of time and effects of changing metallicity, is beyond the scope of this paper; we will make a rough estimate of interstellar medium enrichment, by considering only solar metallicity, and considering all stars of mass (where the time delay until envelope mass loss does not exceed the age of the galactic disk).
As shown § 3.2, first and second dredge-up result in large enhancements of , , and in stellar envelopes, much of which will subsequently be injected into the interstellar medium via mass loss, unless subsequent nucleosynthetic events modify the envelope abundances prior to the end of the AGB. Standard stellar models predict that only minor changes to these isotopes should result from third dredge-up during the helium shell flash stage on the AGB, but that stars of masses should encounter hot bottom burning that can significantly affect the CNO isotopes. However, enrichment of the interstellar medium is not expected to be significantly affected by hot bottom burning for the isotopes (it increases relative to , but the total carbon abundance is generally reduced by an even larger factor) and (with the Bl96 rates, it yields ratios comparable to those from dredge-up); destruction in this relatively narrow mass range yields only a small effect, and enrichment of the interstellar medium should be increased by only % (Boothroyd et al. 1993; Sackmann & Boothroyd 1998b). In stars of mass , CBP can also affect these isotopes, as discussed above in § 3.2. We shall not specifically consider (which is largely produced during third dredge-up on the TP-AGB, which we have not followed), nor (which is produced by supernovae).
The computations of Weaver & Woosley (1993) predict that supernovae will be a source of some , , and , and a major source of (overproduction factors of 4.0, 2.2, 3.3, and 12.6, respectively, relative to solar abundances); heavier elements are generally overproduced in their models by a factor of (as are and , overproduced by 9.8 and 16.4, respectively). The relative importance of these sources can be estimated by folding the mass of each isotope ejected per star with the initial mass function , which gives the relative number of stars formed as a function of their mass . The mass enrichment of an isotope ejected into the interstellar medium is given by , where is the mass of the ejected stellar envelope of a star of mass , is the mass fraction of isotope in the star’s envelope, and is the mass fraction of isotope in the interstellar medium. Note that is the difference between the initial stellar mass and the remnant white dwarf mass or neutron star mass . The value of may be obtained from the initial–final mass relationship (Weidemann & Koester 1983; Weidemann 1984), and from the estimates of Weaver & Woosley (1993), yielding
| (2) |
One may approximate with (Salpeter 1955). The mass of isotope produced via first and second dredge-up, relative to that from supernovae, is thus
| (3) |
where , , and .
Performing the above integrals, one finds that dredge-up in low and intermediate mass stars of solar metallicity produces about 4.3 times as much enrichment as supernovae, 2.4 times as much , and slightly less , compared to Weaver & Woosley’s (1993) supernova models; if one adds the effect of CBP on the RGB, then the ratio for is 5.7 (rather than 4.3). These ratios depend to some extent on the value chosen for the slope of : a 10% change in this slope results in a % change in the enrichment ratios computed via Equation (3). As discussed in § 3.2.2, an uncertainty of perhaps as much as a factor of 2 in the production of may result from the steepness of the profile into which convection reaches during dredge-up. Note also that Weaver & Woosley (1993) appear to have used the “recommended” CF88 rates, which would probably result in an overestimate of supernova production of by a factor of relative to what would be obtained using the newer Bl96 (or even La90) rates (see, e.g., BSW94).
For most of the isotopes they consider, Weaver & Woosley (1993) find supernova overproduction factors of relative to the interstellar medium abundances. The total amounts of , , , and produced should be consistent with the supernova production of the heavier elements. For , Weaver & Woosley’s (1993) supernova models have an overproduction factor of 2.2; if low and intermediate mass stars produce an additional amount that is 4.3 to 5.7 times as much, this is equivalent to a supernova overproduction factor of 12 to 14. For , supernovae overproduction is 3.3; an added amount 2.4 times as much is equivalent to an overproduction factor of 11, and hot bottom burning would increase this to no more than 14. For , the supernova overproduction factor of 16.4 is only slightly reduced by partial destruction in low and intermediate mass stars, to 15 or 16. All three of these isotopes are thus consistent with the heavier elements. For , Weaver & Woosley (1993) give a supernova overproduction factor of 12.6; if this was an overestimate by a factor of 4 (as discussed above), their overproduction factor would be 3.2. Adding the contribution from low and intermediate mass stars to this latter value would yield the equivalent of an overproduction factor of ; hot bottom burning would not increase this very much, according to the most recent Bl96 -destruction rates (Sackmann & Boothroyd 1998b). Consistency is thus obtained for with the most recent rates. Note that most of the enrichment is due to third dredge-up in those low to intermediate mass stars that eventually become carbon stars on the AGB, and essentially all the enrichment is due to supernovae, which produce about the right amount, according to Weaver & Woosley (1993). Thus we have a reasonably self-consistent picture of the enrichment of the interstellar medium in CNO elements from stars of near-solar metallicity.
References
- (1)
- (2) Alexander, D. R., & Ferguson, J. W. 1994, ApJ, 437, 879
- (3) Becker, S. A., & Cox, A. N. 1982, ApJ, 260, 707
- (4) Becker, S. A., & Iben, I., Jr. 1979, ApJ, 232, 831
- (5) Blackmon, J. C. 1996, private communication (Bl96)
- (6) Blackmon, J. C., Champagne, A. E., Hofstee, M. A., Smith, M. S., Downing, R. G., & Lamaze, G. P. 1995, Phys. Rev. Lett., 74, 2642
- (7) Boothroyd, A. I., & Sackmann, I.-J. 1988, ApJ, 328, 653
- (8) Boothroyd, A. I., Sackmann, I.-J., & Ahern, S. C. 1993, ApJ, 416, 762
- (9) Boothroyd, A. I., Sackmann, I.-J., & Wasserburg, G. J. 1994, ApJ, 430, L77 (BSW94)
- (10) —. 1995, ApJ, 442, L21 (BSW95)
- (11) Bressan, A., Fagotto, F., Bertelli, G., & Chiosi, C. 1993, A&AS, 100, 647
- (12) Carbon, D. F., Langer, G. E., Butler, D., Kraft, R. P., Suntzeff, N. B., Kemper, E., Trefzger, C. F., & Romanishin, W. 1982, ApJS, 49, 207
- (13) Caughlan, G. R., & Fowler, W. A. 1988, Atomic Data Nucl. Data Tables, 40, 205 (CF88)
- (14) Caughlan, G. R., Fowler, W. A., Harris, M. J., & Zimmerman, B. A. 1985, Atomic Data Nucl. Data Tables, 32, 197
- (15) Charbonnel, C. 1994, A&A, 282, 811
- (16) —. 1995, ApJ, 453, L41
- (17) Charbonnel, C., Brown, J. A., & Wallerstein, G. 1998, A&A, 332, 204
- (18) Charbonnel, C., Meynet, G., Maeder, A., & Schaerer, D. 1993, A&AS, 101, 415
- (19) —. 1996, A&AS, 115, 339
- (20) Claussen, M. J., Kleinmann, S. C., Joyce, R. R., & Jura, M. 1987, ApJS, 65, 385
- (21) Cohen, J. G., & McCarthy, J. K. 1997, AJ, 113, 1353
- (22) Dearborn, D. S. P. 1992, Phys. Reports, 210, 367
- (23) Dearborn, D., Tinsley, B. M., & Schramm, D. N. 1978, ApJ, 223, 557
- (24) Dearborn, D., Eggleton, P. P., & Schramm, D. N. 1976, ApJ, 203, 455
- (25) Denissenkov, P. A., & Weiss, A. 1996, A&A, 308, 773
- (26) Denissenkov, P. A., Weiss, A., & Wagenhuber, J. 1997, A&A, 320, 115
- (27) El Eid, M. F. 1994, A&A, 285, 915
- (28) Gilroy, K. K. 1989, ApJ, 347, 835
- (29) Gilroy, K. K., & Brown, J. A. 1991, ApJ, 371, 578
- (30) Grevesse, N. 1984, Phys. Scripta, T8, 49
- (31) Grevesse, N., & Noels, A. 1993, Phys. Scripta, T47, 133
- (32) Groenewegen, M. A. T., & de Jong, T. 1993, A&A, 267, 410
- (33) Groenewegen, M. A. T., van den Hoek, L. B., & de Jong, T. 1995, A&A, 293, 381
- (34) Harris, M. J., & Lambert, D. L. 1984a, ApJ, 281, 739
- (35) —. 1984b, ApJ, 285, 674
- (36) Harris, M. J., Lambert, D. L., Hinkle, K. H., Gustafsson, B., & Eriksson, K. 1987, ApJ, 316, 294
- (37) Harris, M. J., Lambert, D. L., & Smith, V. V. 1988, ApJ, 325, 768
- (38) Huss, G. R., Fahey, A. J., Gallino, R., & Wasserburg, G. J. 1994, ApJ, 430, L81
- (39) Iben, I., Jr. 1965, ApJ, 142, 1447
- (40) —. 1966a, ApJ, 143, 483
- (41) —. 1966b, ApJ, 143, 505
- (42) —. 1967, ApJ, 147, 624
- (43) Iglesias, C. A., & Rogers, F. J. 1996, ApJ, 464, 943
- (44) Keady, J. 1985, private communication (LAOL and molecular opacities)
- (45) Kraft, R. P. 1994, PASP, 106, 553
- (46) Kraft, R. P., Sneden, C., Langer, G. E., & Shetrone, M. D. 1993, AJ, 104, 645
- (47) Kraft, R. P., Sneden, C., Langer, G. E., Shetrone, M. D., & Bolte, M. 1995, AJ, 109, 2586
- (48) Kraft, R. P., Sneden, C., Smith, G. H., Shetrone, M. D., Langer, G. E., & Pilachowski, C. A. 1997, AJ, 113, 279
- (49) Kudritzki, R. P., & Reimers, D. 1978, A&A, 70, 227
- (50) Landré, V., Prantzos, N., Aguer, P., Bogaert, G., Lefebvre, A., & Thibaud, J. P. 1990, A&A, 240, 85 (La90)
- (51) Langer, G. E., & Hoffman, R. D. 1995, PASP, 107, 1177
- (52) Langer, G. E., Hoffman, R., & Sneden, C. 1993, PASP, 105, 301
- (53) Langer, G. E., Kraft, R. P., Carbon, D. F., & Friel, E. 1986, PASP, 98, 473
- (54) Lattanzio, J. C., & Boothroyd, A. I. 1997, in Astrophysical Implications of the Laboratory Study of Presolar Materials: AIP Conference Proceedings 402, ed. T. Bernatowitz & E. Zinner (AIP: Woodbury, NY), 85-114
- (55) Meynet, G., Maeder, A., Schaller, G., Schaerer, D., & Charbonnel, C. 1994, A&AS, 103, 97
- (56) Nittler, L. R., Alexander, C. M. O’D., Gao, X., Walker, R. M., & Zinner, E. K. 1994, Nature, 370, 443
- (57) —. 1997, ApJ, 483, 475
- (58) Pilachowski, C. A., Sneden, C., & Booth, J. 1993, ApJ, 407, 699
- (59) Pilachowski, C. A., Sneden, C., Hinkle, K., & Joyce, R. 1997, AJ, 114, 819
- (60) Pinsonneault, M. H., Kawaler, S. D., Sofia, S., & Demarque, P. 1989, ApJ, 338, 424
- (61) Reimers, D. 1975, in Problems in Stellar Atmospheres and Envelopes, ed. B. Bascheck, W. H. Kegel, & G. Traving (New York: Springer), 229
- (62) Renzini, A. 1981, in Effects of Mass Loss on Stellar Evolution, ed. C. Chiosi & R. Stalio (Dordrecht: Reidel), 319
- (63) Renzini, A., & Fusi Pecci, F. 1988, ARA&A, 26, 199
- (64) Richard, O, Vauclair, S., Charbonnel, C., & Dziembowski, W. A. 1996, A&A, 312, 2000
- (65) Richard, O, & Vauclair, S. 1997, A&A, 322, 671
- (66) Ross, J. E., & Aller, L. H. 1976, Science, 191, 1223
- (67) Sackmann, I.-J., & Boothroyd, A. I. 1998a, ApJ, in press; preprint astro-ph/9512122
- (68) —. 1998b, in preparation
- (69) Sackmann, I.-J., Boothroyd, A. I., & Fowler, W. A. 1990, ApJ, 360, 727
- (70) Sackmann, I.-J., Boothroyd, A. I., & Kraemer, K. E. 1993, ApJ, 418, 457
- (71) Salpeter, E. E. 1955, ApJ, 121, 161
- (72) Schaerer, D., Meynet, G., Maeder, A., & Schaller, G. 1993a, A&AS, 98, 523
- (73) Schaerer, D., Charbonnel, C., Meynet, G., Maeder, A., & Schaller, G. 1993b, A&AS, 102, 339
- (74) Schaller, G., Schaerer, D., Meynet, G., & Maeder, A. 1992, A&AS, 96, 269
- (75) Sharp, C. M. 1992, A&AS, 94, 1
- (76) Shetrone, M. D. 1996a, AJ, 112, 1517
- (77) Shetrone, M. D. 1996b, AJ, 112, 2639
- (78) Smith, G. H., Shetrone, M. D., Bell, R. A., Churchill, C. W., & Briley, M. M. 1997, AJ, 112, 1511
- (79) Smith, G. H., Shetrone, M. D., Briley, M. M., Churchill, C. W., & Bell, R. A. 1997, PASP, 109, 236
- (80) Smith, G. H., & Tout, C. A. 1992, MNRAS, 256, 449
- (81) Sneden, C., Kraft, R. P., Langer, G. E., Prosser, C. F., & Shetrone, M. D. 1994, AJ, 107, 1773
- (82) Sneden, C., Kraft, R. P., Shetrone, M. D., Smith, G. H., Langer, G. E., & Prosser, C. F. 1997, AJ, 114, 1964
- (83) Sneden, C., Pilachowski, C. A, & VandenBerg, D. A. 1986, ApJ, 311, 826
- (84) Suntzeff, N. B., & Smith, V. V. 1991, ApJ, 381, 160
- (85) Sweigart, A. V. 1997, ApJ, 474, L23
- (86) Sweigart, A. V., Greggio, L., & Renzini, A. 1989, ApJS, 69, 911
- (87) Sweigart, A. V., & Mengel, J. G. 1979, ApJ, 229, 624
- (88) Timmes, F. X. 1995, private communication
- (89) Timmes, F. X., Woosley, S. E., & Weaver, T. A. 1995, ApJS, 98, 617
- (90) Tout, C. A. 1997, private communication (Alexander molecular opacities)
- (91) Trefzger, C. F., Carbon, D. F., Langer, G. E., Suntzeff, N. B., & Kraft, R. P. 1983, ApJ, 266, 144
- (92) VandenBerg, D. A. 1992, ApJ, 391, 685
- (93) VandenBerg, D. A., Larson, A. M., & de Propris, R. 1998, PASP, 110, 98
- (94) VandenBerg, D. A., & Smith, G. H. 1988, PASP, 100, 314
- (95) Vauclair, S. 1988, ApJ, 335, 971
- (96) Wasserburg, G. J., Boothroyd, A. I., & Sackmann, I.-J. 1995, ApJ, 447, L37 (WBS95)
- (97) Weaver, T. A, & Woosley, S. E. 1993, Phys. Rept., 227, 65
- (98) Weidemann, V. 1984, A&A, 134, L1
- (99) Weidemann, V., & Koester, D. 1983, A&A, 121, 77
- (100)
| mass fractions | number ratios | ||||||||
|---|---|---|---|---|---|---|---|---|---|
| caseaa “Init:” initial stellar abundances for the models of this table, “1st:” abundances at deepest first dredge-up on the RGB, “CBP:” RGB-tip abundances from our “evolving RGB” CBP models, “2nd:” abundances at deepest second dredge-up on the early AGB (from models with no CBP). Note power-of-ten notation: 8.40(). | 3He | ||||||||
| all | Init: | 0.2800 | 0.1733 | 0.0531 | 0.4823 | 8.40() | 90.0 | 2660 | 500.1 |
| 0.85 | 1st: | 0.3001 | 0.1662 | 0.0617 | 0.4823 | 0.001931 | 32.2 | 2656 | 504.5 |
| 1.00 | 1st: | 0.3025 | 0.1530 | 0.0771 | 0.4822 | 0.001368 | 29.8 | 2610 | 526.9 |
| CBP: | 0.3025 | 0.1517 | 0.0794 | 0.4822 | 7.28() | 11.2 | 2544 | 542.7 | |
| 2nd:bb Second dredge-up abundances that would result if no CBP had taken place on the RGB. | 0.3025 | 0.1528 | 0.0775 | 0.4822 | 0.001156 | 24.8 | 2610 | 527.2 | |
| 1.10 | 1st: | 0.3028 | 0.1460 | 0.0853 | 0.4822 | 0.001112 | 27.6 | 2491 | 549.1 |
| CBP: | 0.3028 | 0.1450 | 0.0871 | 0.4822 | 8.65() | 12.2 | 2442 | 562.2 | |
| 2nd:bb Second dredge-up abundances that would result if no CBP had taken place on the RGB. | 0.3028 | 0.1459 | 0.0855 | 0.4822 | 0.001060 | 26.0 | 2491 | 549.1 | |
| 1.20 | 1st: | 0.3015 | 0.1407 | 0.0916 | 0.4821 | 0.000923 | 26.1 | 2254 | 567.5 |
| CBP: | 0.3015 | 0.1399 | 0.0930 | 0.4821 | 0.000100 | 13.0 | 2221 | 578.7 | |
| 2nd:bb Second dredge-up abundances that would result if no CBP had taken place on the RGB. | 0.3015 | 0.1406 | 0.0917 | 0.4821 | 0.000899 | 25.4 | 2254 | 567.8 | |
| 1.35 | 1st: | 0.2988 | 0.1334 | 0.1001 | 0.4821 | 0.000718 | 24.1 | 1770 | 593.5 |
| CBP: | 0.2988 | 0.1329 | 0.1010 | 0.4821 | 0.000121 | 14.0 | 1754 | 602.4 | |
| 2nd:bb Second dredge-up abundances that would result if no CBP had taken place on the RGB. | 0.2988 | 0.1334 | 0.1002 | 0.4821 | 0.000704 | 23.5 | 1769 | 593.5 | |
| 1.50 | 1st: | 0.2957 | 0.1273 | 0.1073 | 0.4821 | 0.000575 | 23.5 | 1260 | 615.4 |
| CBP: | 0.2957 | 0.1269 | 0.1080 | 0.4821 | 0.000136 | 14.8 | 1253 | 623.1 | |
| 2nd:bb Second dredge-up abundances that would result if no CBP had taken place on the RGB. | 0.2957 | 0.1272 | 0.1074 | 0.4821 | 0.000566 | 23.0 | 1260 | 615.4 | |
| 1.65 | 1st: | 0.2930 | 0.1234 | 0.1119 | 0.4821 | 0.000467 | 22.4 | 879.0 | 632.8 |
| CBP: | 0.2930 | 0.1231 | 0.1125 | 0.4821 | 0.000141 | 15.1 | 876.0 | 639.5 | |
| 2nd:bb Second dredge-up abundances that would result if no CBP had taken place on the RGB. | 0.2931 | 0.1232 | 0.1121 | 0.4821 | 0.000461 | 21.8 | 879.0 | 632.8 | |
| 1.80 | 1st: | 0.2909 | 0.1202 | 0.1156 | 0.4821 | 0.000391 | 21.5 | 637.7 | 646.5 |
| CBP: | 0.2909 | 0.1199 | 0.1161 | 0.4821 | 0.000155 | 15.6 | 636.5 | 652.3 | |
| 2nd:bb Second dredge-up abundances that would result if no CBP had taken place on the RGB. | 0.2909 | 0.1200 | 0.1158 | 0.4821 | 0.000387 | 21.1 | 637.7 | 646.5 | |
| 2.00 | 1st: | 0.2888 | 0.1167 | 0.1197 | 0.4820 | 0.000319 | 21.7 | 417.0 | 661.0 |
| CBP: | 0.2888 | 0.1166 | 0.1200 | 0.4820 | 0.000173 | 17.2 | 416.7 | 664.6 | |
| 2nd:bb Second dredge-up abundances that would result if no CBP had taken place on the RGB. | 0.2888 | 0.1167 | 0.1197 | 0.4820 | 0.000318 | 21.6 | 417.0 | 661.0 | |
| 2.20 | 1st: | 0.2892 | 0.1153 | 0.1249 | 0.4781 | 0.000267 | 21.3 | 270.4 | 662.3 |
| 2nd:bb Second dredge-up abundances that would result if no CBP had taken place on the RGB. | 0.2892 | 0.1154 | 0.1249 | 0.4781 | 0.000267 | 21.2 | 270.4 | 662.3 | |
| 2.25 | 1st: | 0.2896 | 0.1155 | 0.1260 | 0.4766 | 0.000258 | 21.4 | 283.9 | 662.4 |
| CBP: | 0.2896 | 0.1154 | 0.1260 | 0.4766 | 0.000212 | 19.8 | 283.9 | 663.2 | |
| 2nd:bb Second dredge-up abundances that would result if no CBP had taken place on the RGB. | 0.2896 | 0.1155 | 0.1260 | 0.4766 | 0.000258 | 21.3 | 283.9 | 662.4 | |
| 2.40 | 1st: | 0.2907 | 0.1146 | 0.1300 | 0.4731 | 0.000229 | 21.3 | 251.6 | 663.1 |
| 2nd: | 0.2907 | 0.1146 | 0.1300 | 0.4731 | 0.000229 | 21.3 | 251.6 | 663.1 | |
| 2.50 | 1st: | 0.2915 | 0.1143 | 0.1324 | 0.4708 | 0.000213 | 21.1 | 264.7 | 661.2 |
| 2nd: | 0.2915 | 0.1143 | 0.1324 | 0.4708 | 0.000213 | 21.1 | 264.7 | 661.2 | |
| 2.75 | 1st: | 0.2934 | 0.1134 | 0.1376 | 0.4661 | 0.000180 | 21.1 | 275.3 | 658.8 |
| 2nd: | 0.2934 | 0.1134 | 0.1376 | 0.4661 | 0.000179 | 20.9 | 275.3 | 658.8 | |
| 3.00 | 1st: | 0.2944 | 0.1131 | 0.1408 | 0.4628 | 0.000156 | 20.8 | 323.6 | 656.6 |
| 2nd: | 0.2944 | 0.1126 | 0.1414 | 0.4628 | 0.000155 | 20.5 | 323.4 | 658.3 | |
| 3.50 | 1st: | 0.2949 | 0.1129 | 0.1441 | 0.4592 | 0.000123 | 20.6 | 378.0 | 653.5 |
| 2nd: | 0.2949 | 0.1119 | 0.1453 | 0.4593 | 0.000122 | 20.3 | 364.8 | 658.1 | |
| 4.00 | 1st: | 0.2941 | 0.1131 | 0.1450 | 0.4580 | 0.000103 | 20.8 | 459.6 | 652.1 |
| 2nd: | 0.2942 | 0.1115 | 0.1472 | 0.4575 | 0.000101 | 20.4 | 430.7 | 658.8 | |
| 4.50 | 1st: | 0.2936 | 0.1133 | 0.1455 | 0.4571 | 8.89() | 20.7 | 498.8 | 650.5 |
| 2nd: | 0.3034 | 0.1100 | 0.1555 | 0.4501 | 8.59() | 20.1 | 465.6 | 658.8 | |
| 5.00 | 1st: | 0.2933 | 0.1138 | 0.1457 | 0.4563 | 7.93() | 20.3 | 561.7 | 650.7 |
| 2nd: | 0.3197 | 0.1077 | 0.1682 | 0.4386 | 7.44() | 19.5 | 519.9 | 661.2 | |
| 5.50 | 1st: | 0.2930 | 0.1137 | 0.1462 | 0.4557 | 7.23() | 20.3 | 582.0 | 650.8 |
| 2nd: | 0.3326 | 0.1055 | 0.1786 | 0.4296 | 6.62() | 19.3 | 539.8 | 662.4 | |
| 6.00 | 1st: | 0.2934 | 0.1133 | 0.1480 | 0.4543 | 6.69() | 20.0 | 604.3 | 650.9 |
| 2nd: | 0.3438 | 0.1034 | 0.1885 | 0.4212 | 6.00() | 18.9 | 561.6 | 664.1 | |
| 6.50 | 1st: | 0.2941 | 0.1133 | 0.1494 | 0.4526 | 6.28() | 19.9 | 644.1 | 651.4 |
| 2nd: | 0.3531 | 0.1020 | 0.1963 | 0.4140 | 5.54() | 18.7 | 598.4 | 664.9 | |
| 7.00 | 1st: | 0.2948 | 0.1123 | 0.1522 | 0.4508 | 5.94() | 20.1 | 668.2 | 652.3 |
| 2nd: | 0.3606 | 0.1000 | 0.2039 | 0.4080 | 5.17() | 18.8 | 622.1 | 664.0 | |
| 7.50 | 1st: | 0.2962 | 0.1119 | 0.1551 | 0.4481 | 5.67() | 20.1 | 680.8 | 652.5 |
| 2nd:cc Second dredge-up abundances during core carbon ignition, where the program failed. | 0.3673 | 0.0987 | 0.2106 | 0.4020 | 4.87() | 18.7 | 636.2 | 619.1 | |
| 8.00 | 1st: | 0.2970 | 0.1118 | 0.1566 | 0.4463 | 5.45() | 19.7 | 698.2 | 653.8 |
| 2nd:cc Second dredge-up abundances during core carbon ignition, where the program failed. | 0.3708 | 0.0983 | 0.2139 | 0.3987 | 4.65() | 18.3 | 653.3 | 518.4 | |
| 8.50 | 1st: | 0.2981 | 0.1118 | 0.1587 | 0.4441 | 5.27() | 19.4 | 718.1 | 651.9 |
| 2nd:cc Second dredge-up abundances during core carbon ignition, where the program failed. | 0.3703 | 0.0982 | 0.2152 | 0.3974 | 4.50() | 17.9 | 672.8 | 659.2 | |
| 9.00 | 1st: | 0.2998 | 0.1107 | 0.1622 | 0.4415 | 5.11() | 19.8 | 738.1 | 653.6 |
| 2nd:cc Second dredge-up abundances during core carbon ignition, where the program failed. | 0.3232 | 0.1040 | 0.1841 | 0.4254 | 4.69() | 18.4 | 691.0 | 670.4 | |
| mass fractions | number ratios | ||||||||
|---|---|---|---|---|---|---|---|---|---|
| caseaafootnotemark: | 3He | ||||||||
| all | Init: | 0.2540 | 0.0952 | 0.0292 | 0.6359 | 7.62() | 402.0 | 11890 | 2233 |
| 0.85 | 1st: | 0.2728 | 0.0909 | 0.0344 | 0.6359 | 0.001812 | 42.9 | 11780 | 2257 |
| 0.95 | 1st: | 0.2754 | 0.0850 | 0.0412 | 0.6359 | 0.001419 | 39.3 | 11230 | 2330 |
| 1.00 | 1st: | 0.2762 | 0.0825 | 0.0442 | 0.6359 | 0.001273 | 37.9 | 10500 | 2386 |
| CBP: | 0.2762 | 0.0788 | 0.0494 | 0.6359 | 2.92() | 6.09 | 7898 | 2616 | |
| 2nd:bb Second dredge-up abundances that would result if no CBP had taken place on the RGB; note may be inaccurate (see text). | 0.2763 | 0.0799 | 0.0473 | 0.6359 | 0.001115 | 29.2 | 9985 | 2410 | |
| 1.10 | 1st: | 0.2772 | 0.0783 | 0.0492 | 0.6359 | 0.001036 | 33.9 | 7880 | 2504 |
| CBP: | 0.2772 | 0.0757 | 0.0529 | 0.6359 | 3.50() | 6.85 | 6560 | 2699 | |
| 2nd:bb Second dredge-up abundances that would result if no CBP had taken place on the RGB; note may be inaccurate (see text). | 0.2772 | 0.0768 | 0.0509 | 0.6359 | 0.000963 | 29.6 | 7663 | 2520 | |
| 1.20 | 1st: | 0.2764 | 0.0750 | 0.0529 | 0.6360 | 0.000868 | 32.3 | 5008 | 2600 |
| CBP: | 0.2764 | 0.0733 | 0.0556 | 0.6360 | 4.25() | 7.75 | 4537 | 2764 | |
| 2nd:bb Second dredge-up abundances that would result if no CBP had taken place on the RGB; note may be inaccurate (see text). | 0.2764 | 0.0740 | 0.0542 | 0.6360 | 0.000824 | 29.2 | 4965 | 2614 | |
| 1.35 | 1st: | 0.2742 | 0.0708 | 0.0578 | 0.6360 | 0.000680 | 29.4 | 2327 | 2727 |
| CBP: | 0.2742 | 0.0697 | 0.0596 | 0.6360 | 5.39() | 9.00 | 2245 | 2855 | |
| 2nd:bb Second dredge-up abundances that would result if no CBP had taken place on the RGB; note may be inaccurate (see text). | 0.2742 | 0.0698 | 0.0591 | 0.6360 | 0.000654 | 27.6 | 2311 | 2748 | |
| 1.50 | 1st: | 0.2716 | 0.0670 | 0.0624 | 0.6360 | 0.000550 | 27.8 | 1192 | 2848 |
| CBP: | 0.2716 | 0.0662 | 0.0636 | 0.6359 | 6.44() | 10.0 | 1174 | 2957 | |
| 2nd:bb Second dredge-up abundances that would result if no CBP had taken place on the RGB; note may be inaccurate (see text). | 0.2717 | 0.0662 | 0.0632 | 0.6360 | 0.000534 | 26.4 | 1190 | 2861 | |
| 1.65 | 1st: | 0.2690 | 0.0645 | 0.0652 | 0.6359 | 0.000452 | 26.3 | 680.3 | 2947 |
| CBP: | 0.2690 | 0.0639 | 0.0663 | 0.6359 | 7.23() | 10.7 | 675.2 | 3044 | |
| 2nd:bb Second dredge-up abundances that would result if no CBP had taken place on the RGB; note may be inaccurate (see text). | 0.2691 | 0.0638 | 0.0661 | 0.6359 | 0.000441 | 25.2 | 678.8 | 2966 | |
| 1.80 | 1st: | 0.2667 | 0.0627 | 0.0674 | 0.6359 | 0.000382 | 25.5 | 445.4 | 3016 |
| CBP: | 0.2667 | 0.0622 | 0.0682 | 0.6359 | 8.46() | 11.8 | 443.6 | 3096 | |
| 2nd:bb Second dredge-up abundances that would result if no CBP had taken place on the RGB; note may be inaccurate (see text). | 0.2667 | 0.0621 | 0.0681 | 0.6359 | 0.000374 | 24.6 | 444.9 | 3028 | |
| 2.00 | 1st: | 0.2645 | 0.0606 | 0.0701 | 0.6360 | 0.000311 | 25.2 | 244.7 | 3098 |
| CBP: | 0.2645 | 0.0605 | 0.0704 | 0.6360 | 0.000117 | 15.1 | 244.5 | 3141 | |
| 2nd:bb Second dredge-up abundances that would result if no CBP had taken place on the RGB; note may be inaccurate (see text). | 0.2645 | 0.0603 | 0.0705 | 0.6360 | 0.000307 | 24.5 | 244.7 | 3106 | |
| 2.10 | 1st: | 0.2642 | 0.0601 | 0.0743 | 0.6319 | 0.000284 | 24.8 | 229.1 | 3110 |
| 2nd: | 0.2642 | 0.0599 | 0.0746 | 0.6319 | 0.000280 | 24.1 | 229.1 | 3114 | |
| 2.25 | 1st: | 0.2650 | 0.0592 | 0.0828 | 0.6231 | 0.000249 | 24.7 | 250.2 | 3097 |
| 2nd: | 0.2650 | 0.0592 | 0.0828 | 0.6231 | 0.000248 | 24.3 | 250.2 | 3097 | |
| 2.50 | 1st: | 0.2668 | 0.0588 | 0.0931 | 0.6117 | 0.000207 | 23.9 | 290.3 | 3088 |
| 2nd: | 0.2668 | 0.0584 | 0.0936 | 0.6117 | 0.000204 | 23.4 | 290.1 | 3100 | |
| 2.75 | 1st: | 0.2669 | 0.0584 | 0.0985 | 0.6062 | 0.000176 | 24.1 | 318.6 | 3069 |
| 2nd: | 0.2669 | 0.0576 | 0.0995 | 0.6063 | 0.000173 | 23.5 | 310.2 | 3099 | |
| 3.00 | 1st: | 0.2660 | 0.0588 | 0.0997 | 0.6044 | 0.000154 | 23.8 | 359.3 | 3057 |
| 2nd: | 0.2660 | 0.0577 | 0.1011 | 0.6043 | 0.000150 | 23.0 | 331.2 | 3099 | |
| 3.50 | 1st: | 0.2616 | 0.0597 | 0.0941 | 0.6094 | 0.000124 | 23.8 | 432.1 | 3039 |
| 2nd: | 0.2619 | 0.0582 | 0.0976 | 0.6076 | 0.000120 | 22.8 | 389.0 | 3095 | |
| 3.75 | 1st: | 0.2597 | 0.0602 | 0.0900 | 0.6135 | 0.000113 | 23.8 | 459.5 | 3034 |
| 2nd: | 0.2609 | 0.0584 | 0.0951 | 0.6102 | 0.000109 | 22.6 | 414.0 | 3095 | |
| 4.00 | 1st: | 0.2578 | 0.0611 | 0.0841 | 0.6190 | 0.000105 | 23.5 | 484.0 | 3018 |
| 2nd: | 0.2677 | 0.0588 | 0.0963 | 0.6083 | 0.000100 | 22.3 | 439.3 | 3076 | |
| 4.50 | 1st: | 0.2554 | 0.0622 | 0.0741 | 0.6292 | 9.22() | 23.7 | 517.9 | 3007 |
| 2nd: | 0.2835 | 0.0588 | 0.1097 | 0.5929 | 8.66() | 22.7 | 485.2 | 3018 | |
| 5.00 | 1st: | 0.2546 | 0.0635 | 0.0678 | 0.6346 | 8.32() | 23.3 | 626.6 | 2990 |
| 2nd: | 0.2999 | 0.0579 | 0.1255 | 0.5761 | 7.52() | 21.9 | 532.0 | 3019 | |
| 5.50 | 1st: | 0.2544 | 0.0639 | 0.0661 | 0.6359 | 7.60() | 23.6 | 717.6 | 2970 |
| 2nd: | 0.3146 | 0.0566 | 0.1394 | 0.5619 | 6.65() | 21.8 | 547.9 | 3017 | |
| 6.00 | 1st: | 0.2543 | 0.0642 | 0.0660 | 0.6357 | 7.01() | 23.0 | 759.9 | 2976 |
| 2nd: | 0.3257 | 0.0560 | 0.1494 | 0.5511 | 6.02() | 21.2 | 583.1 | 3005 | |
| 6.50 | 1st: | 0.2543 | 0.0637 | 0.0667 | 0.6355 | 6.53() | 23.3 | 720.0 | 2989 |
| 2nd: | 0.3344 | 0.0552 | 0.1586 | 0.5416 | 5.53() | 21.4 | 598.5 | 2960 | |
| 7.00 | 1st: | 0.2545 | 0.0635 | 0.0701 | 0.6319 | 6.13() | 22.6 | 704.7 | 2992 |
| 2nd:ccfootnotemark: | 0.3413 | 0.0550 | 0.1651 | 0.5345 | 5.16() | 20.8 | 635.5 | 1788 | |
| 7.50 | 1st: | 0.2551 | 0.0629 | 0.0757 | 0.6262 | 5.79() | 22.6 | 684.2 | 2994 |
| 2nd:ccfootnotemark: | 0.3439 | 0.0548 | 0.1687 | 0.5307 | 4.89() | 20.7 | 635.7 | 1396 | |
| 8.00 | 1st: | 0.2573 | 0.0621 | 0.0865 | 0.6150 | 5.48() | 22.4 | 712.6 | 2995 |
| 2nd:ccfootnotemark: | 0.3412 | 0.0547 | 0.1691 | 0.5302 | 4.68() | 20.4 | 663.0 | 2874 | |
| 8.50 | 1st: | 0.2607 | 0.0612 | 0.0977 | 0.6034 | 5.21() | 22.1 | 762.2 | 2987 |
| 2nd:ccfootnotemark: | 0.2718 | 0.0591 | 0.1181 | 0.5829 | 4.95() | 20.8 | 731.6 | 3001 | |
| mass fractions | number ratios | ||||||||
|---|---|---|---|---|---|---|---|---|---|
| caseaafootnotemark: | 3He | ||||||||
| all | Init: | 0.2400 | 0.0765 | 0.0234 | 0.6728 | 7.20() | 3583 | 106200 | 19910 |
| 0.80 | 1st: | 0.2535 | 0.0755 | 0.0247 | 0.6728 | 0.001773 | 56.0 | 104100 | 19980 |
| 0.85 | 1st: | 0.2554 | 0.0730 | 0.0276 | 0.6728 | 0.001560 | 44.7 | 98560 | 20110 |
| 0.90 | 1st: | 0.2571 | 0.0702 | 0.0308 | 0.6728 | 0.001374 | 42.6 | 85440 | 20410 |
| 1.00 | 1st: | 0.2598 | 0.0654 | 0.0364 | 0.6729 | 0.001102 | 39.2 | 41370 | 21500 |
| CBP: | 0.2598 | 0.0295 | 0.0790 | 0.6728 | 4.89() | 2.67 | 3701 | 44530 | |
| 2nd:bb Second dredge-up abundances that would result if no CBP had taken place on the RGB; note may be inaccurate (see text). | 0.2600 | 0.0597 | 0.0433 | 0.6730 | 0.000918 | 30.0 | 2745 | 22950 | |
| 1.10 | 1st: | 0.2615 | 0.0617 | 0.0408 | 0.6729 | 0.000902 | 34.7 | 13630 | 22720 |
| CBP: | 0.2615 | 0.0348 | 0.0729 | 0.6729 | 6.43() | 2.81 | 3791 | 39900 | |
| 2nd:bb Second dredge-up abundances that would result if no CBP had taken place on the RGB; note may be inaccurate (see text). | 0.2617 | 0.0572 | 0.0462 | 0.6733 | 0.000784 | 28.6 | 1298 | 23900 | |
| 1.20 | 1st: | 0.2625 | 0.0583 | 0.0448 | 0.6729 | 0.000756 | 32.9 | 4626 | 23820 |
| CBP: | 0.2625 | 0.0381 | 0.0690 | 0.6729 | 8.21() | 2.98 | 2711 | 37380 | |
| 2nd:bb Second dredge-up abundances that would result if no CBP had taken place on the RGB; note may be inaccurate (see text). | 0.2626 | 0.0547 | 0.0491 | 0.6732 | 0.000674 | 28.3 | 1038 | 24820 | |
| 1.35 | 1st: | 0.2624 | 0.0546 | 0.0491 | 0.6729 | 0.000593 | 30.5 | 1250 | 25140 |
| CBP: | 0.2624 | 0.0411 | 0.0656 | 0.6729 | 1.12() | 3.31 | 1092 | 35300 | |
| 2nd:bb Second dredge-up abundances that would result if no CBP had taken place on the RGB; note may be inaccurate (see text). | 0.2625 | 0.0519 | 0.0524 | 0.6732 | 0.000543 | 27.1 | 753.6 | 25980 | |
| 1.50 | 1st: | 0.2606 | 0.0518 | 0.0524 | 0.6729 | 0.000483 | 28.5 | 495.0 | 26050 |
| CBP: | 0.2606 | 0.0424 | 0.0641 | 0.6728 | 1.44() | 3.67 | 473.4 | 34050 | |
| 2nd:bb Second dredge-up abundances that would result if no CBP had taken place on the RGB; note may be inaccurate (see text). | 0.2607 | 0.0494 | 0.0553 | 0.6732 | 0.000447 | 25.7 | 382.4 | 26810 | |
| 1.65 | 1st: | 0.2587 | 0.0493 | 0.0554 | 0.6730 | 0.000405 | 27.2 | 250.0 | 26580 |
| CBP: | 0.2587 | 0.0428 | 0.0637 | 0.6729 | 1.84() | 4.09 | 245.4 | 32880 | |
| 2nd:bb Second dredge-up abundances that would result if no CBP had taken place on the RGB; note may be inaccurate (see text). | 0.2588 | 0.0470 | 0.0585 | 0.6730 | 0.000375 | 24.8 | 207.0 | 27290 | |
| 1.80 | 1st: | 0.2569 | 0.0469 | 0.0584 | 0.6727 | 0.000342 | 26.5 | 155.9 | 26830 |
| CBP: | 0.2569 | 0.0428 | 0.0638 | 0.6727 | 2.38() | 4.68 | 154.5 | 31520 | |
| 2nd:bb Second dredge-up abundances that would result if no CBP had taken place on the RGB; note may be inaccurate (see text). | 0.2570 | 0.0447 | 0.0618 | 0.6722 | 0.000318 | 24.2 | 138.3 | 27520 | |
| 2.00 | 1st: | 0.2545 | 0.0449 | 0.0623 | 0.6710 | 0.000280 | 25.4 | 103.5 | 26790 |
| CBP: | 0.2545 | 0.0437 | 0.0640 | 0.6711 | 4.66() | 7.28 | 103.2 | 28710 | |
| 2nd:bb Second dredge-up abundances that would result if no CBP had taken place on the RGB; note may be inaccurate (see text). | 0.2547 | 0.0427 | 0.0666 | 0.6693 | 0.000261 | 23.1 | 96.5 | 27470 | |
| 2.20 | 1st: | 0.2526 | 0.0435 | 0.0674 | 0.6672 | 0.000236 | 24.4 | 83.6 | 26550 |
| 2nd: | 0.2528 | 0.0413 | 0.0727 | 0.6643 | 0.000220 | 22.0 | 79.6 | 27240 | |
| 2.30 | 1st: | 0.2507 | 0.0434 | 0.0652 | 0.6698 | 0.000220 | 24.7 | 84.8 | 26730 |
| 2nd: | 0.2508 | 0.0411 | 0.0712 | 0.6662 | 0.000205 | 22.2 | 80.7 | 27460 | |
| 2.50 | 1st: | 0.2469 | 0.0448 | 0.0612 | 0.6724 | 0.000200 | 24.6 | 138.3 | 27450 |
| 2nd: | 0.2472 | 0.0422 | 0.0691 | 0.6671 | 0.000184 | 22.0 | 127.9 | 28310 | |
| 2.75 | 1st: | 0.2435 | 0.0482 | 0.0566 | 0.6729 | 0.000184 | 24.1 | 538.1 | 27270 |
| 2nd: | 0.2448 | 0.0453 | 0.0667 | 0.6653 | 0.000169 | 21.6 | 329.1 | 27950 | |
| 3.00 | 1st: | 0.2419 | 0.0521 | 0.0520 | 0.6729 | 0.000172 | 24.3 | 2219 | 25590 |
| 2nd: | 0.2447 | 0.0454 | 0.0683 | 0.6633 | 0.000155 | 23.9 | 293.4 | 27990 | |
| 3.25 | 1st: | 0.2409 | 0.0578 | 0.0454 | 0.6728 | 0.000166 | 24.5 | 11430 | 23110 |
| 2nd: | 0.2489 | 0.0443 | 0.0746 | 0.6578 | 0.000135 | 23.8 | 243.6 | 28220 | |
| 3.50 | 1st: | 0.2405 | 0.0636 | 0.0387 | 0.6729 | 0.000159 | 24.9 | 34700 | 21270 |
| 2nd: | 0.2611 | 0.0433 | 0.0861 | 0.6462 | 0.000119 | 23.5 | 201.9 | 28110 | |
| 3.75 | 1st: | 0.2403 | 0.0692 | 0.0321 | 0.6728 | 0.000149 | 25.2 | 66930 | 20430 |
| 2nd: | 0.2731 | 0.0429 | 0.0979 | 0.6337 | 0.000105 | 22.9 | 184.0 | 28040 | |
| 4.00 | 1st: | 0.2402 | 0.0742 | 0.0263 | 0.6728 | 0.000140 | 29.6 | 90320 | 20090 |
| 2nd: | 0.2831 | 0.0421 | 0.1079 | 0.6236 | 9.47() | 20.7 | 180.3 | 28050 | |
| 4.50 | 1st: | 0.2401 | 0.0764 | 0.0236 | 0.6728 | 0.000122 | 78.9 | 103600 | 19940 |
| 2nd: | 0.3004 | 0.0411 | 0.1256 | 0.6038 | 7.94() | 20.7 | 174.0 | 27950 | |
| 5.00 | 1st: | 0.2400 | 0.0765 | 0.0235 | 0.6728 | 0.000107 | 255.0 | 105700 | 19920 |
| 2nd: | 0.3130 | 0.0405 | 0.1405 | 0.5879 | 6.82() | 19.8 | 165.7 | 27220 | |
| 5.50 | 1st: | 0.2400 | 0.0765 | 0.0234 | 0.6728 | 9.46() | 736.4 | 106100 | 19910 |
| 2nd: | 0.3235 | 0.0400 | 0.1528 | 0.5745 | 6.03() | 19.8 | 166.7 | 24040 | |
| 6.00 | 1st: | 0.2400 | 0.0765 | 0.0234 | 0.6728 | 8.49() | 1853 | 106200 | 19910 |
| 2nd: | 0.3312 | 0.0398 | 0.1628 | 0.5639 | 5.43() | 19.9 | 174.1 | 16740 | |
| 6.50 | 1st: | 0.2400 | 0.0765 | 0.0234 | 0.6728 | 7.20() | 3583 | 106200 | 19910 |
| 2nd:ccfootnotemark: | 0.3367 | 0.0400 | 0.1705 | 0.5551 | 4.96() | 19.9 | 180.6 | 2535 | |
| 7.00 | 1st: | 0.2400 | 0.0765 | 0.0234 | 0.6728 | 7.20() | 3583 | 106200 | 19910 |
| 2nd:ccfootnotemark: | 0.3376 | 0.0397 | 0.1737 | 0.5516 | 4.63() | 19.9 | 196.3 | 3842 | |
| 7.50 | 1st: | 0.2400 | 0.0765 | 0.0234 | 0.6728 | 7.20() | 3583 | 106200 | 19910 |
| 2nd:ccfootnotemark: | 0.2487 | 0.0421 | 0.1107 | 0.6199 | 4.96() | 20.9 | 194.9 | 28160 | |
| 8.00 | 1st: | 0.2400 | 0.0765 | 0.0234 | 0.6728 | 7.20() | 3583 | 106200 | 19910 |
| 2nd:ccfootnotemark: | 0.2482 | 0.0421 | 0.1128 | 0.6174 | 4.73() | 20.7 | 211.2 | 28230 | |
| 8.50 | 1st: | 0.2400 | 0.0765 | 0.0234 | 0.6728 | 7.20() | 3583 | 106200 | 19910 |
| 2nd:ccfootnotemark: | 0.3474 | 0.0598 | 0.1868 | 0.5368 | 3.92() | 29.8 | 220.6 | 227.0 | |
| mass fractions | number ratios | ||||||||
|---|---|---|---|---|---|---|---|---|---|
| caseaafootnotemark: | 3He | ||||||||
| all | Init: | 0.2380 | 0.0765 | 0.0234 | 0.6728 | 7.14() | 35820 | 1062000 | 199100 |
| 0.80 | 1st: | 0.2469 | 0.0764 | 0.0236 | 0.6728 | 0.001629 | 100.7 | 999800 | 199300 |
| 0.85 | 1st: | 0.2487 | 0.0752 | 0.0250 | 0.6728 | 0.001419 | 51.7 | 810500 | 200000 |
| 0.90 | 1st: | 0.2505 | 0.0722 | 0.0285 | 0.6728 | 0.001247 | 43.1 | 478500 | 201800 |
| 1.00 | 1st: | 0.2538 | 0.0663 | 0.0355 | 0.6728 | 0.000983 | 39.8 | 85410 | 212600 |
| CBP: | 0.2538 | 1.78() | 0.1106 | 0.6729 | 2.97() | 3.52 | 308.7 | 877500 | |
| 2nd:bbfootnotemark: | 0.2546 | 0.0563 | 0.0485 | 0.6730 | 0.000741 | 27.5 | 239.1 | 170100 | |
| 1.10 | 1st: | 0.2566 | 0.0616 | 0.0409 | 0.6729 | 0.000799 | 35.5 | 15110 | 227000 |
| CBP: | 0.2566 | 1.78() | 0.1106 | 0.6729 | 4.16() | 3.50 | 411.0 | 1204000 | |
| 2nd:bbfootnotemark: | 0.2575 | 0.0528 | 0.0588 | 0.6657 | 0.000620 | 26.2 | 244.6 | 177900 | |
| 1.20 | 1st: | 0.2587 | 0.0578 | 0.0454 | 0.6728 | 0.000663 | 33.0 | 3495 | 237000 |
| CBP: | 0.2587 | 1.95() | 0.1104 | 0.6729 | 6.40() | 3.37 | 497.4 | 1456000 | |
| 2nd:bbfootnotemark: | 0.2597 | 0.0497 | 0.0679 | 0.6606 | 0.000526 | 25.2 | 238.9 | 183800 | |
| 1.35 | 1st: | 0.2612 | 0.0528 | 0.0512 | 0.6729 | 0.000517 | 31.0 | 657.9 | 231300 |
| CBP: | 0.2612 | 4.26() | 0.1078 | 0.6729 | 1.49() | 2.81 | 405.1 | 958900 | |
| 2nd:bbfootnotemark: | 0.2617 | 0.0467 | 0.0641 | 0.6677 | 0.000427 | 24.3 | 229.7 | 192600 | |
| 1.50 | 1st: | 0.2626 | 0.0490 | 0.0558 | 0.6730 | 0.000418 | 29.5 | 176.5 | 178500 |
| CBP: | 0.2626 | 0.0120 | 0.0992 | 0.6730 | 3.37() | 2.62 | 162.0 | 331300 | |
| 2nd:bbfootnotemark: | 0.2633 | 0.0431 | 0.0755 | 0.6593 | 0.000346 | 23.4 | 126.8 | 159600 | |
| 1.65 | 1st: | 0.2629 | 0.0460 | 0.0615 | 0.6706 | 0.000345 | 27.2 | 87.6 | 130400 |
| CBP: | 0.2629 | 0.0362 | 0.0736 | 0.6706 | 1.71() | 3.56 | 86.6 | 148900 | |
| 2nd:bbfootnotemark: | 0.2635 | 0.0407 | 0.0797 | 0.6577 | 0.000289 | 21.8 | 75.4 | 121900 | |
| 1.80 | 1st: | 0.2621 | 0.0438 | 0.0708 | 0.6631 | 0.000292 | 26.0 | 67.1 | 111300 |
| 2nd: | 0.2627 | 0.0387 | 0.0894 | 0.6493 | 0.000246 | 20.9 | 60.7 | 106200 | |
| 2.00 | 1st: | 0.2603 | 0.0413 | 0.0854 | 0.6497 | 0.000241 | 24.4 | 61.0 | 104800 |
| 2nd: | 0.2611 | 0.0362 | 0.1062 | 0.6332 | 0.000203 | 19.5 | 56.2 | 100900 | |
| 2.10 | 1st: | 0.2591 | 0.0403 | 0.0911 | 0.6446 | 0.000221 | 23.7 | 59.9 | 103300 |
| 2nd: | 0.2599 | 0.0351 | 0.1130 | 0.6268 | 0.000187 | 19.0 | 55.5 | 99900 | |
| 2.20 | 1st: | 0.2445 | 0.0488 | 0.0559 | 0.6729 | 0.000243 | 24.1 | 877.0 | 248600 |
| 2nd: | 0.2489 | 0.0431 | 0.0801 | 0.6534 | 0.000205 | 19.9 | 261.5 | 203900 | |
| 2.25 | 1st: | 0.2396 | 0.0669 | 0.0349 | 0.6728 | 0.000289 | 23.7 | 124100 | 207300 |
| 2nd: | 0.2483 | 0.0443 | 0.0789 | 0.6532 | 0.000217 | 23.0 | 255.5 | 201400 | |
| 2.30 | 1st: | 0.2387 | 0.0759 | 0.0242 | 0.6728 | 0.000309 | 45.7 | 775300 | 199800 |
| 2nd: | 0.2482 | 0.0436 | 0.0799 | 0.6526 | 0.000209 | 23.3 | 232.8 | 196300 | |
| 2.40 | 1st: | 0.2381 | 0.0764 | 0.0234 | 0.6728 | 0.000195 | 9417 | 1062000 | 199100 |
| 2nd: | 0.2479 | 0.0429 | 0.0818 | 0.6516 | 0.000193 | 23.3 | 187.7 | 183300 | |
| 2.50 | 1st: | 0.2380 | 0.0765 | 0.0234 | 0.6728 | 7.40() | 35820 | 1062000 | 199100 |
| 2nd: | 0.2478 | 0.0420 | 0.0838 | 0.6501 | 0.000181 | 21.4 | 155.1 | 171200 | |
| 2.75 | 1st: | 0.2380 | 0.0765 | 0.0234 | 0.6728 | 7.14() | 35820 | 1062000 | 199100 |
| 2nd: | 0.2478 | 0.0399 | 0.0902 | 0.6455 | 0.000156 | 22.0 | 108.1 | 145000 | |
| 3.00 | 1st: | 0.2380 | 0.0765 | 0.0234 | 0.6728 | 7.14() | 35820 | 1062000 | 199100 |
| 2nd: | 0.2489 | 0.0387 | 0.0965 | 0.6401 | 0.000136 | 21.3 | 86.7 | 128500 | |
| 3.50 | 1st: | 0.2380 | 0.0765 | 0.0234 | 0.6728 | 7.14() | 35820 | 1062000 | 199100 |
| 2nd: | 0.2702 | 0.0363 | 0.1227 | 0.6133 | 0.000104 | 19.6 | 67.6 | 110000 | |
| 4.00 | 1st: | 0.2380 | 0.0765 | 0.0234 | 0.6728 | 7.14() | 35820 | 1062000 | 199100 |
| 2nd: | 0.2883 | 0.0349 | 0.1436 | 0.5914 | 8.29() | 19.5 | 63.4 | 105500 | |
| 4.50 | 1st: | 0.2380 | 0.0765 | 0.0234 | 0.6728 | 7.14() | 35820 | 1062000 | 199100 |
| 2nd: | 0.3035 | 0.0340 | 0.1628 | 0.5709 | 6.88() | 18.0 | 62.4 | 103400 | |
| 5.00 | 1st: | 0.2380 | 0.0765 | 0.0234 | 0.6728 | 7.14() | 35820 | 1062000 | 199100 |
| 2nd: | 0.3149 | 0.0336 | 0.1786 | 0.5538 | 5.90() | 18.0 | 63.9 | 81880 | |
| 5.50 | 1st: | 0.2380 | 0.0765 | 0.0234 | 0.6728 | 7.14() | 35820 | 1062000 | 199100 |
| 2nd: | 0.3247 | 0.0352 | 0.1915 | 0.5397 | 5.20() | 18.8 | 68.8 | 57830 | |
| 6.00 | 1st: | 0.2380 | 0.0765 | 0.0234 | 0.6728 | 7.14() | 35820 | 1062000 | 199100 |
| 2nd: | 0.3318 | 0.0347 | 0.2007 | 0.5296 | 4.65() | 18.8 | 72.9 | 31500 | |
| 6.50 | 1st: | 0.2380 | 0.0765 | 0.0234 | 0.6728 | 7.14() | 35820 | 1062000 | 199100 |
| 2nd:ccfootnotemark: | 0.3368 | 0.0475 | 0.2079 | 0.5217 | 4.25() | 26.0 | 78.0 | 1849 | |
| 7.00 | 1st: | 0.2380 | 0.0765 | 0.0234 | 0.6728 | 7.14() | 35820 | 1062000 | 199100 |
| 2nd:ccfootnotemark: | 0.3367 | 0.0396 | 0.2115 | 0.5178 | 3.93() | 21.0 | 82.2 | 4630 | |
| 7.50 | 1st: | 0.2380 | 0.0765 | 0.0234 | 0.6728 | 7.14() | 35820 | 1062000 | 199100 |
| 2nd:ccfootnotemark: | 0.2507 | 0.0335 | 0.1550 | 0.5802 | 4.16() | 18.4 | 86.7 | 126900 | |
| 8.00 | 1st: | 0.2380 | 0.0765 | 0.0234 | 0.6728 | 7.14() | 35820 | 1062000 | 199100 |
| 2nd:ccfootnotemark: | 0.2474 | 0.0335 | 0.1548 | 0.5805 | 3.96() | 18.3 | 92.2 | 131400 | |
| 9.00 | 1st: | 0.2380 | 0.0765 | 0.0234 | 0.6728 | 7.14() | 35820 | 1062000 | 199100 |
| 2nd:ccfootnotemark: | 0.3048 | 0.0320 | 0.1984 | 0.5325 | 3.32() | 15.7 | 101.5 | 135900 | |