Unbiased Cluster Lens Reconstruction
Abstract
Weak lensing observations measure the shear field , and hence the gradient of the dimensionless surface density . We present several new algorithms to recover from shear estimates on a finite region and compare how they perform with realistically noisy data. The reconstruction methods studied here can be divided into two classes: direct reconstruction and regularized inversion techniques. The direct reconstruction techniques express the surface density as a two-dimensional integral of the shear field: . This allows one to construct an estimator for as a discrete sum over background galaxy ellipticities which is straightforward to implement, and allows a rigorous yet simple estimate of the noise arising from random intrinsic background galaxy ellipticities. We study three types of direct reconstruction methods: 1) -estimators that measure the surface density at any given target point relative to the mean value in some reference region 2) a method that explicitly attempts to minimize the rotational part of that is due to noise and 3) a novel, exact Fourier-space inverse gradient operator. We also develop two ‘regularized maximum likelihood’ methods, one of which employs the conventional discrete Laplacian operator as a regularizer and the other uses regularization of all components in Fourier space. We compare the performance of all the estimators by means of simulations and noise power analysis. A general feature of these unbiased methods is an enhancement of the low-frequency noise power which, for some of the methods, can be quite severe. We find the best performance is provided by the maximum likelihood method with Fourier space regularization, although some of the other methods perform almost as well.
1 Introduction
Clusters of galaxies, acting as gravitational lenses, introduce a statistical anisotropy in the shapes of faint background galaxies. In the weak distortion regime it is possible to construct (see e.g. Kaiser, Squires & Broadhurst (1995)) a ‘polarization’ statistic — a certain measure of the ellipticity of the background galaxy — whose expectation value is proportional to, and therefore provides a direct measurement of, the gravitational shear , where is the surface potential for the lens. The precision with which one can determine is of course limited by the number of background galaxies, and care must be taken to allow for systematic bias from seeing and removal of artificial anisotropy, but several groups have now shown that the shear can be detected to a reasonably high level of significance. The list of shear fields mapped around clusters includes A1689 (Tyson et al. (1990); Tyson & Fischer (1995)), A2218 (Squires et al. (1995)), Cl1409+52 (Tyson et al. (1990)), MS1224+20 (Fahlman et al. (1994)), Cl0024+17 (Bonnet et al. (1994); Mellier et al. (1994)), Cl1455+22 and Cl0016+16 (Smail et al. (1994, 1995)).
The lens surface potential is related to the dimensionless surface density by . In an earlier paper (Kaiser & Squires 1993; hereafter KS93) we proposed a method for reconstructing the surface density from the shear. Writing the shear as , where the 2-component integro-differential operator is one can readily show that . The Green’s function for this operator is with , so we obtain
| (1) |
and this 2-dimensional convolution integral can in turn be replaced by a discrete sum over the background galaxies to give the estimator
| (2) |
where is the mean surface number density of the background galaxies.
Unfortunately the kernel is infinite in extent, so this requires, strictly speaking, data extending to infinity. With finite data the estimate as written above becomes biased, as discussed in KS93 and illustrated in the simulations presented there. Near the center of the field on which we have data, this simply results in a nearly constant suppression in the reconstructed surface density, and since the baseline surface density is ambiguous in any case this is relatively benign. However, near the edge of the data the shape becomes biased and one typically finds the density goes negative in a trough around the cluster and then rises again as one approaches the edge. The algorithm effectively tries to generate a lens that has a shear pattern like that observed within the region surveyed, but which falls to zero outside the data boundary. One immediate consequence of this is that there must be zero net mass in the reconstruction. Because of this we have tended to augment our 2-dimensional reconstructions by aperture mass measurements (Fahlman et al. (1994); Squires et al. (1995)) which do not suffer from this bias.
This raises the interesting question: since the shear is a non-local function of the surface density — so the shear within some region is determined in part by the surface density outside — is it possible to uniquely determine from local measurements? The answer is affirmative, subject only to the qualification that one can add an arbitrary constant to . One way to see this is from the expression for the angular gradients of in terms of gradients of the shear (Kaiser 1995):
| (3) |
This relation follows directly from the expressions for and in terms of above, and ‘projects out’ a certain linear combination of the shear gradients which are locally determined. Thus with perfect data we could determine at any point relative to the value at some arbitrary reference point simply by performing a line integral of the observable . This also provides an alternative way to visualize the convolution integral equation (1); if one averages over radial line integrals from points on some very distant boundary (on which we assume that and vanish) to a ‘target’ point , we obtain a two dimensional integral, and integrating by parts to express everything in terms of the shear rather than its gradients we obtain equation (1). Equation (3) is valid in the weak distortion regime — the main focus of this paper — but can be readily extended into the strong-distortion regime (Kaiser 1995).
The above argument gives a qualitative insight on how to account for the bias in the original algorithm and several groups have exploited the above relations to develop unbiased surface density estimators (Schneider (1994); Kaiser et al. (1995); Schneider & Seitz, C., (1995); Seitz, C., & Schneider (1995); Seitz, S., & Schneider (1995)). In this paper, we address the reconstruction problem from a variety of perspectives. First we expand on some simple alternative solutions to the finite-field problem where we determine the surface density relative to some well-defined reference region as sketched in Figures 1a,b,c. In §2 we show that in general, if one uses a line integral averaging scheme then one can formulate an expression for relative to the appropriate reference value as an integral like equation (1), but with . The benefits of this approach are twofold: By performing the line integrations and averaging analytically we are able to construct practical estimators as simple discrete sums over the background galaxy shear estimates, so with this method it is relatively straightforward to obtain rigorous estimates of the statistical uncertainty in the reconstruction arising from random intrinsic ellipticities. Second, the analysis reveals how problematic boundary terms (-function terms in the kernel ) inevitably arise if one restricts the reference region geometry to a 1-dimensional line, and how they can be avoided.
Another inversion algorithm has been proposed (Seitz, S., & Schneider (1995)) that is not only unbiased, but also attempts, in some sense, to minimize the contribution due to noise. Since the gradient of the shear is related to , in the absence of noise, the curl of should be zero. In practice, noise adds a rotational part to the surface density gradient and the Seitz & Schneider algorithm attempts to minimize this. We show however that this technique also gives rise to boundary terms which tend to inflate the noise in the reconstructions and give quite similar results to other methods that give large weight to galaxies near the boundary.
In §3 we develop a new discrete Fourier transform based inverse gradient operator which can be implemented with an fast Fourier transform (FFT). Because of periodic boundary conditions, applying the familiar algebraic inverse gradient operator (or its generalization for finitely spaced data) does not recover the true surface density from . In fact, for zero padded data, one recovers precisely the bias inherent in the original KS93 method. We show how to remove this bias and derive a Fourier-space inverse gradient operator which exactly recovers a scalar field from its gradient. Unfortunately, this method does not seem to be optimal in terms of its low frequency noise, but the method has the advantages that it is simple, fast, and can readily be extended to apply in the non-linear regime where the data provide one with a map of (where the low-frequency noise is not an important issue).
Fourthly, we consider regularized inversion methods for constructing the surface density. In general terms, this approach arises from fitting a series of general models for the underlying surface density and attempting to determine which the most probable model for the true surface density, given a particular set of observations. This style of approach leads to two difficulties. First, if we fit a model with only a few free parameters, then we severely restrict the reconstructions to some basic forms – in effect the reconstructions will reflect our prejudice for what we expect rather than allowing the data to determine the surface density. However if we allow the model to be very general, then we are essentially introducing a large number of free parameters and the inversion become ill-conditioned. We pursue this scheme of many-parameter inversion in §4.1 and §4.2 and explore two methods to regularize the inversion based on the maximum likelihood and maximum entropy techniques.
The foregoing analyzes yield several estimators all of which are unbiased. We address the question of what estimator is most desirable in practice in §5. They are really precisely equivalent for perfect data, and the only rationale for choosing one method is how well it performs with real, noisy data. For any particular quantity one chooses to measure from a reconstruction the question is well defined and one can objectively determine the best solution. The problem is deciding what are the quantities of interest, which is a somewhat subjective issue. Here we focus on the low frequency noise in the reconstructions. This seems reasonable since the whole purpose of these modifications to equation (1) is to cure the bias which is essentially a low frequency phenomenon. To explore this we first make simulated reconstructions using a variety of geometries. We then make a more objective and quantitative comparison by seeing how well these methods perform for particular low-frequency measurements.
In §6 we derive some useful results for estimating the mass within an aperture. While this can be done by performing ‘aperture densitometry’ on the reconstruction, we show that with a simple modification of formula for one of the direct reconstruction methods, one can measure the aperture mass as a single summation over the shear estimates. This greatly simplifies the estimation of the statistical uncertainty. How to do this for a circular aperture has been described elsewhere (Kaiser et al. (1995)) and here we generalize this to obtain a useful bound on the mass within apertures of arbitrary shape.
Finally, we consider what appears at first sight to be a quite different approach to this problem. Gauss’ law in 2-D equates the mass inside a loop and the integral of the normal gravity around the loop. Since the shear is the spatial derivative of the gravity one can thereby derive an expression for as a certain integral of the shear around the boundary. This provides a generalization of equation (4) to non-circular loops. Our hope was that this would give a different estimator — the construction we use in §2 being highly and arbitrarily restricted to averages over straight line integrals — but it turns out that the result is exactly equivalent to our case-b estimator (see below) and so we consign this to an appendix.
2 Finite Field Kernels
From equation (3) we see that it is technically possible to determine at any point relative to the value at some arbitrary reference point simply by performing a line integral of the observable . Clearly then, one could recover by simply averaging over radial lines from the boundary of the observed region, as suggested by Kaiser et al. (1995) and illustrated schematically in Figure 1a, and an algorithm to implement such a scheme was developed by Schneider (1994).

Schneider’s algorithm evaluates the line integrals numerically. To do this the shear estimates are first binned into grid of cells and then smoothed. The gradients of the shear (and hence gradients of ) are approximated by discrete differences on the smoothed shear field and is then numerically integrated along a family of lines extending from each point on the plane to the boundary. Now the geometry for the line integrals is actually slightly different from that shown in Figure 1a, but shares the key property that the boundary points are the same for each target point so, for perfect data at least, this procedure should generate an exact and unbiased reconstruction.
The bias in the low spatial frequency behavior in the KS93 estimator is a real problem — especially if one is interested in the mass profile in the outer parts of cluster — and Schneider’s algorithm is an interesting attempt to avoid this, but it has one somewhat disturbing feature. The line integrals of gradients of the shear give rise to integrals of the shear plus boundary terms. In the averaging over lines, the former become two dimensional integrals which are very similar in form to the convolution integral in equation (1), and are relatively straightforwardly implemented as discrete sums over galaxies. The latter, however, become line integrals of the shear around the perimeter. As we will see, these make an important contribution, especially to the low frequency components of the reconstruction, but they are very difficult to estimate reliably. The problem is that if the shear is smoothed then its value at the boundary will tend to be biased. On the other hand, if the smoothing radius is taken to be very small then the boundary shear must be estimated by averaging over a small number of galaxies and this will inflate the statistical uncertainty in the reconstruction.
As discussed elsewhere (Kaiser et al. (1995)) there is a simple yet general relation between the mean tangential shear around a circular loop and the mean surface density within that loop. Defining the tangential shear as — it measures the stretching of the galaxies along the loop — and the mean interior surface density as , one finds
| (4) |
This is easily derived from Gauss’ law (see appendix A), and can been used to estimate the mass within a circular aperture (Fahlman et al. (1994)). If we simply evaluate out to some radius we obtain the surface density at the origin minus , the mean over the disk. Now by definition , where denotes the mean of on the loop, from which it follows that . Comparing with equation (4) we can see that if we were to change our reference surface density from to the only effect is to introduce the pure boundary term .
Our analysis shows that it is technically impossible to measure the surface density relative to the mean on a boundary of infinitesimal width — which is perhaps hardly surprising — but allows the possibility that one measure relative to a well defined reference strip of thin but finite width, which would give an approximation to Schneider’s method but without the bias, or any similar alternative such as Figure 1b.
In this section, we construct expressions for as averages of line integrals of from a set of points uniformly distributed over some reference region for the various geometries illustrated schematically in Figure 1 (although the square geometry is only illustrative and the analysis below applies general survey geometries). Then, using equation (3), we obtain explicit expressions for as some integral over the shear field which can then readily be converted in §2.5 to form practical estimators of given a set of shear estimates.
2.1 case a:
We first construct an estimator for where is the mean surface density on the boundary of the data region. Place the origin of coordinates at the ‘target point’ where we wish to measure . Let the boundary of the region on which we have data be , parameterised by azimuthal angular coordinate . We will assume that the entire boundary is visible from any interior point where we will attempt to estimate . The mean of on the boundary is where , with the length of the perimeter, with tangent vector . Taking the average over radial paths to the boundary as in Figure 1a we find
| (5) |
Substituting equation (3) for and integrating by parts to express everything in terms of rather than its derivatives we obtain
| (6) |
where
| (7) |
where we have defined the differential operator
| (8) |
and where the loop integral is taken around the perimeter with
| (9) |
With the origin placed at the center of a circular survey region we recover the KS93 kernel and, as expected, the surface term is just the mean tangential shear on the boundary. Equations 6, 7, 9 provide the generalization for points off the axis and/or non-circular survey geometries.
This is clearly very similar to Schneider’s method. Let us clarify this. His method consists of two sequential operations on the data. The first is the smoothing of the shear field to produce a fine grid of values. The second consists of differencing these binned values, grouping the various components together to make and then integrating. Let us ignore the smoothing for now. Now the second step is just some linear operation on the input grid of shear values, and could be written out as a linear sum: . What we have done above is to explicitly calculate the coefficients in this sum. Now in fact Schneider measures relative to a slightly different average on the boundary, and uses a slightly different geometry for the rays along which the line integrals are performed, but these are irrelevant details. The worrying thing which emerges from our analysis is the presence of the boundary term, which means that the grid points on the boundary receive a very high weight in this sum. Now as we have seen, the contribution of this term to is on the order of the mean shear on the boundary, which is roughly equal to , so clearly the contribution to the low spatial frequency components in the reconstruction from this surface term is substantial, and since the goal here was to fix the bias in the low-frequency behavior of KS93, it is important that the method get this right. It is hard to see how this can be, since if the shear field is smoothed then the value on the boundary will be biased. One the other hand with a small smoothing length the boundary term must be calculated by averaging over a small number of galaxies and this will inflate the statistical uncertainty.
2.2 case b:

Let us now construct instead an estimator of ; where the zero-point is now set to be , with . Taking the average over radial lines to the origin from each point within the survey region, as illustrated in Figure 1b, we have
| (10) |
This is very similar in form to equation 5, but now the function is replaced by the function which vanishes on the boundary, so substituting from equation (3) and integrating by parts we obtain
| (11) |
where now
| (12) |
but no boundary term.
A geometric picture of this kernel may be obtained as follows: In polar coordinates () we find where , is the 2-dimensional rotation matrix and, since , we have with . Now from inspection of Figure 2 one can see that , and the perpendicular distance from the origin to the tangent is , so we find where the ‘unit polar’ is defined to be
| (13) |
and hence
| (14) |
This is very similar to equation (1). Both equations ‘project out’ a particular component of the shear. In equation (1) this is simply the tangential shear; i.e. the stretching perpendicular to the line from the origin to the measurement point. In equation (14) the component projected out measures the stretching along the direction which bisects the normal to the vector and the boundary tangent direction. The orientation of is shown in Figure 2.
2.3 case c:
We can now readily generalize this analysis to the case where the reference region does not fill the entire data region or has some complicated geometry so that lines from the target point may pass in and out of the reference region, perhaps many times. If we think of the ends of the lines in Figure 1b,c as lying on a unit spaced regular 2-dimensional grid (and let the unit length be very small) then is just the sum over line integrals. Clearly, if we excise part of the reference region say, we must simply remove the contribution from all the paths which originate in the excised region. In the general situation a line from the target point (with some given azimuthal angle ) will pass through the boundary of the reference region (which need not be simply connected) at points . Let the points be sorted in order of increasing distance so the most distant point is . The mathematical expression of the subtraction described above is the generalized kernel
| (15) |
where , and and where is the Heaviside function. The surface density is then given by equation (11) as before, but with now the area of the reference region.
This is illustrated in Figure 3 for the case of a simply connected reference region which only partially fills the region on which we have data. If the target point lies inside the reference region (upper plot) then the line through crosses the boundary just once and we have
| (16) |
If the target point lies outside the reference region then either the line from though misses the reference region completely (in which case ) or it crosses it twice at and as illustrated in the lower panel, and we then have.
| (17) |
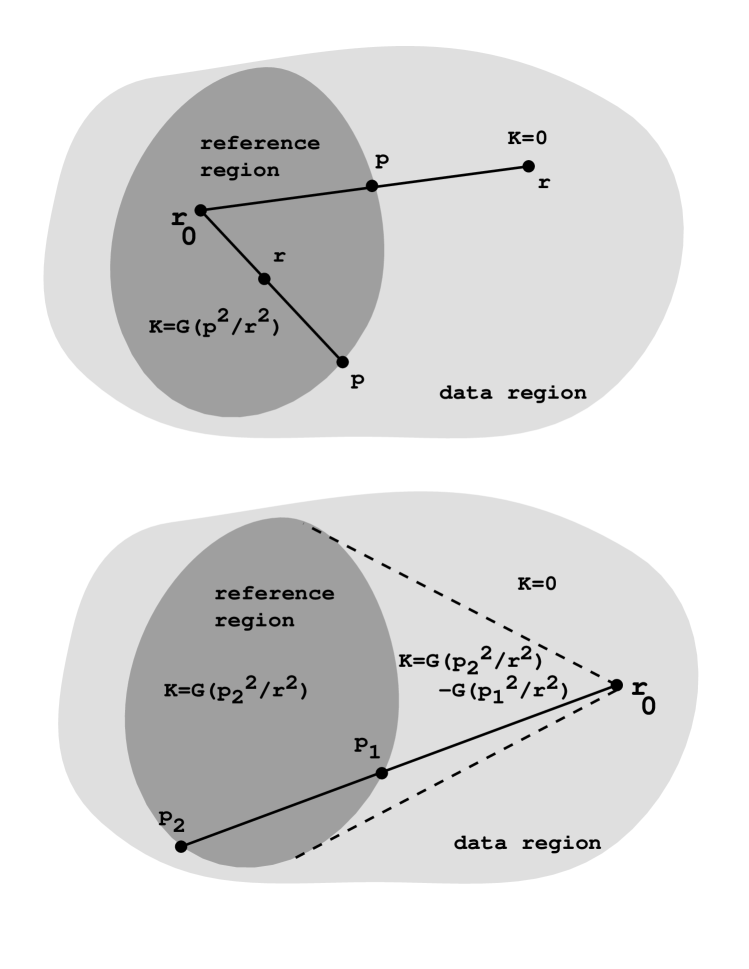
We can now easily construct the kernel for case-c, where we have two nested boundaries; we simply subtract the kernel calculated as above for the inner boundary from that for the outer. This also allows the possibility that the outer boundary might lie inside the actual data boundary. Case-c approaches case-a in the limit that the reference strip is infinitesimally thin. If we use a narrow but finite width strip we should obtain something very similar to case-a, but without the bias inherent in Schneider’s method.
These formula were derived for the special case where the spatial origin coincides with target point. For a general choice of origin we have
| (18) |
where, for case-b for example, , where we have explicitly shown the dependence of the boundary point on the target and measurement points.
2.4 Example Kernels
An illustrative and interesting case is that of the case-b kernel for a rectangular survey geometry. Erecting lines from the target point (the point at which we hope to measure ) to the corners of the rectangle divides it into N,S,E and W quadrants. From equation (14) we find, in the N and S sectors respectively, where is half height of the rectangle, and . Similarly, for galaxies in the E and W sectors we have and where is the half-width. This kernel, is shown in the Figure 4 for various target positions. The pattern is qualitatively similar to the KS93 kernel, which is also shown for comparison, but now depends in a non trivial way on . Note also the discontinuity along the divisions between the N,S,E,W sectors. As we will see, these give rise to spurious, but essentially harmless, linear features in the reconstruction.
Also shown in Figure 4 are the kernels for the case of circular reference region lying within the survey region (assumed square for simplicity). If we define , and where is the radius of the survey and let then for case-b, setting and dropping primes we have
| (19) |
These formulae are only valid if both target and observation point lie within the survey disk, and must be modified if the target or observation point lie outside as discussed above.
The case-b and case-c circular kernels are in each case very similar, and the main difference is just the extra term around the annulus. As one makes the width of the reference region smaller the kernel in the annulus increases in inverse proportion and so, in the limit of a very thin annulus we end up giving infinite weight to the infinitesimal number of galaxies lying in the annulus.
2.5 Practical Estimators
Given a catalogue of background galaxy ellipticities which, suitably defined (e.g. Kaiser, Squires & Broadhurst (1995)), give a set of estimates of at their locations , we can form the estimator
| (20) |
whose expectation value is just minus the appropriate reference value, and where are a set of weights that we can tune to optimize performance. Alternatively, one could bin the galaxies on some grid, calculate the mean shear estimate for each bin, and then evaluate as a discrete sum with appropriate weights. These two approaches are equivalent in the limit of small bin size. For uniformly sampled points (say on a fine grid) the weights should clearly all be equal. Given some random realization of background galaxy positions the constant weight estimator is no longer ideal: the kernel we are effectively applying is which differs from the true kernel because of the fluctuating density of the background galaxies. A uniform weighting scheme therefore introduces a multiplicative element of noise, which can be removed by weighting each galaxy in inverse proportion to the local density of neighbors. However, the additive error arising from the random intrinsic ellipticities will consequently increase. The optimum weight therefore depends on signal to noise, with constant weight preferred in low signal to noise situations. For typical clusters the distinction between these is minor as to get into a regime of high S/N one really has to look at large-scale features and then the Poissonian fluctuations in the background galaxy number density are small. Henceforth we will consider the uniform weight estimator
| (21) |
What about allowance for contamination by cluster galaxies? If one assumes that they simply add a randomly oriented component to the background galaxy population then one should simply use equation (21) as it stands but with determined away from the cluster. If, however, the light from the cluster galaxies masks a significant fraction of the background galaxies one should boost the weight given to the surviving galaxies by an appropriate amount.
Note that all the the kernels are strongly divergent at , naively suggesting a logarithmic divergence in the kernel integral if we simply count powers of . However, this divergence is not real. Consider the case b kernel given in equation (12). If we make a Taylor expansion of about the origin then it is only the zeroth order term which threatens to produce a divergence, gradients or higher order terms being clearly convergent. For = constant, we can integrate equation (11) by parts. If we restrict the integration to some patch around the origin we find
| (22) |
This is a boundary term which vanishes identically if we take the boundary to be = constant. Thus, if we define the integral in equation (11) as the limit as of it is then clearly non-divergent.
A closely related issue is the question of noise in the surface density estimator given in equation (21) arising from the divergence of the kernel. The reconstruction is the sum of random ‘shots’ convolved with the kernel, now considered a function of . Clearly, if we make an unsmoothed reconstruction we will find divergent ‘butterfly’ patterns at the location of each galaxy. In the case of the KS93 kernel it is easy to see that this noise is a purely high frequency phenomenon and goes away on smoothing the final density field. The reason for this is that the kernels , vary as , so the coupling to long wavelength Fourier modes is highly suppressed. Here essentially the same is true, but we have to be a little careful. In the KS93 estimator one can simply soften the divergence by replacing for some tiny softening length which merely suppresses overshoot in the computer. Were we to do that here, there would be a divergent coupling to low frequency modes because of the asymmetry of the kernel pattern which, in reality, would be cut-off by the finite pixel size in the reconstruction. The answer is to soften the kernels by multiplying by some function where is a small parameter and where for and for (the function used in the simulations shown below was ). In principle, the long wavelength behavior of the reconstruction should be independent of the parameter provided it is ‘sufficiently small’. A slight technical problem with this is that the scale length of the softening becomes small for those galaxies near the boundary and so quite a small pixel size is required in order to resolve this properly.
2.6 Minimizing Noise Contributions
Another way of approaching the problem is to notice that from equation (3), = 0 in the absence of noise. Hence for real, noisy data, a sensible suggestion is that the rotational component of the gradients of the shear field should, in some sense, be minimized. Seitz and Schneider (1995) show that by adopting two reasonable assumptions: 1) the rotational component should vanish if the shear is a gradient field and 2) there is no systematic rotation over the data field, then there is a unique specification for decomposing the gradient of into a gradient and rotational part. The details are involved but the main result is that this gives an expression for in the familiar format as a convolution of the gradients of the shear with a kernel:
| (23) |
where is defined in equation (3).
The problem arises when we attempt to express this with respect to the shear, instead of its gradients. In solving for the kernel, Seitz and Schneider are effectively solving a Neumann problem, where the kernel is a gradient vector field with on the boundary, and where is the unit normal to the boundary. Integrating equation (23) by parts, we obtain an estimate for the surface density as a convolution of a kernel with the shear estimates plus a boundary term, much like our case-a estimator.
One might expect then, that the limitation of this method is very similar to the case-a estimator (or thin reference region case-c): to estimate the gradients of the shear field, it is necessary to introduce some smoothing. This will bias the estimate near the boundary, or inflate the noise if the smoothing is reduced. The latter is particularly problematic. The presence of a boundary term tends to give very large weight to a few galaxies near the boundary and this introduces a worrisome low frequency fluctuation in the reconstructions - yet it was just this feature we are attempting to reduce in considering alternatives to the original KS93 estimator. We return to this problem more quantitatively in §5.2.
3 Direct Fourier Reconstruction
We can construct a binned estimate of by binning values on regular grid and then discrete differencing. Hence we can obtain binned estimates for , via equation (3). The finite field methods have attempted to determine by averaging over line integrals. An alternative method to determine is obtained by using Fourier transforms. The clear advantage here is that the gradient operator in real-space becomes algebraic in k-space. An added bonus is that fast Fourier transforms are computationally cheap to perform so the inversion is easy to do numerically. We display such an implementation scheme here.
Consider first, for clarity, a 1-dimensional process, and imagine we have some discrete process (this might be a discretely sampled continuous field: ) and make the discrete difference
| (24) |
Now we can construct the Fourier transforms (FT) of , , for any samples of finite length :
| (25) |
The question is, how are and related? In particular, if we are given the latter, can we recover the former?
Now for continuous fields , , the derivative operator in Fourier space is just multiplication by , so we recover the FT of by dividing FT of by . This is not defined for , so this tells us we can not recover the DC component – again, this is not problematic as the DC level can not be determined from shear measurements alone in any case.
It is well known that with for discrete FTs the discrete difference operator is multiplication by rather than , but there is a little more to it than that because of the periodic boundary conditions: if one simply multiplies by then one obtains the FT of the derivative of but taken with periodic boundary conditions which differs from the real discrete derivative of at the end points.
The actual relation between and is easily obtained:
so the solution of our inversion problem is
| (26) |
As before, this is not defined for , but also differs from usual formula for . One way to implement this is simply to modify , the last element of the array, to be minus the sum of the other elements. That is, we construct
| (27) |
which then has discrete transform .
The above analysis can be extended to the case of 2 dimensions, as is applicable for our problem. We can estimate directly from the data the two partial derivatives and and, in principle, we can use either to estimate . Fourier transforming, we obtain two measures of :
| (28) |
As with the KS93 method expressed in Fourier space these two estimators have noise which varies strongly with direction in -space, so we combine these with weights , , which, for high frequencies at least, gives the optimal combination:
| (29) |
It is very simple to implement this technique. One simply bins the shear estimates onto a grid (this can be very fine as the FFT is very fast, and the fact that most of the grid cells are actually empty causes no problem). We then apply the two discrete difference operators to this grid of shear values and then combine the gradients according to equation (3) which, for a very fine grid, produces an image (or rather pair of images; one for each component of the gradient) which is largely zero and has a little L-shaped pattern at the location of each galaxy and we then simply apply the FFT, calculate according to the two equations directly above, and then inverse transform. The results from this are very hard to distinguish visually from e.g. our other best methods, but, as we shall see, the noise power analysis suggests that the low-frequency performance of this method is somewhat worse than the best methods.
Doing the inversion in Fourier space also leads to the attractive possibility to perform the non-linear lensing inversion. It is possible to construct the quantity from observable quantities (Kaiser 1995), in exact analogy with equation (3). Thus simply replacing by in the equations above gives a prescription for doing the inversion, even in the non-linear regime.
4 Regularized Inversion Methods
From the finite field ‘direct reconstruction’ methods, we obtain the estimate as a simple convolution of the data with some geometric kernels. This is guaranteed to be numerically stable and unbiased and has well defined and calculable noise properties. These are all nice features but the methods explored all presuppose that we have uniform sampling of the data. If one has highly inhomogeneous sampling (and perhaps large holes in the data), one could imagine modifying the estimators derived here by bending the paths to avoid holes or noisy regions, but it it not clear that this is the best thing to do. A closely related issue is that we have concentrated on using the shear data on some area to determine on the same region, yet (as our aperture mass statistics clearly show) the shear is also rich in information on outside the data region.
A quite different approach that can address the above problems is to attempt to find the most probable solution for the underlying surface density, given the set of observed shear estimates. To determine this, we construct the log-likelihood of a model . An apparent problem is that is determined in part by values outside the grid. One solution would be to extend the model to include more grid points, but this is somewhat costly. Here instead we exploit the local expression for in terms of in equation (3)
For a field which is smooth on the scale of the grid, a grid of estimates of (obtained from the measured shear values by applying an appropriate discrete difference operator form of the rhs of equation (3)) should be equal to the same operator applied to the model -grid with gaussian distributed, but non-trivially correlated, gaussian residuals. What we are doing is using the discrete difference form of equation (3) to project from the data that part which is locally determined, and then solving for the most likely -configuration assuming we were provided only with this reduced from of the data. We present two methods to do this. In §4.1, we calculate the most probable field assuming a gaussian prior. This is similar to the method applied by Kaiser and Stebbins (1991) to reconstruct the local density field form peculiar velocity data. We also reformulate in real-space the problem in terms of a standard maximum likelihood analysis in §4.2.
4.1 Maximum Probability Method
We approach the problem from the following perspective: given a set of observations (e.g. shear estimates for galaxies), we want to fit a model for the underlying surface density. To be physically useful, the model must be as unrestrictive and general as possible. We take
| (30) |
where we assume the surface density is periodic inside some box of side L – this is nonrestrictive as we can always zero-pad our data region to impose periodic boundary conditions. Allowing Fourier modes in our model, we rewrite equation (30) as
| (31) |
We have complete freedom in determining to Fourier coefficients . A standard approach is to find the most probable set given the observed data. This implies we minimize
| (32) |
with respect to so that
| (33) |
for which labels the two shear components. This becomes a matrix equation where is an matrix and is a vector of length . To solve for the maximum likelihood , we need to invert a matrix, which, in general, will be singular for any reasonably large number of k-modes.
We regularize this inversion with a solution in the style of maximum entropy reconstructions. The probability of the model given the observed data and some prior information is
| (34) |
and we want to maximize the probability to determine the “best fit” model for . This analysis yields the same equations as before but we including some prior knowledge to constrain, and hence regularize, the solutions. For Gaussian uncertainties of the measurements, the first term on the rhs of equation (34) is as before
| (35) |
We take as our prior model the assumption that the Fourier coefficients are drawn from a Gaussian distribution with a power spectrum . This adds a diagonal strip to the matrix equation so that
| (36) |
and hence the matrix inversion is non-singular for an arbitrary number of Fourier modes.
This is very similar in spirit to the maximum probability reconstructions of the density field from peculiar velocities employed by Kaiser & Stebbins (1991). We adopt a white noise power spectrum – this is often viewed as a maximally non-committal choice – and allow the amplitude to be a varying parameter. Setting large amplitude for the power (i.e. large ) corresponds to little regularization, while a small power amplitude tends to heavily bias the recovered signal downwards. The optimal amount to use is determined empirically. We run extensive simulations for a given to test the sensitivity of the reconstruction to the amplitude of the power selected. We find that there is a plateau where the reconstruction is insensitive to the input power (the reconstruction is stable to variations about this amplitude). This is a very nice feature as we can tune the regularization so that the inversion is well behaved, yet we are not forcing the solutions to some particular form by the choice of our prior.
4.2 Maximum Likelihood Analysis
We now construct an algorithm in real-space to calculate the maximum-likelihood -field configuration (considered as a grid of values) given a set of shear estimates binned on a similar grid. We present the simple problem where we are given a binned set of shear values with equal noise. The generalization to unequal noise is straightforward and is not presented here. As before, we need to construct the log-likelihood , exploiting the local relationship between and observable shear estimates.
We write the shear-vector estimates as the matrix where labels the shear component and which ranges from to is a compound index labeling the position where and where the individual coordinate indices are and . Similarly we denote the model grid of surface density values by the vector . However, since the discrete differencing will only determine modulo an additive constant we make of dimension . This effectively forces the corner element to be zero, though one is free to adjust the zero-point after the reconstruction to any chosen reference value.
There are several possible ways to implement the discrete differencing operator. We will use
| (37) |
where the derivative fields live on an interleaved grid with , and where
| (38) |
The discrete difference form of the rhs of equation (3) is
| (39) |
or with
| (40) |
while the lhs is , with the summation extending from to .
The correlation matrix for the residuals is defined as
| (41) |
and is easily calculated since in the absence of any distorting influence (and assuming Gaussian distributed independent errors on the shear-vector estimates) so
| (42) |
and so the log-likelihood is
| (43) |
where we have defined the matrix .
Minimization of wrt results in where and where we have defined and
Unfortunately, the matrix is singular; it has a null space consisting of quasi-oscillatory vectors, any combination of which dotted with A on left gives zero on the rhs. Adding a 9-point Laplacian Tickhonov-Miller regularization (see Num Recipes, 2nd ed; chapter on inverse methods) seems to solve this nicely. We now maximize i.e. we add to the ‘chi-squared’ an extra term consisting of some multiple of the variance in the 2nd derivative field , and we now obtain the matrix equation
| (44) |
where is the “trade-off parameter” and
| (45) |
is the Laplacian smoothing operator (we define for all grid points , but for for points on the perimeter, where the sum in equation (45) would extend outside the grid, we set ).
The effect of the regularization is to suppress the spurious ‘null-modes’ which have strong high frequency components. The trade-off parameter, , can be thought of as a dial that either makes the solution very smooth (for large ), or allows the solution to fit all of the data points (for small ). For practical implementations, one wants to choose some intermediate regularization that fits the data acceptably well, while smoothing out some of the noise fluctuations and conditioning the inversion process. In simulations, we find that for the result is a heavily smoothed reconstruction. For small , the inversion is somewhat insensitive to the precise value (unless it is so small that the matrix inversions blow up). This is an important feature – the answers given by this method will not be prejudiced by any reasonable choice for the regularization, and the user has some freedom in setting this parameter.
5 Noise Properties
So far we have constructed a whole family of estimators which all, given perfect data, return an exact reconstruction of the density field. The finite-field kernels each measure relative to a different baseline, but are all really equivalent since we can always add any constant we like to force a particular normalization after the fact. For example, you might particularly want to measure the surface density in some region relative to its value in the reference strip shown in Figure 1c. You could of course use the case-c estimator without further ado. You could equally well use case-b, measure the value of the reconstruction in your chosen strip and then readjust the baseline. If this gives an estimate with lower statistical uncertainty then you should do so.
Our estimators are weighted sums of observed background ellipticities; we think of each galaxy giving a noisy estimate of the shear at its location, the noise arising in part from the random intrinsic ellipticity and in part from the measurement error. The statistical uncertainty depends on how the weight is distributed among the background galaxies; generally speaking, the more uniform the weight the smaller the statistical uncertainty. Clearly the kernels are always rather sharply peaked towards the target point. This generates a divergence in the kernels. This is a common feature for all the methods and is also largely irrelevant since, as discussed, it generates predominantly high frequency noise which goes away when we smooth. Here we are more interested in the low spatial frequency behavior of the reconstruction since this is where the bias appears in equation (1). For random background ellipticities the reconstruction will be a superposition of ‘inverse kernel’ patterns. The low-frequency behavior of these patterns is somewhat different for the different methods. In case-c type methods, for a narrow reference strip, the galaxies in the reference region receive rather large weight, becoming infinite in the limit as the width tends to zero. Moreover, the value of the kernel in the annulus depends only weakly on the target position provided the target point is not close to the edge. Thus we would expect that for a random realization of reference annulus galaxy ellipticities one will generate a noise fluctuation of random amplitude, but which will be rather coherent and flat in the center of the reconstruction.
5.1 Simulations
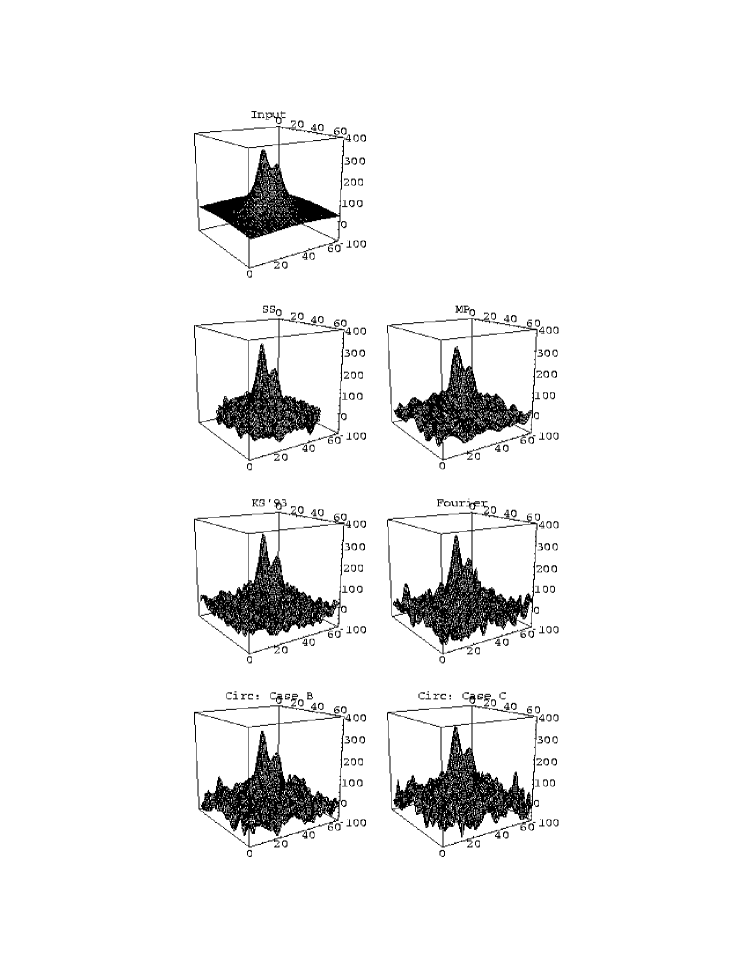
As a first, qualitative test we can compare reconstructions made with simulated data. To make these simulations we generate random Gaussian variates , for randomly scattered galaxies. The rms 1-component shear error is . This seems to be quite a good value, determined observationally from field galaxies. We then add a small systematic shift calculated for a particular lens model. We place the cluster at z = 0.2 and the galaxies in a plane at z = 0.9. We display the reconstructed surface density using the various methods in Figure 5. All of the reconstructions have been smoothed with a 2 pixel Gaussian. The algorithm of Seitz & Schneider was employed using circular geometry for calculational ease.
Surprisingly, the bias in the original KS estimator is not very strong - even though the input mass distribution is not axisymmetric- and the bias seems only appreciable in the very corners of the reconstruction.
The results are all somewhat similar in the signal recovery. Of course, the overall amplitude of the case-c type estimators is higher than for case-b but this is irrelevant as the baseline surface density is unmeasurable from the shear measurements alone. However, the the noise properties vary significantly among the methods. With the case-c estimator, the presence of the boundary term in the reconstruction gives rise to much higher noise, especially near the edge of the reconstruction. The same is true for the Fourier method. Qualitatively, one favors the methods that have the smallest noise fluctuations and the case-c estimators seem to perform the worst in these simulations.
While these simulations are very simplistic, they are indicative of the type of behavior we expect. The various estimation techniques are all very similar in the signal they recover. However, the case-c type estimators – estimators with boundary terms – tend to have the most obvious worrisome noise properties. In the next section, we explore this more quantitatively by calculating the statistical properties of the noise for the various types of estimators.
5.2 Noise Power Analysis
For sufficiently high galaxy number density we expect that the noise will approach a Gaussian process by virtue of the central limit theorem. In that limit everything we need to know about the noise field is encoded in its power spectrum or autocorrelation function. As discussed, we are primarily interested in the performance of these methods for recovering low frequency signals. We do this in two ways: the first is to calculate the noise-power for the various methods, and the second is to calculate the variance in a specific ‘aperture mass’ statistic.
To estimate the noise power we have generated a large number of realizations for randomly oriented galaxies. For each of these we estimate the power and then average the power over the realizations. In doing this we came upon a slight technical problem; all of the finite-field methods tend to produce ‘hot-spots’ around galaxies close to the edge of the survey region. These tend to be worse for the case-c type estimator, but are present in all cases. If we naively measure the power over the whole survey area we find that these leak though into the low frequency modes (this is partly due to lack of resolution but is also partly a real, resolution independent, effect), artificially enhancing the low frequency power. This is somewhat discouraging, since the motivation for developing these methods was to cure the bias in the KS93 reconstruction, and we seem to have exchanged this for a lack of precision.
To make a meaningful comparison we have cropped each image to remove a strip 16 pixels wide around the edge. The low-frequency noise power is shown in Figure 6. For each finite-field method we have chosen two different values ( and ) for the softening parameter . As expected the low-frequency power is very insensitive to (provided it is small at least). We have also calculated the noise power using the maximum probability method with , and two amplitudes of the power amplitude that vary by a factor of five. We also display the results using the maximum likelihood method using trade-off parameters and .
Our calculation of the noise power spectrum differs from that of Seitz & Schneider. In Figure 3 of their paper they make a similar attempt to calculate the noise power spectrum. Their results are puzzling however. For the original KS93 estimator, we expect for a pure noise field. Seitz & Schneider plot , which, judging from the points in their Figure, varies as for long-wavelengths. Indeed all of the power spectra they calculate seem to diverge for long wavelengths. One explanation of this may be the lack of resolution in their simulations. As we discussed before, the finite-field kernels have a divergence and a softening of this divergence is required. With coarse resolution, the dependence in the kernel is not sampled finely enough and there is a leakage into the low frequency power. We find that for all of the methods, it is necessary to use much finer resolution to compensate for this effect. Indeed, when we employ the same resolution they used, we reproduce their curves. With finer resolution however, we obtain somewhat different results.
The main difference among the noise power in all of the methods is that the estimators with boundary terms have a much noisier zero-frequency component. This is present in the case-c estimators and the Seitz & Schneider algorithm. As discussed, this is because the small number of galaxies in the annulus give a random fluctuation in the reconstruction which is nearly independent of target position. This is rather interesting. One motivation for choosing a case-c type estimator is that for a monotonic cluster profile one would expect this estimator to give a higher signal. What we are finding is that the price for this is increased noise, so this is largely counterproductive. Similarly, the presence of the boundary term in the Seitz & Schneider algorithm introduces a large fluctuation in the long wavelength noise power.
The maximum likelihood direct reconstruction method has behavior similar to the other methods at high frequencies. The obvious difference in this method is the presence of an enormous and very rapid divergence at small wavenumber. This suggests that for a pure noise reconstruction, the most likely solutions determined for the inversion are models with a large low frequency components. While a model with, for example, a gradient across the field seems very unlikely, this seems to be telling us that it is more likely than any other. This reflects the role of the trade-off parameter in our regularization – we can adjust it so that the reconstruction is either very smooth (large regularization) or, at the other extreme, returns a model that fits each and every data point (and hence has large variations). What we find is that for a broad choice of trade-off parameters, the result is very stable and relaxes to a model with long wavelength fluctuations. Dialing down the trade-off parameter to attempt to reduce the smoothness imposed on the inversion yields no improvement – the inversion becomes ill-conditioned.
The Fourier method has, not surprisingly, a long wavelength fluctuation as well. This simply comes from the fact that we are altering the data to overcome the periodic boundary condition problem. We have experimented with cropping the reconstruction area to attempt to remove this boundary effect and indeed find some improvement. However, there is some leakage into the long wavelength modes for any reasonable trimming.
The behavior of the maximum probability method looks most promising. We see that for reasonable regularization, we obtain a flat noise power spectrum with the lowest amplitude of all the methods considered here. It is important to get the regularization correct as we see from the top curve in the maximum probability noise power spectrum – with too little amplitude in the prior power, the low frequency modes are amplified. However, for any given data set with some specified geometry and number of galaxies, we can determine the required regularization empirically so that the inversion is well behaved with no bias in the recovered signal.

6 Aperture Mass Measurement
Two-dimensional images of the mass distribution are nice, but sometimes one would like to estimate some gross property such as the mass contained within a given aperture. Now one could always take the reconstruction, and integrate over the area in question, but then calculating the statistical uncertainty would seem to be a complicated business, particularly if the reconstruction is smoothed. In fact one can construct statistics which measure the mass within an aperture with a single summation over the galaxies. This is simpler, and has correspondingly simple statistical properties. Moreover, these statistics can be designed to use only the data outside the aperture, which is useful if one wishes to minimize the contamination of the background galaxy population by faint cluster members, or to avoid regions where the weak shear approximation may not be valid.
As discussed in the introduction, from equation (4), the integral in equation (1) truncated at inner and outer radii , , is equal to ; if we make large this will tend to , and in general gives a lower bound on . This statistic is quite different in nature from equation (3) which shows how observations on some region determine the surface density on the same region (modulo a constant). Here the statistic measures, or places a bound on, the mass in some region with observations taken outside that region.
As we show in appendix A, one can derive equation (4) from Gauss’ law. This gives the mass within an aperture as the integral of the normal component of around the aperture boundary, while the shear measures second derivatives of , so it is not surprising that if we differentiate the mass enclosed with respect to the aperture radius this picks out some average of the shear on the boundary. Here we will first derive equation (4) from equation (14) and then generalize it to non-circular apertures.
If we take a circular survey of radius and place the origin at the center then and , so and equation (14) becomes
| (46) |
so for concentric disks we find
| (47) |
where and which gives a rigorous lower bound on the mass interior to , or, in differential form,
| (48) |
which is equivalent to equation (4).
Now can be thought of as a smoothing of with a top-hat window function, and is a compensated top hat filter. A general circularly symmetric smoothing of can be expressed as
| (49) |
with
| (50) |
To verify this result, integrate the lhs of equation 49 by parts to obtain an integral involving and then integrate by parts once again and replace derivatives of by using equation (48).
Equation (50) provides a simple way to construct the KS93-style estimator for an arbitrarily smoothed reconstruction. Note that even if has compact support will still have an extended tail unless vanishes — i.e. unless we have a compensated filter.
The argument leading to equation (47) also works for non-circular apertures. The key point is that the form of the kernel in equation (14) depends only on the shape of the boundary, so if we consider two nested boundaries of the same shape and orientation and take the difference in their values there is exact cancellation within the inner boundary curve and the result will only depend on the data between the curves. If we let the outer boundary be and the inner one be with scale factor , then
| (51) |
where is the area inside the boundary , or in differential form
| (52) |
where the averaging is understood to be over the thin ribbon separating two neighboring self-similar curves curves.
It is straightforward to generalize the aperture mass statistic to inner and outer curves of different shapes; simply choose some point within the inner aperture as origin, evaluate equation (14) for the two boundaries and take the difference, but the resulting statistic will now depend on the data within the inner aperture.
7 Discussion
We have explored the problem of reconstructing the surface density by direct and regularized inversion methods. The direct methods employ averaging over line integrals of the shear gradients exploiting equation (3). While we have restricted attention to straight lines, there is still a wide range choice in the geometry of the reference region. By performing the integrations by parts analytically we have been able to show explicitly how the estimator can be constructed as a weighted sum of galaxy ellipticities, greatly simplifying the estimation of the surface density and its uncertainty. We have presented analytic forms for the kernel for simple rectangular and circular survey geometries.
Our analysis has revealed a fundamental problem with attempts to measure relative to its value on the boundary of the data region (as in the first method developed by Schneider). We find that this is simply not attainable without introducing very large statistical uncertainty and/or bias. We have shown however that one can construct an estimator of relative to its value in some finite strip around the boundary, but the performance of this estimator seems to be no better than a simpler estimator where the baseline is set to the average over the whole region (our case-b estimator). We have also shown how this particular estimator arises naturally if one develops (starting from Gauss’ law) a differential relation between the mass enclosed within a boundary and the shear on the boundary. We have studied a new estimation technique proposed by Seitz & Schneider and have shown that it too possesses a boundary term and suffers from the same limitation as the method discussed above.
With fine grid resolution, we calculated the noise power spectrum for all the of the reconstruction methods. We find that, in general, estimators such as the case-c type or the Seitz & Schneider algorithm which give large weight to galaxies near the boundary have large long wavelength components in the noise power. Among the methods that are classified as direct reconstruction, the case-b type estimators have more desirable noise properties than any estimator containing the boundary term.
Using a quite different approach, we have shown how one can construct an exact inverse gradient operator in discrete Fourier transform space. This method has some distinct advantages: it is extremely fast; it can be applied with a very fine grid to avoid losing any spatial resolution (the real resolution limit is set by the noisy nature of the shear estimates); and it is very easily extended to the strong-lensing regime. Unfortunately, the low-frequency noise power seems to be somewhat higher than for the regularized maximum likelihood method for instance.
We also formulated two regularized inversion methods based on the maximum probability and maximum likelihood techniques. As with the direct reconstruction methods, we discriminate among the performance of these estimators by their noise properties. We find that the maximum likelihood estimator with the usual 9-pt Laplacian regularizer contains very large low frequency noise components. The maximum probability method, however, seems to be the most promising. With modest regularization, the noise power spectrum is flat at all wavelengths, with essentially no bias in the recovered signal. Were we given some data and told we could only apply one of the methods described here then that is what we would choose. The method is somewhat more costly in computer time than e.g. KS93 or the Fourier inverse gradient operator, but not unreasonably so for realistic numbers of galaxies.
We are confident that this paper is not the last word that will be said on the subject. The area promises to be rich, simply because there are potentially infinitely many ways to recover the surface density from the shear. Crudely speaking this is because we are provided with two real scalar fields and which is much more information than we need to recover the single scalar , so there are many ways one can squander this information and yet still recover an unbiased answer. All we have done here is to apply a geometric construction to generate a family of viable estimators, and we have then compared their statistical performance. We have no way of knowing whether there might not be much better estimators out there somewhere, but perhaps the similarity in noise power for the methods we have considered is telling us something.
Appendix A Aperture Masses from Gauss’ Law
Consider a circular loop of radius and with azimuthal coordinate . At each point on the circle construct locally cartesian coordinates along the outward normal and tangential directions . By Gauss’ law, the mass contained within the loop is
| (A1) |
so
| (A2) |
but where the tangential shear is . In components in the general coordinate frame ). Hence
| (A3) |
where and . This is equivalent to equation (4).
Let us now generalize this to non-circular apertures. Take some arbitrary point as origin and consider the self-similar family of closed curves where is a cyclic parameter around the curve and is a scale factor. If we consider two neighboring curves then vector connecting points with the same has length , and if we erect orthogonal locally normal and tangential coordinates , such pairs have separation , where and where and . By Gauss’ law,
| (A4) |
and
| (A5) |
where are unit vectors. Taylor expanding to 1st order and replacing by with parallel component of the shear defined to be , and with the orthogonal component of the shear , we have
| (A6) |
but the integral here is just the integral of over the area in the ribbon between the two curves, and we therefore have, for ,
| (A7) |
or
| (A8) |
where the averaging is understood to be over the thin ribbon.
Now the area is where is the area enclosed within the curve , so we have
| (A9) |
If we take to be the perimeter of the data region and let then we obtain a measure of at a point (the origin) relative to the mean over the data region and the result is precisely equivalent to equation (14). For finite we obtain the mass enclosed within the aperture as an integral over the data lying outside the aperture just as in §6.
The alternative derivation given in this section is not entirely pointless, however, since because of the redundancy in the data — we appear to have a two component field but in reality both and are derived from a single scalar surface potential function — there are many different estimators which measure the same physical quantity but which have different noise characteristics. A simple example of this is equation (4) to which we could, if we were perverse, add any multiple of the integral of around the loop which physically must vanish and so, with real data, will add pure noise. It was therefore not entirely a foregone conclusion that these two different approaches would give the same result, but in fact they do.
References
- Bonnet et al. (1994) Bonnet, H., Fort, B., Kneib, J.-P., Mellier, Y. & Soucail, G. 1994, AJ, 280, L5
- Fahlman et al. (1994) Fahlman, G., Kaiser, N., Squires, G., & Woods, D. 1994, ApJ, 437, 56
- Kaiser (1995) Kaiser, N. 1995, ApJ, 439, 1
- Kaiser & Squires (1994) Kaiser, N., & Squires, G. 1993, ApJ, 404, 441
- Kaiser, Squires & Broadhurst (1995) Kaiser, N., Squires, G., & Broadhurst, T. 1995, ApJ, 449, 460
- Kaiser et al. (1995) Kaiser, N., Squires, G., Fahlman, G., & Woods, D. 1995, in eds.: F. Durret, A. Mazure, J. T.T. Van, Clusters of Galaxies, Editions Frontiières, Gif-sur Yvette Cedex, in press
- Kaiser & Stebbins (1991) Kaiser, N., & Stebbins, A. 1991, in ‘Large-Scale Structures and Peculiar Motions in the Universe’, eds. Latham, D. W., & da Costa, L. (San Francisco: ASP) 15, 111
- Mellier et al. (1994) Mellier, Y., Fort, B., Bonnet, H., & Kneib, J.-P. 1994, in NATO Advanced Study Institute ‘Cosmological Aspects of X-Ray Clusters of Galaxies’ ed. W. Seitter et al. (Boston: Kluwer Academic), 441, 219
- Schneider (1994) Schneider, P. 1994, preprint
- Schneider & Seitz, C., (1995) Schneider, P., & Seitz, C. 1995, AJ, 294, 411
- Seitz, C., & Schneider (1995) Seitz, C., & Schneider, P. 1995, AJ, 297, 287
- Seitz, S., & Schneider (1995) Seitz, S., & Schneider, P. 1995, preprint
- Smail et al. (1994) Smail, I., Ellis, R.S., & Fitchett, M.J. 1994 MNRAS, 270, 245
- Smail et al. (1995) Smail, I., Ellis, R.S., Fitchett, M.J. & Edge, A.C. 1995, MNRAS, 273,277
- Squires et al. (1995) Squires, G., Kaiser, N., Babul, A., Fahlman, G., Woods, N., Neumann, D. M., & Böhringer, H. 1995, ApJ, accepted
- Tyson & Fischer (1995) Tyson, J., & Fischer, P. 1995, ApJ, 446, 55
- Tyson et al. (1990) Tyson, J., Valdes, F. & Wenk, R. 1990, ApJ, 349, L19