07 (03.20.4; 03.20.7; 08.02.1; 08.09.2:HD 101584; 08.13.2; 08.16.4) \offprintsEric J. Bakker, present address: Astronomy Department, University of Texas, Austin, TX 78712, USA, ebakker@astro.as.utexas.edu 11institutetext: Astronomical Institute, University of Utrecht, P.O. Box 80.000, NL-3508 TA Utrecht, The Netherlands 22institutetext: SRON Laboratory for Space Research Utrecht, Sorbonnelaan 2, NL-3584 CA Utrecht, The Netherlands 33institutetext: Astronomical Institute, University of Amsterdam, Kruislaan 403, NL-1098 SJ Amsterdam, The Netherlands 44institutetext: SRON Laboratory for Space Research Groningen, P.O. Box 800, NL-9700 AV Groningen, The Netherlands 55institutetext: Astronomical Institute, Katholieke Universiteit Leuven, Celestijnenlaan 200, B-303 Heverlee, Belgium
The 218 day period of the peculiar late B-type star HD 101584††thanks: Based on observations collected at ESOand the Long-Term Photometry of Variables project
Abstract
We have searched for periodicity in the photometric and spectroscopic variations of the enigmatic star HD 101584 and found a long-term variability on a typical time scale of 1700 days (4.7 years) and a highly significant period of day. This period is most prominently present in the photometric indices which are a measure for the Balmer jump (Geneva and Strömgren ). The Doppler velocities of the high-excitation photospheric absorption lines (He I and C II) seem to be variable with the photometric period. Our data favor the 218 day period for the Doppler velocities with a small probability that the true period is 436 days. We argue that HD 101584 is a close (highly) eccentric 218 day binary system with a low-mass unseen secondary. The photometric and Doppler variations are attributed to changes in the velocity law and mass-loss rate of the stellar wind which lead to asymmetric line profiles and a phase dependent Balmer discontinuity. Binary interaction is responsible for the changes in velocity law and mass-loss rate leading to the observed phenomena.
keywords:
techniques: photometry - techniques: radial velocities - binaries: close - stars: HD 101584 - stars: mass-loss - stars: AGB and post-AGB1 Introduction
Since Humpreys ([1976]), on the basis of limited data, suggested that the peculiar supergiant HD 101584 is a binary system with an orbital period of 3.5 years, it has been an open question whether the binary nature could be proven independently. The last two decades no convincing improvements have been made in detecting a periodicity. Here we will show that the optical photometry shows a highly significant periodicity of days and that the same period is probably present in the Doppler velocities of high-excitation absorption lines.
Parthasarathy and Pottasch ([1986]) and Trams et al. ([1991]) used the detection of infrared excess in the IRAS bands as an argument for the evolved nature of HD 101584. They interpreted this as radiation from the AGB ejecta and argue that HD 101584 is in the post-AGB phase. The galactic latitude of is too low to decide between population I and II, but the observed radial velocity of HD 101584, derived from the CO millimeter line emission ( km s, Trams et al. [1990]) cannot be fitted with the Galactic rotation curve if the star is a massive population I object. This strongly points to the population II nature of the object.
Bakker et al. ([1996]) have made an extensive study on the nature of HD 101584 by combining multi-wavelength photometry and spectroscopy and found that the system contains a late B-type post-AGB stars which experiences a very high mass-loss rate ( M⊙ yr-1). Due to the high density, the wind has a low degree of ionization, close to the star, the ionization conditions in the wind are similar to those in the photosphere of a F-type supergiant. This is observed as a low ionization shell spectrum. Due to the numerous UV spectral lines in the shell spectrum the UV continuum is not observed but obscured by a curtain of absorption lines (Bakker et al. [1994]). In the red spectrum the shell spectrum produces less spectral lines and the late B-type star is observed by the presence of high-excitation absorption lines (e.g., He I and C II).
The most obvious way to look for binarity is to study the Doppler velocities of spectral lines, which gives the orbital period and the velocity amplitude of the observed star. This method cannot easily be applied to HD 101584 because of the velocity-stratification in the pseudo-photosphere. The Doppler velocities of absorption lines are not only dependent on the orbital phase, but also on the wind structure, line strength and central wavelength of the line (Bakker [1993]; Bakker et al. [1996]). A radial velocity curve on the basis of high-excitation photospheric absorption lines may prove the binarity.
We have looked for periodicity in the photometric data of HD 101584. One of us, CW, has observed HD 101584 over many years, and obtained 89 observations in the Geneva system. The second, independent, dataset we have used is from the Long-Term Photometry of Variables (LTPV) project. These 75 observations have been obtained in the Strömgren system, were the -band has been transformed to the Johnson -band (). A description of the observations is given in Sect. 2. We have combined the Geneva -band with the LTPV -band to obtain 157 Johnson magnitudes over 3337 days (4.1 years). Using the Phase Dispersion Minimization method (Sect. 3), we have detected a day periodicity in (Sect. 4). In Sect. 5 we will show that the 218 day period is likely present in the Doppler velocities of high-excitation photospheric absorption lines, and discuss the results in Sect. 6.
2 The observations
2.1 Photometry in Geneva seven color system
CW has collected photometry in the Geneva seven color system (, , , , , , ) spanning 1511 days (4.1 years). These observation were obtained with the 70cm Swiss telescope at ESO, La Silla, Chile. The error estimate on the magnitude is 0.003 mag. A complete description of the Geneva seven color system can be found in Rufener and Nicolet ([1988]). We will use the Geneva photometric indices , and which are a measure of the effective temperature, the Balmer discontinuity, and the blocking by absorption lines respectively.
2.2 Photometry in Strömgren system
We have obtained data from the Long-Term Photometry of Variables (LTPV) project (Sterken [1983]) covering 10.6 years. All observations were taken using the Danish 50cm telescope on La Silla, and are made in the Strömgren system. The photometry of the -band has been transformed to the Johnson -band using the relation between those two bands (Manfroid et al. [1991]). The data has been published by Manfroid et al. ([1991]) and Sterken et al. ([1993]). We will use the Strömgren indices , , and , which are a measure of the effective temperature, Balmer jump, and blocking by absorption lines respectively.
We have calibrated the Strömgren photometry of HD 101584 using the method described by Spoon et al. ([1994]). The LTPV program makes use of comparison stars to increase the accuracy of the data. Just before and just after observing the program star, comparison stars are observed. Comparison star A is HD 102113 (A0IV) and comparison star B is HD 101735 (G5III). By assuming that the two comparison stars are intrinsically constant in magnitude we can calculate a correction term by which the observed magnitude of the comparison stars differs from their average value over the whole dataset. The observed magnitude of the program stars is corrected with this correction term to obtain an “atmospheric extinction” free intrinsic magnitude (Eq. 1). In order to correct the data, the comparison stars have to be observed within 30 minutes before or after the program star. Observations of the program star within three minutes of each other were averaged to one magnitude.
| (1) |
where is the mean magnitude of stars A and B averaged over all observations.
2.3 The Johnson -band
The filter response function of the Geneva -band and the Strömgren -band, as converted to the Johnson -band, are almost identical. For this work we have made use of this and compiled a dataset of Johnson -band photometry containing the Geneva -band and the calibrated Strömgren -band. This dataset contains 157 data points and will be referred to as the Johnson -band dataset throughout this article.
2.4 Doppler velocities
High-resolution CAT/CES spectra (Table 1, 17 spectra) have been obtained by CW in the wavelength region of He I (5876 Å) and C II (6579 and 6583 Å). Although there are many lines in the optical spectrum of HD 101584, the majority is formed in the stellar wind (Bakker et al. [1996]) and only the high-excitation absorption lines (e.g., He I and C II) are from the photosphere of the underlying B-type star. Here we will try to correlate the photometric period with the Doppler velocities of these high-excitation absorption lines. All He I lines were fitted with a Gaussian to derive the central velocity. The C II lines are too weak for a reliable Gaussian fit and the central velocity was determined with an eyeball fit and the equivalent width by integrating over the line profile. If more than one velocity is available at a given date, the velocity used for our analysis was based on the quality of the spectra (Table 1). A typical error in the velocity is 3 km s. All velocities are heliocentrically corrected.
Date (244+) Id. Remark dd/mm/yy [Å] [mÅ] [km s] [km s] 17/02/89 7575.85 C II 6578.69 35 48 48.0 C II 6583.55 25 48 23/01/90 7915.43 C II 6578.87 38 57 57.3 C II 6583.45 14 46 very noisy 02/07/90 8074.75 He I 5876.98 111 52 51.8 14/03/91 8329.65 C II 6579.01 30 55 very noisy C II 6583.61 24 45 very noisy 29/01/92 8650.86 C II 6578.61 ? 45 very noisy C II 6583.52 19 49 noisy 17/04/92 8729.50 C II 6579.18 44 53 52.6 C II 6583.92 26 49 18/01/93 9006.0 He I 5876.32 158 55 55.3 18/01/93 9006.0 C II 6578.81 48 55 52.4 C II 6583.52 53 50 11/02/93 9030.0 C II 6579.05 86 64 64.1 C II 6583.77 45 59 12/02/93 9031.0 He I 5876.49 143 62 61.8 22/04/93 9089.69 He I 5876.81 155 59 asymmetric 59.2 22/04/93 9098.95 C II 6579.30 48 56 56.3 C II 6584.12 29 56 14/05/93 9121.54 C II 6579.52 33 60 58.5 C II 6584.27 31 56 15/05/93 9123.46 He I 5876.90 162 57 57.3 19/07/93 9188.46 He I 5877.10 145 57 57.0 20/07/93 9189.50 C II 6579.69 43 57 nice profile 57.9 C II 6584.55 35 59 nice profile 14/12/93 9335.83 C II 6578.89 31 55 nice profile 55.3 C II 6583.61 22 51 polluted
3 Phase Dispersion Minimization method
Searching for periodicity with Fourier analysis techniques one looses information in trying to fit a sinus shaped curve to the mean light curve. This loss of information does not occur using the Phase Dispersion Minimization method (PDM). The PDM method was first proposed by Lafler and Kinman ([1965]) for finding the period of a RR-Lyrae variable. Stellingwerf ([1978]) made a generalization of this PDM method and applied it to the double-mode Cepheid BK Centauri. This method looks for periodicity in the light curve by means of an auto-correlation method that does not require the light curve to have any pre-known shape, but only that it repeats itself every period.
A set of photometric observations contains pairs of Julian dates and observed magnitudes: (). Let the variance of the magnitude, , be given by
| (2) |
where is the average magnitude .
The dataset is folded over a given period , to determine the phase of the observation dates . Dividing the phase in bins and covering every bin time with a bin-offset of we have dependent samples of the mean light curve.
| (3) |
The overall variance for the given period is then given by
| (4) |
we use the ratio
| (5) |
If the phase diagram shows a correlation for a given period , the overall variance will be smaller than the dataset variance . This gives a minimum in the -statistics (Eq. 5). If the phase diagram does not show any correlation but only a random distribution of magnitudes, the overall variance will equal the dataset variance , and will be close to 1.
The strength of the PDM method is that no pre-known shape of the light curve has to be given. For the photometric data we taken . This means that we split the light curve in 10 bins, each covering 0.1 part of the photometric phase. Each data point will be used twice. The -statistics was calculated for 0.0 to 0.01 days -1 in frequency steps of days-1.
4 Photometry
4.1 The long-term photometric variability with a time scale of 4.7 years
The photometric data of HD 101584 shows a long-term variation on a typical time scale of 1700 days (4.7 years). Fig. 1 shows the , , and broad band filters of the Geneva dataset (until ). While the -band has a minimum near , the -band has a maximum. In the next sections we will discuss the 218 day photometric period and find a similar behavior which is attributed to changes in the wind structure and successively in the Balmer jump. It is suggestive to think that this variability is periodic, but our dataset is to limited to reach a firm conclusion about that. We note that the Kelvin-Helmholtz time scale for a post-AGB star is of the order of several decades. This might indicate that the origin of the variability has to do with the release of gravitational energy of a part (envelope ?) of the star itself. However the primary goal of this study it to look for photometric variations which might indicate that HD 101584 is an interacting binary system. It is unlikely that the 4.7 year variability is due to binary motion as in such a wide binary system the mutual interaction will be very small. Our main goal is to understand the large scatter around this long-term variation: the 218 days period.

4.2 The day periodicity in the Johnson -band
In order to look for a short-time periodicity on a long-term variability we should first try to correct for the long-term variability. However the shape of the intrinsic long-term variation is unknown, and we have tried to correct for this long-term variation without satisfactory results. The reason for this is that the PDM method is very suitable for finding a short-term variation on top of a long-term variation. By correcting the photometry we would pollute the light-curve with and “arbitrarily” long-term light curve without gaining much in sensitivity of detection a short time periodicity.
Using the PDM method as described in the preceding section we find a day period in the Johnson -band of HD 101584 (Fig. 2). The -spectrum does not only show the primary frequency, , but also at least five sub-harmonics and two beats with the year. This is a highly significant period in the Johnson -band. Table 2 gives a list of the identified features in the -spectrum. Using this period we can make a least-square-fit to the date using a sine function (Table 3).
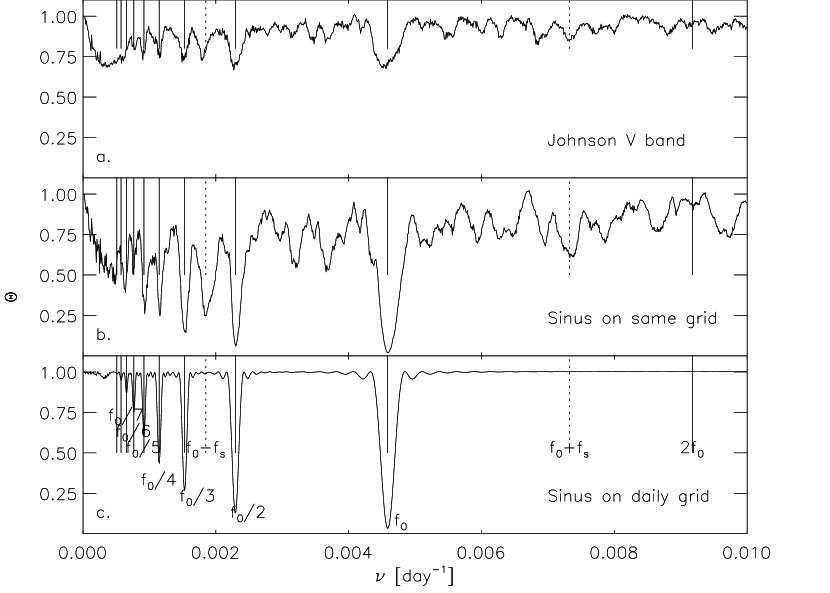
The many unidentified features in the -spectrum are likely due to aliases as a result of the irregular spaced grid of observation dates. We have made a synthetic light curve using a sine-function and the photometric parameters of Table 3. Such a synthetic light curve on the same grid of observation dates should show the same features in the -spectrum. If this is not the case then this could mean that there is another period present in the data. Fig. 2.b shows the -statistics of the best-fitted-sine-function (Table 3) on the grid of observation dates. All features are present but the power in the -spectrum is much more concentrated in the (sub-) harmonics of the sine function. This tells use that it should be possible to obtain better results using another shape of the synthetic light curve (e.g., sawtooth), or subtracting the long-term variability.
Finally we have computed a synthetic spectrum on a daily grid between the first and last day of observations present in the data set. The resulting -spectrum (Fig. 2.c) shows very strong features at the primary frequency and at least seven sub-harmonics, no harmonics. The beats with the year are no longer present. The peak at primary frequency shows lobes on both sides corresponding to a frequency of the total time span of observations.
A 218 day period in the -spectrum does not unambiguously means that the true period is 218 days. In the case the photometric periodicity is due to the rotating geometry of a binary system the true period can be twice the photometric period. As long as it is not clear what causes this periodicity it would be premature to choose between a 218 and 436 day period.
Fig. 3 shows the Johnson magnitude as function of phase (based on 218 and 436 day period) and Julian date. By looking at the light curve as function of Julian date we see that the magnitude follows the sine function quite well. We note that there are strong deviations from the mean light curve, particularly at its maximum. Unfortunately the photometric light curve does not significantly show that two successive 218 day periods behave differently. The question whether the true period is 218 or 436 days remains therefore open.
Identification Period [days] 78.099 213.40 91.012 219.75 114.783 217.80 152.080 219.18 181.525 219.63 229.827 217.55 456.446 219.08 735.732 216.47 average
is the the sidereal year of 365.256 days
Parameter Best fitted value Period days mag Amplitude mag
is defined where and

4.3 The day period in the photometric indices
In order to find the origin of the photometric period we searched for periodicity in the other photometric bands and photometric indices. As the dataset is about half the size of the -band dataset the PDM method does not give any useful results and we folded the photometry over a 218 day period and 436 days. In the case of 436 days we find that the two successive sines (of each 218 days) do not differ significantly. Which means that our data favor a true period of 218 days. In order to increase the accuracy of the light curve we will fold the data with a 218 day period. No clear phase dependence is observed in any of the separate photometric bands (with the exception of the Johnson -band because it contains much more data points). This is presumably due to the small amplitude and the irregular behavior of the light curve. To show the presence of photometric variations we will first look at the standard deviation () of the photometry for each band and index.
band 3458 170 7.779 0.0710 0.0074 3500 300 8.606 0.0684 0.0348 4022 171 7.306 0.0392 0.0054 4110 190 7.560 0.0321 0.0172 4248 283 6.415 0.0343 0.0048 4480 164 7.890 0.0309 0.0052 4670 180 7.262 0.0209 0.0143 5408 202 7.652 0.0250 0.0043 5470 230 6.939 0.0192 0.0075 5500 800 6.934 0.0228 5508 298 6.930 0.0249 0.0036 5814 206 8.034 0.0243 0.0050 0.237 0.0121 0.0033 -0.039 0.0077 0.0120 1.308 0.0345 0.0072 0.677 0.0415 0.0390 -0.066 0.0091 0.0050 0.037 0.0157 0.0150

Table 4 gives for each photometric band (in order of increasing wavelength) the average magnitude () and the standard deviation (). The last column gives the standard deviation of that band or index for the comparison stars () and is used as a measure of the error in the dataset. Here we note that the standard deviation on the average magnitude of a photometric band or color is significantly larger than the error. Fig. 4 shows that the standard deviation increases to the blue. Near the -band the variations are on a 3 level, while due to an increase of the error the variations decrease to the blue. From this we conclude that all photometric bands show variations. Although we can not decide on the basis of Fig. 4 whether these variations are correlated with the 218 day period in the -band photometry it is suggestive that the 218 day period is also present in the other photometric bands.
A powerful tool to study the photometric variations are the photometric indices. Both in the Geneva and in the Strömgren system there are indices for the effective temperature , the Balmer discontinuity, and the blocking by absorption lines.

Bakker et al. ([1996]) have shown that the photometry is consistent with a late B-type supergiant (e.g., B8-9I-II, K, , and ). To calculate dereddened photometry we will adopt the reddening of . Using Eq. 6 the Strömgren photometry can be dereddened. No dereddening has been applied to the Geneva photometry.
| (6) |
| (7) | |||
| (8) |
In Fig. 5 both indices are folded with the 218 day period and no clear phase dependence is observed. From this we conclude that the 218 day period is not related to a periodicity in .
| (9) | |||
| (10) |
Fig. 5 clearly shows the presence of a 218 day period in those two indices. The amplitude of the variations in and are about 0.18 mag (a detection), i.e. a factor eleven larger than the amplitude of 0.016 mag found in the -band photometry. The fact that the Geneva and the Strömgren indices are not exactly in phase is likely due to the fact that they are not observed simultaneously and uses different photometric bands. Furthermore we should note again that we did not correct for the long-term photometric variability and that this will surely causes an additional scatter in the phase light curve. A maximum Balmer discontinuity occurs at phase , which is clearly out of phase with the -band: it is behind. The minimum Balmer discontinuity occurs at phase , exactly half a period shifted from the maximum Balmer discontinuity. Suppose that the large standard deviation of the temperature indicator is due to variations in the effective temperature of the star. Then the mean relation between and , , predicts a standard deviation of the index of . The observed standard deviation is a factor 50 larger and (again) tells us that it is not the temperature but the (wind)density that causes the variability of the Balmer discontinuity. From the work by Bakker et al. ([1996]) we know that at wavelengths shorter than the Balmer jump (3647 Å) the wind spectrum dominates and is optically thick in the Balmer continuum: the UV energy distribution resembles an A5I star. The periodicity in can now be attributed to a periodicity in the density of wind material (not the photosphere).
Photometric variations due to obscuration by wind material is also observed in the case of the well studied object Pleione (Luthardt and Menchenkova [1994]). The spectral type of Pleione of B8V (M=3.5 M⊙) is comparable to the spectral type of HD 101584: B(e)8-9II. In contrast to HD 101584 with km s(assuming that we don’t see it pole on), Pleione is a rapid rotator ( km s) which experiences discrete mass-loss episodes. A shell of material is expelled and moves away from the star and the spectrum of a normal B8V star changes to a spectrum which is almost completely dominated by wind lines which are partially in emission. In the case of Pleione the recurrence time scale is of the order of several decades, while the recurrence time scale for HD 101584 is much shorter (218 days) and the star is almost continuously in a shell stage.
Recent theoretical work on the shell spectrum after a nova outburst (Beck et al. [1995]) has shown that in the case of a dense shell of material around a 10.000 K star, the Strömgren sphere of e.g., hydrogen is one order of magnitude smaller than in the case of a black-body. This leads to a depression of the UV continuum. The observed photometric variations of HD 101584 can be understood in a similar way as a period depression of the UV continuum due to variations in the amount of gas in the line-of-sight.
| (11) | |||
| (12) |
Fig. 5 shows that no clear phase dependence of these indices is observed. The presence and strength of spectral features does not vary significantly, which indicates that the periodicity found can be attributed to a periodicity in the strength of the UV continuum level. The number of wind lines in the optical spectrum of HD 101584 decreases to the red. For wavelengths longer than 5000 Å there are very few of these lines left and it unlikely that these lines produce the periodicity in the photometry. Furthermore from Fig. 4 we note that although the Balmer continuum shows the strongest variability, there are indications that even the Paschen continuum varies in strength.
4.4 Conclusions
We found a long-term variability (possible period) with a typical time scale of 4.7 years. The Balmer (and Paschen) discontinuity varies periodically with 218 days and that the effective temperature and blocking by absorption lines do not vary. This periodicity is therefore attributed to changes in the continuum level, and especially in the Balmer continuum (UV continuum). As the UV continuum is much lower than expected for a B8 supergiant we argue that the UV continuum is depressed due to the many absorption lines from a dense stellar wind and that the amount of depression of the UV continuum is period.
5 Doppler velocities
5.1 The 218 day period of the Doppler velocities
An important question in unraveling the photometric periodicity is whether or not the periodicity is also present in the Doppler velocities of the photospheric absorption lines, and if it is, whether the period is 218 or 436 days. The small number of data points (only 15) is too small to detect a period using the PDM technique and we have folded the observations over 218 and 436 days.

Parameter Best fitted value Period days km s Amplitude km s
is defined when and
Fig. 6 shows the two possibilities (218 or 436 days). On the basis of this figure we are not able to distinguish between the two periods, but as we have argued that the photometric period is 218 days we will adopt a 218 days period in the radial velocities. A sine fit with a period of 218 days yields an amplitude of 3.0 km swith a residual dispersion of 3.4 km s. The fit is not in phase with but leads it by 0.25 in phase. It is however very doubtful whether a sine fit is allowed as the average velocity of km sis 6.0 km sred-shifted with respect to the system velocity. Most likely due to the small number statistics the observed average radial velocity is off by about 6.0 km s. As only one point is below the system velocity a sine fit with an offset of the system velocity does not not give a reasonable fit to the data. An ad hoc interpretation to the 6 km soffset could be that we don’t see direct light from the star, but only reflected light on a receding “mirror” of material (e.g., wind material). As this is indeed an ad hoc interpretation we will not pursue it.

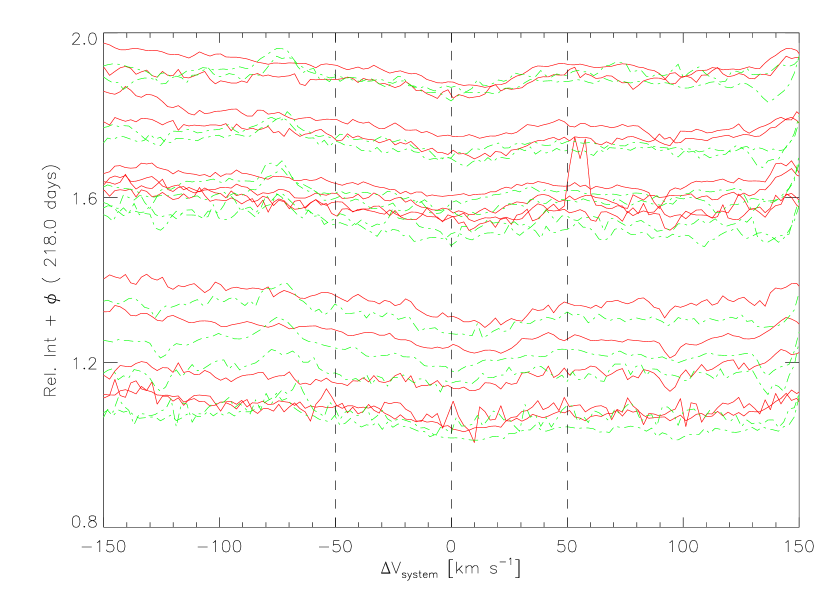
We have investigated if the periodicity in the Doppler velocities could be attributed to changes in the absorption line profiles. Fig. 7 shows the line profile of the He I lines at six different phases and Fig. 8 shows the line profiles of the two C II lines at 13 different phases. The dashed lines is the system velocity of km swith on both sides a line at km sto show the variable asymmetry of the line profile. The red wing is steeper than the blue wing, and there is clearly a shift in the position of the minimum of the profile. This could cause a systematic error in the determination of the Doppler velocities.
5.2 Stellar rotation?
An estimate of can be obtained from the full width of the absorption line profile of C II (Fig. 8). The full width of the He I line is not a good estimate because of Stark broadening. From the C II lines we find km s. If 218 days is the stars rotational period and the system is almost edge-on () then we find that the radius of the star is R⊙. This is one order of magnitude too large for a post-AGB star, but is about the size expected for a massive 40 M⊙ supergiant. Alternative if we adopt a stellar radius ( R⊙) for a post-AGB star, and km swe find a rotational period of days. We can thus conclude that 218 days is not the rotational period for a post-AGB star (it could be the rotational period if HD 101584 is a massive B-supergiant).
5.3 Pulsation?
With an amplitude of 6 km sand a 218 day period the increase of radius in one pulsation period is 51 R⊙. This is larger than the radius of a post-AGB star ( R⊙). Such an enormous increase in radius would be observed and strong variations in the photometric indices which are a measure of the effective temperature would be observable. As this is not the case we can discard pulsation as the origin of the photometric variations.
5.4 Binarity?
If the 218 day period in the Doppler velocities is attributed to orbital motion, the mass function of the system is M⊙. From Bakker et al. ([1996]) we take the system edge-on, , and for simplicity we will adopt .
M⊙ M⊙ M⊙ R⊙ R⊙ R⊙ 0.14 M⊙ 0.72 M⊙ 2.1 M⊙ R∗ R∗ R∗ 26 km s 67 km s 116 km s
Table 6 gives the orbital parameters for a 0.6 M⊙ post-AGB star, a 8 M⊙ (Pop. I) and a 40 M⊙ star (Pop I). The orbital separation, , is in all cases less than 13 R∗, and all systems are close binaries. In all cases the secondary is a low-mass star, with a mass less than the primary (the observed star). Stars which are not on the main sequence evolve faster than on the main sequence. This means that the secondary is most likely either the end product of stellar evolution, or is on the main sequence. The secondary of the 0.6 M⊙ primary is a low-mass main sequence object as 0.14 M⊙ white dwarfs do not exist. The secondary of the 8 M⊙ and 40 M⊙ primary cannot be a white dwarf as the progenitor was a high-mass star which evolves to a neutron star or a black hole which have a mass in excess of 1.4 M⊙. The presence of a black hole or neutron star is not likely as no high energetic processes have been reported in the literature. This secondary is thus also on the main sequence.
A possible solution to the low-mass of the secondary and the velocity offset of 6 km sis if the star is in a highly eccentric orbit. This will increase the amplitude, , the mass-function, and therefore the mass of the secondary. Two examples are plotted in the top two panels of Fig. 6. In that case we find post-AGB secondaries masses in the range between 0.1 and 1.0 M⊙.
It is evident that if the variations in Doppler velocities are due to binarity, the mass function poses strong constraints on the mass of the secondary and the eccentricity of the orbit. The most likely evolutionary status, the post-AGB phase, yields a mass of the secondary in the range of 0.14 M⊙ for a circular orbit to 1.0 M⊙ in a (highly) eccentric orbit.
5.5 Conclusion
Pulsation and rotation are not able to explain both the photometric and radial velocity variations. If the observed star is in a binary system with an eccentric orbit the radial velocity variations could be due to binary motion which gives a secondary mass between 0.14 and 1.0 M⊙.
6 Discussion
We can summarize the results in the following way:
-
1.
The photometry reveals a long-term variability on a time scale of about 1700 days (4.7 years). On the basis of the available data we argue that it is likely periodic.
-
2.
The Johnson -band, derived from the Geneva and Strömgren -band, shows a highly significant period of days.
-
3.
The period is most clearly present in the photometric indices which are a measure of the Balmer jump.
-
4.
The effective temperature indicators do not vary with phase.
-
5.
The line blanketing indicators do not vary with phase.
-
6.
The photometric variations are therefore attributed to variations in the (UV and optical) continuum level.
-
7.
A change in the strength of the Balmer jump can occur at a part of the stellar surface with a lower effective gravity, leading to a higher mass-loss rate and a flatter velocity law of the wind.
-
8.
The Doppler velocities of high-excitation photospheric absorption lines are likely periodic with 218 days, and attributed to orbital motion in an highly eccentric orbit.
-
9.
The Doppler velocities are not in phase with the Balmer jump.
We have discussed stellar rotation, binarity and pulsation as possible origin of the 218 day photometric period and found that only binarity can explain the observations. (a) HD 101584 is a post-AGB star and the variations are due to a companion with a period of 218 days. The changes in the velocity law and mass-loss rate are likely triggered by binary interacting with the secondary. The asymmetric photospheric lines profiles might cause a systematic effect in the determination of the Doppler velocities, and can (partly) explain the 6 km soffset. (b) If HD 101584 is a massive object than the stellar rotational period is the most acceptable origin.
In both scenario the same idea works: a part on the stellar surface experiences a flatter velocity law and higher mass-loss rate than average. This results in a periodic increase and decrease of the (UV) continuum level. The periodicity in -band is also due to the increase in the wind density, but as the effect of the amount of neutral hydrogen strongly decrease to longer wavelength the amplitude is quite small.
A alternative explanation for the variations in the Balmer discontinuity might be the presence of a second continuum source in a binary system (e.g., an accretion disk around the secondary). The second continuum source is periodically observed or obscured and this leads to the observed changes in the photometry.
From this work we see that the ultraviolet spectral region is of crucial importance in understanding this object as the stellar wind is so dominant. We therefore have started a long-term IUE program to monitor HD 101584 every 40 days at high- and low-resolution. Here we predict that the UV continuum will rise and fall in phase with the and index.
Acknowledgements.
EJB was supported by grant no. 782-371-040 by ASTRON, which receives funds from the Netherlands Organization for the Advancement of Pure Research (NWO). LBFMW is supported by the Royal Netherlands Academy of Arts and Sciences. This research has made use of the Simbad database, operated at CDS, Strasbourg, France. We acknowledge the Long-Term Photometry of Variables (LTPV) project for observing this star for such a long period. Without the LTPV data this article could not have been written. CW thanks the staff of the Geneva Observatory for the generous awarding of telescope time with the Swiss Telescope at La Silla Observatory.References
- [1993] Bakker E.J.: 1993: ASP Conference Series 45, Ed. D.D. Sasselov, page 130-136
- [1994] Bakker E.J.: 1994, A&AS 103, 189
- [1996] Bakker E.J., Lamers H.J.G.L.M., Waters L.B.F.M., Waelkens C., Trams N.R., Van Winckel H.: 1996, A&A in press
- [1995] Beck H.K.B., Hauschildt P.H., Gail H.P., Sedlmayr E.: 1995 A&A 294, 195
- [1976] Humpreys R.M.: 1976, ApJ 206, 122
- [1965] Lafler J., Kinman T.D.: 1965, ApJS 11,216
- [1994] Luthardt R., Menchenkova E.V.: 1994, A&A 284, 118
- [1991] Manfroid J., Sterken C., Bruch A., et al. : 1991, First Catalogue of Stars measured in the Long-Term Photometry of Variables Project (1982-1986), ESO Scientific Report No. 8, Garching
- [1986] Parthasarathy M., Pottasch S.R.: 1986, A&A 154, L16
- [1988] Rufener F., Nicolet B.: 1988, A&A 206, 357
- [1994] Spoon H.W.W., Koter A., Sterken C., Lamers H.J.G.L.M., Stahl O.: 1994, A&AS 106, 141
- [1978] Stellingwerf R.F.: 1978, ApJ 224, 953
- [1983] Sterken C.: 1983, The Messenger 33, 10
- [1993] Sterken C., Manfroid J., Anton K., et al. : 1993, Second Catalogue of Stars measured in the Long-Term Photometry of Variables Project (1986-1990), ESO Scientific Report No. 12, Garching
- [1990] Trams N.R., Van der Veen W.E.C.J., Waelkens C., Waters L.B.F.M., Lamers H.J.G.L.M.: 1990, A&A 233, 153
- [1991] Trams N.R., Waters L.B.F.M., Lamers H.J.G.L.M, Waelkens C., Geballe T.R., Thé P.S.: 1991, A&AS 87, 361