Horizontal Branch Stellar Evolution
Abstract: I review aspects of the evolution of horizontal branch (HB) stars. The defining characteristic of this, the core He-burning phase of evolution for is a spread in observed colour amongst HB stars within the (almost) chemically homogeneous, isochronous populations found in Galactic globular clusters. The inference is that the stars within a given cluster must have undergone varying degrees of mass loss during the earlier, red giant (RGB) phase.
I start by reviewing current topics in the study of HB stellar evolution, including a brief review of the main determinants of the structure of low-mass core helium burning stars and of HB morphology. I describe the main concerns addressed by earlier studies of HB morphology, viz. the ‘first’ and ‘second’ parameter effects on HB morphology, and attempt to summarize the current state of affairs and how future investigations might improve our findings in this area. I also briefly discuss what appears to be the topic that has generated the most theoretical attention over the last 5 years, that of the hot end of HB sequences. The stars that have undergone the most mass loss — termed extreme HB stars (EHB) — form a group that is often separated observationally from the ‘blue’ HB stars seen in metal-poor globular clusters. I then discuss the current state of HB theory, reviewing the effect of new physics on the models, and the special considerations (partial mixing) that arise in core helium burning models. Assuming only that the gas cannot, on average, be strongly superadiabatic anywhere, one finds that the convective core must be surrounded by a partially mixed semiconvective region. This result holds when the radiation pressure is small and the opacity has a significant Kramers-type component. I also review the controversy surrounding the behaviour of the core in the late phases of evolution.
Finally, I give two further examples of questions that are still outstanding. After noting that the mass loss mechanism is not at all understood, I review detailed work by several different groups concerning the age, abundance spread, and rotational properties of RGB and HB stars in the ‘second parameter’ clusters M3 and M13. I conclude by discussing the HB luminosity-metallicity relation. The discrepancy between the slope of this relation from different lines of argument appears largely to have been resolved. However, the observational data and theoretical sequences (if ) are still in conflict as far as the HB luminosity zero-point is concerned.
1 Introduction
1.1 Overview
The helium-burning phase of stellar evolution has a particular importance, because it produces two different ‘standard candles’ of pulsating stars at different mass ranges: Cepheids at intermediate masses and RR Lyrae stars at low mass. Core helium ignition produces stars that spend significant time within a region just blueward of the red-giant branch (RGB). As the red edge of the instability strip is related to the line on the HR diagram where stars no longer have extensive convection zones, it follows that He-burning objects are the longest-lived stars that occupy the pulsationally unstable region.
This review focuses on the low mass core helium burning stars that appear as either ‘red clump’ stars or horizontal-branch (HB) stars. For a fixed composition, the HB is understood to be a sequence of objects with fixed core mass and varying envelope mass . After attempts to fit observed HBs with sequences of constant mass, it was realized (Iben & Rood 1970) that there was an intrinsic scatter in the HB masses due to mass loss in prior stages, most probably on the RGB rather than during the He-flash. Thus the defining characteristic of the HB is actually determined by a ‘non-canonical’ (and ill-understood) process that occurs prior to the phase itself. The dispersion in mass along observed HBs is found to be of order a few hundredths (Rood 1973; Lee, Demarque & Zinn 1990), and it is probable that most stars undergo some mass loss. The process underlying mass loss is not identified, at least in cool, single, non-pulsating giants, and neither its dispersion or the shape of the mass distribution (d’Cruz et al. 1996) are understood. The dispersion is likely to be the result of variations in individual properties amongst stars, and it is found not to be the same in general amongst different clusters; its cause probably also contains a stochastic component.
is determined by the onset of the helium core flash; energetic considerations, constraining the amount of energy required to lift the central degeneracy, allow only weak variations among stars at fixed abundance. Small differences may, however, arise among stars because of varying rotation rates (Renzini 1977) or perhaps star-to-star variations in initial CNO abundance (Briley et al. 1994). additionally varies little with age (for ), which is the property that in principle makes the HB a good standard candle.
The models have almost fixed core luminosity, but widely varying hydrogen shell luminosity (Iben & Rood 1970; Dorman 1992). Their hydrogen-rich envelope structure is ‘giant-like’ at the red extreme, where the hydrogen shell contributes most of the energy and forces a large convective envelope. For smaller envelope masses the H-shell strength drops until the outer zones are radiative, and the sequence crosses the instability strip. The envelopes are ‘dwarf-like’ at the blue end, where the outer hydrogen envelope remains inert until the He-shell-burning stage. The basic qualitative picture does not vary much with metallicity, helium abundance or any of the other parameters known to affect this phase of evolution.
1.2 HB Morphology: the First and Second Parameters
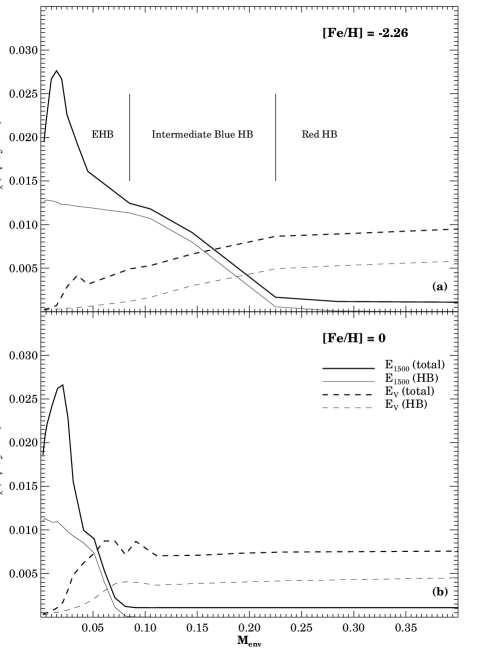
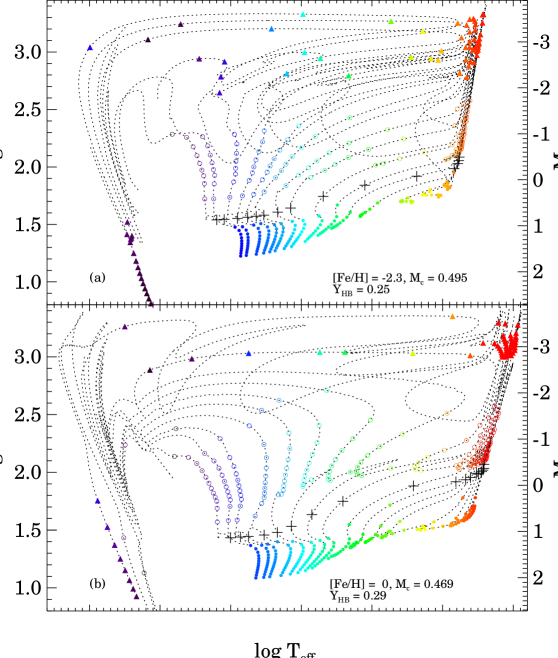
Fig. 1 illustrates the relationship for HB stars in a somewhat unconventional fashion. I plot the lifetime radiated far-UV (1500 Å) and band energy against the mass of the hydrogen-rich envelope, for models with The corresponding evolutionary tracks (Fig. 2) are from Dorman, Rood, & O’Connell (1993). The ordinate in Fig. 1 turns out to be an important quantity for population synthesis studies: see Dorman, O’Connell, & Rood (1995) for a discussion. Since only stars with radiate significantly in the far-UV, the curves measure the luminosity- and time- averaged mean temperature. The band curves are flat for the range of masses that corresponds to the red clump. Both high and low metallicity models with small envelopes are extreme HB (EHB) stars, defined by the criterion that they are hot during post-HB phases, i.e. that they never reach the asymptotic giant branch (AGB). Evidence from the Galactic field as well as the globular clusters suggests that these might be produced by mass loss processes distinct from those responsible for the cooler stellar distribution. In the metal-poor case there is a range of ‘intermediate’ blue stars that correspond to the globular cluster blue HB stars. For metal rich populations, models with similar to the blue HB stars are red, and the temperature range including the instability strip and the blue HB is unlikely to be populated.
This is, of course, simply the ‘first parameter’ effect; all HB morphologies are possible according to Fig. 2, but some are much more likely at low metallicity (Fig. 1) because the mass range that allows them is larger and the mass loss required to produce them is less extreme. This figure also encapsulates the ‘intrinsic’ effect of stellar interior physics on HB morphology. The so-called ‘second parameter’ effects — variations in HB morphology at (apparently) fixed abundance include all the ‘stellar populations’ considerations, which may be thought of as all the phenomena that are larger than the individual stars. For example, if individual characteristics such as rotation affected the HB morphology, the question to be answered would be why the stars in one cluster have such different mean rotational properties from another. In this sense, the rather well-researched hypothesis (Zinn 1980; Lee, Demarque & Zinn 1994; Fusi Pecci et al. 1995) that age is the ‘global’ second parameter determining HB morphology is highly satisfactory, as it would explain in a most natural manner why there are differences among apparently similar clusters. This idea is reinforced by the prevalence of the problem in clusters outside the Solar circle. A recent theory of globular cluster formation (McLaughlin & Pudritz 1995) suggests that formation timescale for globular clusters varies with galactocentric radius, consistent with this interpretation of HB morphology variations.
However, any study of the HB stellar distribution necessitates simplifying assumptions that are difficult to justify a priori, since we do not have a viable theory for the mass loss process. Fig. 7 of Lee et al. (1994) demonstrates a convincing case for age as the second parameter; for globular clusters with Galactocentric radius at fixed HB type [as parametrized by the Lee index where are the numbers respectively of blue, variable and red HB stars] the outer halo objects are more metal-poor, or alternatively they have bluer HB’s at fixed metallicity. Assuming that the mass loss is invariant with abundance, at least for (below which the HB morphology is not monotonic), synthetic HB models of different ages fit the cluster data implying a trend toward bluer HB morphology at greater age. This argument was one of the motivators behind the widely adopted Searle & Zinn (1978) picture of galaxy formation. It should be pointed out that another assumption is implicit in the interpretation of the HB data. Assuming that mass loss is fixed in either time and/or metallicity also implies that the intrinsic stellar mass distribution is the same in different clusters. Thus, comparing clusters at the same metallicity for age differences requires verifying that the mass distributions are drawn from the same distribution. This is not the case, for example, between NGC 6752 and the ‘young’ globular cluster Ruprecht 106. Rigorous tests of mass distributions for different clusters have not, to the author’s knowledge, often been considered to date (but see Dixon et al. 1996 for the case of M79). In addition, the Lee index is insensitive to HB variations if the stars all lie blueward of the instability strip. This is unfortunate since we are interested in placing bounds on the ages of the oldest clusters. More studies and tests of the mass distribution are a crucial addition to this field, requiring large samples of data and goodness-of-fit tests.
1.3 The Horizontal Branch and UV-Bright Stars
In the last 5 years a fair proportion of the theoretical work on HB stars has focussed on the blue extreme members of this phase (Brocato et al. 1990; Castellani & Tornambè 1991; Horch, Demarque & Pinsonneault 1992; Dorman, et al. 1993; Bressan, Chiosi, & Fagotto 1994). The reason for this is that extragalactic stellar populations that have no sign of recent star formation or nuclear activity are invariably detected in the far-ultraviolet (Code & Welch 1979; Burstein et al. 1988). HB stars have gained a new significance for stellar population studies as they are potentially the largest contributions to the integrated light of a galaxy at vacuum ultraviolet wavelengths. They are both reasonably bright, and very long lived compared to other candidates from old populations viz. Post-AGB stars, of which the Planetary Nebula Nuclei form a subset. Fig. 1 makes it clear that both hot HB and EHB/AGB-Manqué stars produce UV flux well in excess of the Post-AGB stars. The figure emphasizes that all of the following categories of stars are UV-bright: (a) blue HB stars, as found in metal poor globular clusters (Watson et al. 1994); (b) EHB stars, as found in the Galactic disk as subdwarf B (sdB) stars (e.g. Saffer & Liebert 1995; Heber 1992); (c) AGB-Manqué stars, which probably correspond to the subdwarf O stars (e.g. Dorman et al. 1995 and references therein). These latter are the post-HB (He shell-burning) descendants of the EHB stars. The largest sample of EHB stars observed in a globular cluster is that found in Centauri (Figure 3), which is thus not only the largest globular cluster but also turns out to have the bluest HB.

Figure 3 shows the color-magnitude diagram of Whitney et al. (1994), from the Ultraviolet Imaging Telescope (UIT) that flew on the Space Shuttle in December 1990. The space observation has been combined with ground-based Stromgren photometry covering the centre of the cluster, which is completely resolved in both. The observations are overlaid with theoretical tracks from Dorman et al. (1993). The redder stars in the diagram () correspond to the HB tail as seen in clusters such as M13, while the bluest objects appear to form a separate clump. An unresolved problem is their relative faintness compared to the theoretical sequences; in contrast the cooler stars fit the theory within the photometric errors This problem may be resolved by HST Cycle 5 observations currently in reduction (Whitney et al. 1996, in preparation). The apparent separateness of the bluer stars may imply that a different mass loss mechanism is involved in their creation. The large numbers imply a single-star origin rather than one due to binary interactions. The same separation is observed between the Galactic field hot subdwarfs and the field blue HB (Greenstein & Sargent 1974; Heber 1992), and also in the globular cluster NGC 6752 (Buonanno et al. 1986).
1.4 Outline of this Paper
The question we wish to address here is ‘What theoretical work needs to be done in order to improve our understanding of the phase and/or agreement with observations?’ To answer this question, I start by reviewing the effect of new physics on HB models; for reasons that are clear, the effect is limited, except for the study of RR Lyrae masses. I then review the evolution of the convective core and the controversial question of the late time evolution and the so-called ‘breathing pulses’ found in models close to helium exhaustion. These are a source of some uncertainty in population synthesis applications. I adopt the view here that ‘canonical semiconvection’ provides a description of the core evolution that is consistent with observation, and in turn implies that, while the core evolution may not be completely smooth, the larger manifestations of the breathing phenomenon found in evolution codes are artificial.
The most overwhelming uncertainty, however, is that of mass loss in red giant stars, because it affects not just the fine details but the gross properties of the stars. Of course, such phenomena are not strictly speaking within the scope of this paper. However we will summarize some recent work on the possible relation between individual stellar properties (rotation, surface composition) on horizontal branch morphology in section 3. Another source of uncertainty that needs to be resolved is the relation between HB luminosity and metallicity (see also the review by Chaboyer, this volume). This represents a potential serious problem either in our understanding of the HB phase or in the evolution of Galactic chemistry. We will address this in section 4. The reader is also referred to the excellent review of theory and its comparison with observation by Renzini & Fusi Pecci (1988).
2 The Current State of the Theory
2.1 New Physics & Null Results
The new generation of opacity calculations by the OPAL and OP projects (Rogers & Iglesias 1992; Seaton et al. 1994), which were spurred by the Cepheid mass discrepancy (Simon 1982), have made significant breakthroughs in the reconciliation of pulsation and evolution theory (see the conference volume by Nemec & Matthews 1993). The Cepheid masses are now in agreement, and the RR Lyrae mass discrepancy (Cox, Hodson & Clancy 1983) has been rendered insignificant. Yet their impact on the gross properties of the HB stars themselves is small (Dorman 1993; Yi, Lee, & Demarque 1993). Why is this? Major revisions in the opacities have significantly increased the opacity due to iron at temperatures of a few hundred thousand degrees. However, the opacity deep in the stellar interior has not been greatly revised. The luminosity of HB stars is determined by the and by the envelope opacity, which both act to regulate the hydrogen burning shell (Dorman 1992). It is currently thought that the opacity of elements that are either fully ionized or ionized to the hydrogenic level are fairly well understood, so that no major revisions are expected. Since the opacity function within a star is typically dominated by minority elements, one may well ask whether some unaccounted for opacity source may yet shake the current accord between the two major opacity ‘providers.’ The answer may well be negative simply because suitable candidate elements are simply too rare (see Iglesias et al. 1995), but this is one remaining avenue for revisions in the physics that might cause changes in the evolution. However, such changes may also seriously affect age estimates made using theoretical isochrones.
Unlike the case with the opacity the equation of state (EOS) is dominated by the majority ions, hydrogen and helium. This is because the effects of different elements add harmonically (Fontaine et al. 1977) through the ‘additive volume’ law, strictly correct for non-interacting gas species by application of the First Law of Thermodynamics. Thus, simple models of the gas give good results until carbon and oxygen dominate as constituents, later in the HB phase. The main additional consideration is the consistent inclusion of non-ideal effects, chiefly Coulomb forces and the phenomenon loosely referred to as ‘pressure ionization,’ by which elements stay ionized at high pressures contrary to the prediction of the ideal gas Saha formula. The problems involving the latter are not specific to helium burning. However simple calculations show that, while the gas in the He-burning cores is close to ideal (the Coulomb parameter ) at the ZAHB, the carbon and oxygen abundances increase with burning so that at later stages of evolution. Unfortunately we do not yet have an EOS that is appropriate for a partially relativistically degenerate gas with relatively strong Coulomb interactions. However the fact that the gas is close to ideal (and non-degenerate, for that matter) close to the ZAHB implies that EOS effects will not change the luminosity significantly. The track morphology may however be affected, modifying the conclusions to be drawn from detailed studies of HB morphology. But it seems that such modifications will change nothing except the quantitative details of stellar mass distributions.
For the reaction rates the greatest source of uncertainty has been the rate. The rates given by Caughlan et al. (1985) and Caughlan & Fowler (1988) differed by a factor of 3. The earlier, higher rate gives terminal C:O ratio 1:4, whereas the later rate implies the same ratio is nearly 1:1. The difference may be important for the study of white dwarf cooling times, but the effect on HB morphology is once again slight, involving a change in the precise temperature width of blueward loops (Dorman, Lee, & VandenBerg 1991). Weaver & Woosley (1993) determined from a study of nucleosynthesis yields in supernovæ that the ‘true’ rate of this reaction was () times the Caughlan & Fowler (1988) rate. Recent experimental work (Arnould, these proceedings) appears to corroborate this finding.
To summarize, one can scarcely do better today than to quote Iben and Renzini (1984, p.357): “We do not infer that standard stellar models are therefore correct. We do note, however, that there are many quantitative matches between standard model characteristics and cluster characteristics … and caution that changes in the stellar physics that are invoked to produce non-standard models at some desired age may possibly destroy the good matches with other cluster characteristics that now exist.”
2.2 Evolution of the Convective Core
2.2.1 A Criterion for ‘Semiconvection’ or ‘Partial Mixing’
As is well-known, helium burning stars develop convective cores very close to the onset of central helium burning. The opacity increases in the convective core because of the carbon enrichment produced by the nuclear reactions. After the nuclear-processed material has been cycled to the outer boundary of the core, it will have cooled enough to be unstable to convection. The convective region must therefore penetrate into the overlying radiative layers (see Renzini 1977) and the core will grow so that it retains convective stability at its outer boundary, additionally taking in unprocessed He. A time is reached, however, when the core expands to a point such that engulfing fresh helium does not stabilize its outer layers. We determine stability by the Schwarzschild (1906) criterion (one may also suppose that the core overshoots the boundary determined by this criterion, to a point where the gases are decelerated to zero, but this should not qualitatively affect the argument). At this time, instead of decreasing beyond the edge of the core, for a homogenous mixture the gas is instead “more” convectively unstable owing to a local minimum in the ratio at the boundary. Here, I summarize the criterion of Dorman & Rood (1993) for the size the convective core must attain before the critical point is reached.
Define
| (1) |
where the variables take their usual meanings and are functions of radius. We seek the point where the derivative This point will have significance only if, in addition, the stability criterion is satisfied where the derivative changes sign, ı.e. if where at some point during the evolution. Denote this critical point by The derivation is similar to that of Naur & Osterbrock (1953), except that no explicit analytical form is substituted for the solution. Instead, the resulting expression locating can easily be used in a stellar evolution code, as one needs to compute all of the necessary quantities for other purposes.
Recall the definitions of the Homology Invariants (Schwarzschild 1958):
| (2) |
Differentiation of (1) yields
| (3) |
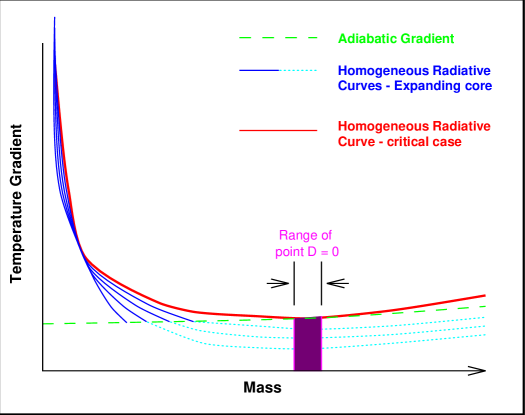
Consider the terms in this equation. Away from the centre , so is small. The derivatives of and with respect to pressure and temperature can be qualitatively summarized as follows: and are small away from ionization zones and where the radiation pressure is small, and and are slowly varying with time. In fact since we can write the opacity as the sum of free-free (Kramers-like) and electron scattering terms, with the former contributing about 20% of the total opacity, we can show that the opacity derivatives also change slowly. It should be emphasized that only a relatively small change in the opacity is sufficient to drive the core boundary outward. Thus tends to occur at a slowly varying value of throughout evolution. In addition and being homology invariant, do not change with composition at a fixed mass co-ordinate provided the core remains convective. Since the core initially grows monotonically in mass with increasing carbon abundance, the point will encountered at some time during the evolution. The situation is illustrated in Fig. 4, which shows schematically the radiative and adiabatic gradients as a function of mass. The key point is that for any core composition there is a point where because it is approximately fixed in coordinates. It becomes a critical point only when the core has grown sufficiently to encompass it.
2.2.2 Partial Mixing Zones
What will happen after the critical point is reached? If the gas must obey the stability criterion, then the convective core cannot expand to produce a larger fully mixed core, nor can it stay the same size. The operation of any of the processes proposed to induce convective overshooting will be much faster than the nuclear timescale. Thus of most interest to modelling the evolution is what will be the mean long-term behaviour of the carbon (and later oxygen) enriched gas that moves outward. The minimum degree of mixing possible under the assumption that the gas is, on average, subadiabatic or neutrally stable, is that material reaching the convective core boundary will continue to move until it has mixed with its surroundings sufficiently in order to be stable. This is the physical reasoning behind the ‘canonical semiconvection prescription,’ in which it is assumed that the gas achieves convective neutrality beyond Now the undisturbed, almost pure helium mixture beyond the convective core tends to be strongly radiative, and mixing fully with the more carbon rich core would make it convectively unstable. It follows that if the mixture above the core must have it will reach equilibrium at an intermediate composition. The actual composition at neutrality is dependent on the local conditions, implying a composition gradient. This argument holds as long as is not strongly affected by changes in the radiation pressure (so that the core remains homologous with time) and the opacity has a significant component which is Kramers-type (i.e. the opacity is not overwhelmed by scattering processes). My calculations indicate that all stars with must contain a partial mixing zone; whatever processes do occur outside the convective core must be mediated by such a partially mixed region.
The attractiveness of this picture is that we do not need to know what process causes the overshooting to determine the composition profile. The constraint that the mixture should be stable on timescales longer than the convective timescale implies a ‘thermodynamic’ constraint on the structure of the core, in the sense that whatever the details of the processes, the structure of the core must obey certain rules. However, the details may well be mitigated by the effects of overshooting beyond the boundary. Also, depending on the efficiency of mixing processes, the evolution may or may not be smooth on short timescales. Our evolution codes are not sufficiently detailed to address such questions, especially as spherically symmetric 1-D calculations can only model global perturbations. Since ‘canonical semiconvection’ is also consistent with the ratio of HB stars to AGB stars (Dorman & Rood 1993; Renzini & Fusi Pecci 1988), it is tempting to conclude that this mechanism for regulating the flow of helium into the core provides a reasonably accurate ‘zeroth order’ approximation to the true evolution of He burning cores. The theory requires no free parameters except that convective overshooting is efficient enough to allow the required mixing—a very weak condition.
2.2.3 Late He Burning Evolution & the Breathing Pulse ‘Phenomenon’
Relatively late in the core He-evolution (, increasing to for converging to the chemical profile which has neutral convective stability apparently becomes more difficult. Evolution codes tend to produce core ‘breathing pulses’ (BPs), in which the core expands suddenly in mass and radius, the central temperature drops, the central helium abundance rises, and as a result the direction of evolution is temporarily reversed. However, inspection of the terms in shows that none of them have a tendency to cause an increase in the core size at late times. In particular, the opacity that drives the core boundary outward earlier in the evolution must start to decline before core exhaustion is reached. Assuming that the opacity is part free-free and part electron scattering, its time dependence can be written
| (4) |
for helium abundance and carbon abundance and where each of the time derivatives of composition are composed of two terms, e.g. for helium
| (5) |
signifying the effect of mixing and of nuclear reactions. It is clear that the two terms in equation 4 are of different sign in general. The coefficient of is negative ( whilst the other term is positive, as the opacity increases with decreasing Again, the terms in equation 5 are also opposite in sign: nuclear reactions will always decrease the He abundance, while mixing will tend to increase it.
As , clearly the composition changes must tend to zero and the opacity must start to decrease. Thus at some point before exhaustion, the opacity derivative at a fixed point in the model tends to zero. Dorman & Rood (1993) argue that it is this circumstance that makes the end of core helium burning difficult to model. They suggest that the attempt by a partial mixing routine that depends on the derivatives of opacity to produce a neutrally stable mixture is problematical, because as the code attempts to find a solution with it may find one with negative and positive – which gives rise to a classic instance of the BP phenomenon. It is not, however, clear that this is correct, since various different iteration schemes all produce the pulses. Note however that the BPs need to be induced by localized mixing events rather than by a global phenomenon, since the mixing itself must be driven by the sum of such local events. The process is impossible to model with a 1-dimensional code; unfortunately, more realistic simulations of convective cores still seem a long way off. The case of BPs is quite unlike that of the helium shell burning thermal pulse phenomenon on the AGB, where the evolution of global quantities brings about a thermal runaway (Schwarzschild & Härm 1965). In addition, the BPs have the following numerical characteristics: they are not repeatable from model to model, and they appear discontinuously: a ‘normal’ model is followed by one with a large change in composition. Both of these are untrue of the thermal pulses, which are highly repeatable and manifest themselves by a steadily accelerating absorption of thermal energy within the star as the helium shell grows exponentially in power output.
There is, however, indirect evidence of irregularities in the evolution. There are well-documented cases of period decreases in RR Lyræ stars (see Silbermann & Smith 1995 for a recent detailed examination); several have been observed using data collected over the last hundred years. However, the connection with the breathing pulses is not firmly established. The period change timescale is much shorter than the timesteps used in any evolutionary model; the period ‘noise’ predicted from BPs has never been studied in sufficient detail to establish the connection. Finally, the larger pulses that have been modelled in evolution codes would produce changes in period that are far larger than anything that has been observed. Possibly, convection in the core is not totally smooth in its operation, and mixing occurs spasmodically (see Sweigart 1990). In the absence of other phenomena in the variable star envelope that may affect the radius, core instabilities may explain the period changes. However, the question remains open, and is impossible to decide without detailed models of the core mixing mechanism.
3 RGB Mass Loss: Whence the Dispersion?
As has been stressed earlier, the most fundamental missing piece to our understanding of the HB phase is the nature and physics behind mass loss (Fusi Pecci & Renzini 1976). It is clear from the observational record that both the mean mass loss and its dispersion varies among clusters. Mass loss in red giants is observed as H emission wings (Cacciari & Freeman 1983), but such observations do not at present provide mass loss rates. As Renzini & Fusi Pecci (1988) have noted, the best constraints on RGB mass loss come from the HB mass distribution itself, which is not entirely helpful here. The underlying mechanisms for mass loss must include detailed study of such phenomena as molecular line driven winds and the effects of grain opacity (Holzer & MacGregor 1985; MacGregor & Stencel 1992). Briefly, in order to be effective, such sources for coupling the stellar atmosphere to the radiation field must be operative relatively close to the photosphere in order to produce appreciable mass loss.
In this section, I discuss another aspect of the problem: the connection between variations in the properties of individual stars in clusters with widely different HB morphologies. The question is whether we can demonstrate some variation among properties of red giants that corresponds to a difference on the HB. Fortunately, there is now one set of clusters, M3 and M13, that can serve as a case study, although (as might be expected) the results are not yet conclusive. The globular cluster M13 has the ‘blue tail’ HB morphology, with very few stars in the instability strip and with the HB reaching to the main sequence turnoff magnitude in the band. In contrast, M3 has many variables and its HB extends from the red clump to well blueward of the instability strip but only to By their technique of shifting the cluster fiducial main sequence/subgiant/giant sequences to determine differential ages, VandenBerg, Bolte, & Stetson (1990) concluded that the clusters do not differ in age more than 2 Gyr, a conclusion supported by the recent work of Catelan & de Freitas Pacheco (1995).
A complete sample of the brightest red giants in these clusters have been studied spectroscopically by Kraft et al. (1993). Detailed abundance analysis using a number of iron lines implies that their metallicities are indistinguishable: in both clusters (see their Fig. 2). However, analysis of their oxygen abundances gave the surprising result that many of the M13 giants are very oxygen poor, with as low as similarly low abundances were not found in M3. The inference is that the super-O-poor stars dredge up layers that have been strongly affected by CNO processing. In order to do this however, some mixing mechanism must act far below the lower boundary of the convective envelope (e.g. Sweigart and Mengel 1979; see also the recent work of Smith & Tout 1992). The preponderance of the anomalous stars close to the RGB tip also suggests that the final mixing occurs very soon ( Myr) prior to the He-flash.
An obvious ‘individual property’ responsible for variations in the mixing and therefore the abundances is rotation. Peterson, Rood, & Crocker (1996) have obtained both oxygen abundances and rotational velocities for 29 stars in M13 and 22 stars in M3. The object of their study was to determine whether there was a relation between the oxygen abundance or the rotational velocities on HB location. In M13, in the temperature range where they had good sensitivity to O, they found no super-O-poor stars. This suggests that they have undergone large amounts of mass loss and are confined to the extreme blue tail of the HB. However, in both clusters the oxygen abundances inferred show no strong trend with temperature although both samples are confined to a narrow strip of the HB. As far as the rotation was concerned they found no obvious dependence of on HB colour. The fastest rotators, found in M13, had and the distribution of is bimodal. The rotation velocities of M3 stars were found to be with no trend with temperature. The overall difference between the global rotation/O abundance patterns between M13 and M3 leaves open the possibility that rotation may play some role in HB morphology. With the current data there is no evidence that rotation determines HB location on a star-to-star basis in a given cluster. However, given that any correlation is likely to be quite noisy, a definitive result must await observations of rotation spanning the full range of the HB.
4 MV vs [Fe/H]: The Zero Point Uncertainty
In this final section, I discuss one of the ‘classical’ problems with of the HB, viz. the relationship between its luminosity and metallicity. The properties of the HB play a key role in the determination of the ages of globular clusters. Not only does the ‘horizontalness’ and theoretical invariance of the HB with age make the HB sequence an important standard candle, but the fact that it may contain the RR Lyræ instability strip reinforces this status by allowing (in principle at least) an independent check on HB parameters. A separate but related question is the so-called Sandage Period Shift Effect, which can is an apparent inconsistency between the observed pulsational properties of RR Lyræ stars and those predicted from static theoretical models. The literature on both of these questions is extensive, and I here try to summarize some of the more recent work. Useful references are the review by Sandage (1986), and the detailed discussions by Buonanno, Corsi, & Fusi Pecci (1989); Lee, Demarque, & Zinn (1990), Sandage (1990); Sandage & Cacciari (1990) and a rigorous reanalysis by Fernley (1993).
The data for mean HB magnitudes for different clusters are fit to a linear relation of the form
| (6) |
In the last 3-4 years a consensus has emerged that the slope of the observed relationship is small, in the range 0.15–0.20. This is in excellent agreement with the slope of theoretical sequences (Lee, Demarque, & Zinn 1990; Dorman 1993). There is some controversy about the value of the zero point This zero point affects age determinations of clusters through the use of the magnitude difference between the main sequence turnoff and the HB, as an age indicator (Chaboyer, this volume; Chaboyer, Demarque, & Sarajedini 1996).
Baade-Wesselink (BW) analyses also give a small slope in equation (6), (Carney, Storm, & Jones 1992; Clementini et al. 1992; Fernley 1994). This is in contrast to typical results of the main sequence fitting technique, which are derived using the so-called ‘theoreticians route to distances’ (Sandage 1986; Buonanno et al. 1989). This method involves fitting theoretical isochrones (as opposed to empirical main sequences) to cluster data in order to derive distances. The slope derived by Sandage and Cacciari (1990) was Sandage’s analysis of the period-shift data also implies a steep slope (Buonanno et al. 1989). That is, he finds (Sandage 1982)
| (7) |
which, when taken with the van Albada & Baker (1971) pulsation equation, ( at fixed ), yields This is the connection between these two classical problems.
Carney et al. (1992) reanalyzed the results of main sequence fitting. By demonstrating the existence of a metallicity dependent error in the theoretical they were able to reconcile the data to a slope Fernley’s (1993) analysis of a carefully selected sample of RR Lyræ stars and temperature determinations using optical/IR colours yield a much lower period shift with metallicity (a coefficient of 0.073 in equation 7) which reduces the slope to about 0.2.
But the BW analyses also consistently find a zero point In contrast, theoretical ZAHBs (Lee, Demarque, & Zinn 1990) give values for respectively (recall that due to the first dredge-up). The profound implication of the controversy is that the fainter zero point implies, using current theoretical models, a lower value for than is consistent with estimates from primordial nucleosynthesis and worsening the disagreement between the implied expansion age of the universe and that of the globular cluster system. For the reasons explained in §2, there is relatively little room for manoeuvre in the theoretical relations; the (correctly observed and interpreted) magnitudes should allow a measure of the helium abundance of the globular cluster system and should be consistent with other techniques, in particular the method (see Buzzoni et al. 1983). My bias lies toward the suggestion that there is some systematic error in the methods that obtain the fainter distance scale, as also suggested by Castellani & de Santis 1994; the reader is referred to the review by Chaboyer for a different viewpoint.
Consistent with the ‘faint’ RR Lyræ distance scale are statistical parallax analyses (Barnes & Hawley 1986). They found
| (8) |
which for a mean RR Lyræ metallicity lies in between the two scales, although not formally inconsistent with either. However, Layden, Hanson, & Hawley (1994, in preparation) have gathered a larger sample, and their data are reportedly compatible with the Carney et al. (1992) faint relation. As for the error bars attached to these techniques, Clementini et al. (1992) quote a typical uncertainty for the surface brightness and IR flux versions of mag, about the size of the discrepancy between the two scales. The statistical parallax techniques have typical uncertainties mag; however in both cases the reason for a systematic effect that would cause an offset toward fainter magnitudes is not obvious. Fernley (1994) has argued for an upward revision of the BW luminosities, still leaving a discrepancy over 0.1 mag with the bright distance scale, but moving the BW results in the right direction.
In more direct support of the brighter distance scale implied by models with ‘canonical’ helium abundance is the LMC RR Lyræ data of Walker (1992). He studied 182 variables in 7 clusters. Assuming the Cepheid distance scale to the Cloud, gives consistent within the errors with the theoretical tracks of higher The Walker zero point appears to be supported by data from three M31 globulars observed by HST (Faber 1995, private communication).
As well, for the main-sequence fitting data studied by Carney et al. (1992, their Table 1), applying their corrections to the main sequence fitting-derived distances implies the brighter distance scale with , rather than the relation they favour. They also argue from the statistical parallax between the parallax subdwarf Groombridge 1830 (HD 103095) and the globular cluster M5 in favour of the BW zero point. However, the main sequence of M5 at the colour of HD 103095 is rather wide owing to photometric uncertainty on the lower main sequence. The distance that they quote for M5 is derived by main-sequence fitting uncorrected for the metallicity dependent colour term they find.
To summarize, we cannot yet determine exactly how bright the HB stars are directly from the RR Lyræ observations, but reconciling the remaining discrepancies between the two possible cluster distance/age scales that result is a high priority. As is also the case with the faint blue HB stars found in Centauri (Fig 3), resolution of the difference in favour of the observations may yet require some important rethinking of HB
Acknowledgements
I would like to acknowledge a Research Associateship from the US National Research Council, and support from NASA RTOP 188-41-51-03. I would also like to express appreciation for helpful discussions with Forrest Rogers, Carlos Iglesias, Allen Sweigart, Bob Rood, and Ruth Peterson.
References
Barnes, T. G., & Hawley, S. L., 1986, ApJ, 307, L9
Bressan, A., Chiosi, C., & Fagotto, F., 1994, ApJS, 94, 63
Briley, M. M., Hesser, J. E., Bell, R. A., Bolte, M. J., & Smith, G. H., 1994, AJ, 108, 2183
Brocato, E., Matteucci, F., Mazzitelli, I., & Tornambè, A., 1990, ApJ, 349, 458
Buonanno, R., Corsi, C. E., & Fusi Pecci, F., 1989, A&A, 216, 80
Buonanno, R., Corsi, C. E., Gratton, R., Caloi, V., & Castellani, V., 1986, A&AS, 66, 79
Buzzoni, A., Fusi Pecci, F., Buonanno, R., & Corsi, C. E., 1983, A&A, 128, 94
Burstein, D., Bertola, F., Buson, L., Faber, S. M., & Lauer, T. R., 1988, ApJ, 324, 440
Cacciari, C. & Freeman, K. C., 1983, ApJ, 268, 185
Castellani, M., & Tornambè, A., 1991, ApJ, 381, 393
Castellani, V., & de Santis, R., 1994, ApJ, 430, 624
Carney, B., Storm, J. & Jones, R. V., 1992, ApJ, 386, 663
Catelan, M. & de Freitas Pacheco, J., 1995, A&A, 297, 345
Caughlan, G., & Fowler, W., 1988, Atom. & Nuc. Data Tab., 40, 283
Caughlan, G., Fowler, W., Harris, M. J., & Zimmerman, B. A., 1985, Atom. & Nuc. Data Tab., 32, 192
Chaboyer, B., Demarque, P., & Sarajedini, A., ApJ, 1996, in press
Clementini, G., Cacciari, C., Fernley, J., & Merighi, R., 1992, Mem. S. A. It., 63, 397
Code, A. D. & Welch, G. A., 1979, ApJ, 228, 95
Cox, A.N., Hodson, S. W., & Clancy, S. P., 1983, ApJ, 266, 94
D’Cruz, N., Dorman, B., Rood, R. T., & O’Connell, R. W., 1996, ApJ, in press
Dixon, W. V., Davidsen, A. F., Dorman, B., & Ferguson, H. C., 1996, AJ, submitted
Dorman, B., 1992, ApJS, 80, 701
, 1993 in The Globular Cluster-Galaxy Connection eds. J. P. Brodie & G. H. Smith (San Francisco:ASP) p. 198
Dorman, B., Lee, Y.-W., & VandenBerg D. A., 1991, ApJ, 366, 115
Dorman, B., O’Connell, R. W., & Rood, R. T., 1995, ApJ, 442, 105
Dorman, B. & Rood, R. T., 1993, ApJ, 409, 387
Dorman, B., Rood, R. T., & O’Connell, R. W., 1993, ApJ, 419, 596
Fernley, J., 1993, A&A, 268, 591
, 1994, A&A, 284, L16
Fontaine, G., Graboske, H., & van Horn, H. M., 1977, ApJS, 35, 293
Fusi Pecci, F., Cacciari, C., Bellazzini, M., & Ferraro, F., 1995, AJ, 110, 1664
Fusi Pecci, F. & Renzini, A., 1976, A&A, 46, 447
Greenstein, J. L., & Sargent, A. I., 1974, ApJS, 28, 157
Greggio, L. & Renzini, A., 1990, ApJ, 360, 35
Heber, U. 1992 in The Atmospheres of Early-Type Stars eds. U. Heber & C. S. Jeffery, (Springer: Berlin) p.233
Holzer, T. E. & MacGregor, K. B. 1985 in Mass Loss from Red Giants eds. M. Morris & B. Zuckerman (Dordrecht:Reidel) p.229
Horch, E., Demarque, P., & Pinsonneault, M., 1992, ApJ, 388, L53
Iben, I., Jr & Renzini, A., 1984, Phys. Rep., 105, 329
Iben, I., Jr & Rood, R. T., 1970, ApJ, 161, 587
Iglesias, C. A., Wilson, B. G., Rogers, F. J., Goldstein, W. H., Bar-Shalom, A., & Oreg, J., 1995, ApJ, 445, 855
Kraft, R. P., Sneden, C., Langer, G. E., & Shetrone, M., 1993, AJ, 106, 1490
Lee, Y.-W., Demarque, P., & Zinn R. J., 1990, ApJ, 350, 155
, 1994, ApJ, 423, 265
MacGregor, K. B. & Stencel, R. E., 1992, ApJ, 397, 644
McLaughlin, D. E., & Pudritz, R., 1996, ApJ, submitted
Naur, P. E. & Osterbrock, D., 1953, ApJ, 117, 306
Nemec, J. & Matthews, J. A. 1993 New Perspectives on Stellar Pulsation and Evolution (Cambridge:CUP)
Peterson, R. C., Rood, R. T., & Crocker, D. A., 1995, ApJ, 453, 214
Renzini, A. 1977 in Advanced Stages of Stellar Evolution (Geneva:Geneva Obs.), p.149
Renzini, A., & Fusi Pecci, F., 1988, ARA&A, 26, 199
Rogers, F. J., & Iglesias, C. A., 1992, ApJS, 79, 507
Rood, R. T., 1973, ApJ, 184, 815
Saffer, R. A. & Liebert, J. W. 1995 in Proceedings of the 9th European Workshop on White Dwarfs eds. D. Koester & K. Werner (Berlin:Springer) p.221
Sandage, A., 1982, ApJ, 252, 553
, 1986, ARA&A, 24, 421
, 1990, ApJ, 350, 631
Sandage, A. & Cacciari, C., 1990, ApJ, 350, 645
Schwarzschild, K., 1906, Gott. Nach., 1, 41
Schwarzschild, M. 1958 The Structure and Evolution of the Stars (Princeton:PUP)
Schwarzschild, M. 1958 & Härm, R., 1965, ApJ, 142, 855
Searle, L., & Zinn, R. J., 1978, ApJ, 225, 357
Seaton, M. J., Yan, Y., Mihalas, D., & Pradhan, A. K., 1994, MNRAS, 266, 805
Silbermann, N. A. & Smith, H. A., 1995, AJ, 109, 1119
Smith, G. H. & Tout, C. A., 1992, MNRAS, 256, 449
Simon, N. R., 1982, ApJ, 260, L87
Sweigart, A. V. 1990 in The Confrontation Between Stellar Evolution and Pulsation, eds. C. Cacciari & G. Clementini (San Francisco:ASP) p.1
Sweigart, A.V., & Mengel, J. E., 1979, ApJ, 229, 624
van Albada, T. S. & Baker, N., 1971, ApJ, 169, 311
VandenBerg, D. A., Bolte, M. J., & Stetson, P. B., 1990, AJ, 100, 445
Walker, A. R., 1992, ApJ, 390, L81
Watson, A. M., et al., 1994, ApJ, 435, L55
Weaver, T. A. & Woosley, S. A., 1993, Phys. Rep., 227, 65
Whitney, J. H. et al., 1994, AJ, 108, 1350
Yi, S., Lee, Y.-W., & Demarque, P., 1993, ApJ, 411, L25
Zinn, R. J., 1980, ApJ, 241, 602
E. Schatzman: What are the masses and radii of the fast rotators (40 kms-1) ?
B. Dorman: Typical masses for blue HB stars are about 0.6 . The stars in question have surface temperatures 10000 K, which corresponds to between 1 and 2 Rotation is slower than seen in many normal pop I stars of similar spectral type.