Constraints on massive black holes as dark matter candidates using Galactic globular clusters
Abstract
This work considers the idea of massive black holes being the constituents of the Galactic dark matter halo. It constrains the maximum black hole mass to by examining their influence on the population of globular clusters in our Milky Way. In the adopted halo model, globular clusters are exposed to constant bombardment of halo objects on their orbits through the Galaxy and thus will steadily gain internal energy. Depending on the mass of these halo objects and the structural parameters of the globular clusters, they can be disrupted on time scales of a few billion years and below. These disruption time scales are calculated using a modification of the well known (classical) impulsive approximation and compared with direct N-body simulations of such encounter events to ensure the method works correctly. For a set of ten prototypical globular cluster models and black hole masses ranging from to , Monte-Carlo-simulations of encounter histories over the period of 10 billion years were calculated each, at three different galactocentric distances , and . These data were compared with the real globular cluster population in our Galaxy and used to obtain the above constraint of .
keywords:
black holes – dark matter – Galaxy: halo – Galaxy: globular clusters: general.1 Introduction
Comparison of dynamical and photometrical mass determinations in galaxies like our own strongly indicates the existence of a non-luminous dark matter component, that accounts for most of the mass in these galaxies. The constancy of -rotation curves even far beyond the optical edge of galactic disks furthermore indicates a -density distribution of this dark component (Rubin et. al. 1982, 1985). Thus one question naturally arises: What is the nature of this dark component? A whole variety of dark matter candidates have been proposed in the literature, ranging from light leptonic particles to baryonic gaseous matter (possibly in the form of cold molecular clouds with fractal structure; Pfenninger et. al. 1994a,b) to low mass stars such as white dwarfs or “Jupiters” and finally black holes with masses as remnants of a population of very massive primordial stars (for a brief overview see e.g. Chap. 18 in Peebles 1993 and references therein).
The latter are of theoretical interest, since the Jeans mass at high red shift (just after the epoch of recombination) was of the order of (Dicke & Peebles 1968) and black holes with this mass could very effectively heat an initially cold disk in our Galaxy explaining the observed properties (Lacey & Ostriker 1985). But there also are many arguments against massive black holes as main constituents of the Galactic dark halo. Hut & Rees (1992) argued that black holes with in the inner few kiloparsecs would sink into the Galactic center within a fraction of the Hubble time due to dynamical friction. This process would lead to consequences that strongly disagree with observations. Furthermore massive black holes would on passages through the Galactic disk accrete interstellar matter and thus violate background light constraints (Carr 1979). And massive black holes would finally cause gravitational lensing of cosmologically distant sources. Garrett et al. (1994) studied this effect on VLBI maps of the gravitational lens system and conclude that black holes with cannot account for the dark matter in the halo of the main lensing galaxy. Rix & Lake (1993) again applied the disk heating scenario to dwarf galaxies of the Local Group and derived an upper limit of . On the other hand, Carr, Bond & Arnett (1984) derived a strong lower limit of by examining the possible cosmological consequences of population III stars. Their black hole remnants must exceed this limit, otherwise the enrichment of the interstellar medium would be too pronounced.
This paper facilitates a different approach: it uses the fragility of globular clusters in our Galaxy to constrain . Adopting the hypothesis that the dark halo consists entirely of massive black holes, globular clusters are subject to constant bombardment of these objects on their orbits through the Milky Way. The observed properties of globular clusters thus set strong limits on the mass distribution of these black holes. To calculate the response of globular clusters to encounters with massive black holes we use a modification of the impulsive approximation (Spitzer 1958) and test this analytical approach by direct N-body simulations of such an event. The excellent agreement of both methods shows the validity of the assumptions of the analytical approach and allows us to study a large region in parameter space since this method consumes much less computer time. We obtain analytical values for the average internal energy gain of globular clusters due to the interaction with halo objects in the Milky Way. Since this energy gain is mostly determined by only few central encounters, the scatter around its mean value is very large. To account for that scatter and to be able to make statistically sound predictions, we adopt ten model clusters and compute for every one of them encounter histories each at three different galactocentric radii (, and ) and for a black hole mass range between and , applying Monte Carlo methods. If the increase of internal kinetic energy of the system exceeds its binding energy, we assume it dissolves. Thus we obtain the fraction of globular clusters, which would survive for years, depending on internal parameters, such as concentration and total mass, their galactocentric distance and the assumed black hole mass. Comparing that data with observations we constrain the maximum black hole mass to .
This value agrees with the mass range obtained by other authors using a variety of methods. It especially has to be compared with the numbers calculated by Moore (1993). He used similar arguments than this paper applies, but did not take the huge spread in internal energy gain for different encounter histories into account. He calculated for nine different globular clusters in the outer Galactic halo one encounter history each. Therefore his estimate is highly uncertain. Taking into account different encounter histories of individual globular clusters, the present work stands statistically on more solid ground than previous work, leading to a more precise estimate for the maximal allowed mass of compact dark halo objects.
2 Galactic Globular Clusters
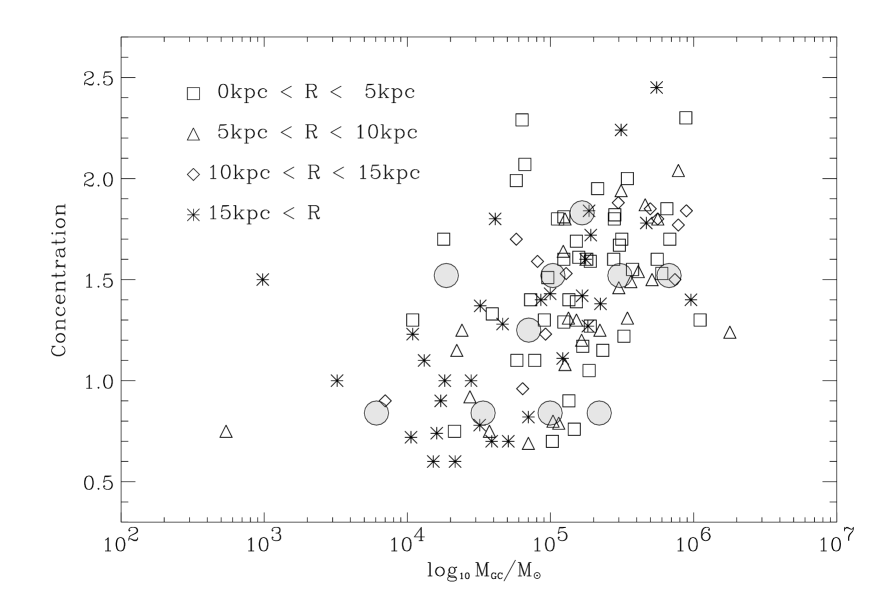
Galactic globular clusters can very well be fitted by a King density profile (King 1966, Illingworth & Illingworth 1976). King models are lowered nonsingular isothermal spheres, which are generated from the distribution function of an isothermal sphere by introducing an energy cut-off . This results in a radial cut-off at the tidal radius . King models form a sequence that can be parametrized by the concentration index . The core radius is determined by the central density and the central velocity dispersion :
| (1) |
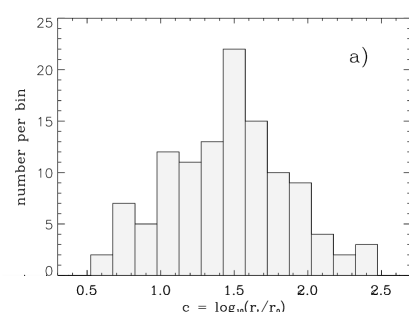
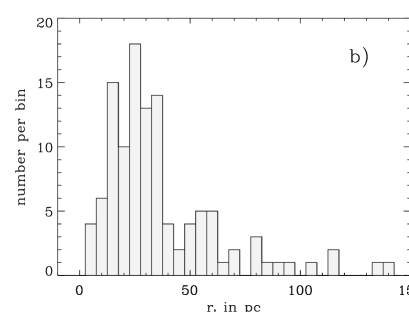
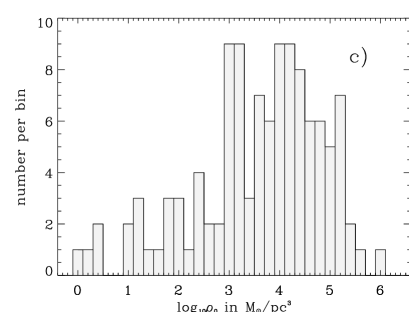
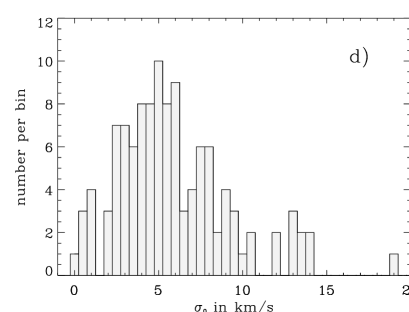
A compilation of these parameters for 134 galactic globular clusters from the Webbink (1985) data set is shown in Fig. 1.
According to this data we generated ten model clusters with different parameter combinations (see Tab. 1) to simulate the influence of massive compact halo objects on globular clusters of different sizes and concentrations. Models #0 to #3 have average concentration () and vary in their central dispersion from to . Models #4 to #7 are very little concentrated () and have the same variation in as above. Due to their lower concentration their total mass is smaller by a factor of roughly one third. The sequence #5, #8 and #9 ranges from small to large concentrations and has fixed . Model #1 represents the “mean” of the Galactic globular cluster system and will be called the standard cluster throughout this paper. For the numerical calculations, each of these clusters is represented by test particles of equal mass.
Plotting concentration index against total mass , Fig. 2 depicts that the Galactic population of globular clusters is fairly well sampled by the adopted set of model clusters (which are represented by the gray shaded circles). However this is not true for the central density , which in reality spans a range from to (see Fig. 1.c), whereas the model clusters have . This has to be taken into account in the later analysis, when comparing the numerical results with observations. Figure 2 also indicates an interesting mass-distance relationship. Globular clusters at smaller galactocentric radii tend to be more massive than more distant ones. Due to equation 1 this holds also for and : The inner globular clusters have on average higher central densities and larger velocity dispersions. Closer to the Galactic center, these globular clusters are more severely influenced by tidal shocking during passage through the Galactic disk (and bulge in the inner few kpc) and encounters with massive halo objects. Therefore they have to be more massive and sturdy to survive for a Hubble time.
| model | #0 | #1 | #2 | #3 |
|---|---|---|---|---|
| 1.53 | 1.53 | 1.53 | 1.53 | |
| in | ||||
| in | ||||
| in | 16.8 | 33.7 | 50.6 | 67.4 |
| in | 3.0 | 5.0 | 7.0 | 9.0 |
| in | ||||
| model | #4 | #5 | #6 | #7 |
| 0.84 | 0.84 | 0.84 | 0.84 | |
| in | ||||
| in | ||||
| in | 3.46 | 6.92 | 10.4 | 13.8 |
| in | 3.0 | 5.0 | 7.0 | 9.0 |
| in | ||||
| model | #5 | #8 | #9 | |
| 0.84 | 1.25 | 1.83 | ||
| in | ||||
| in | ||||
| in | 6.91 | 18.0 | 68.1 | |
| in | 5.0 | 5.0 | 5.0 | |
| in |
3 Modified Impulsive Approximation
3.1 Impulsive Approximation with Point Particles
To calculate the energy and momentum transfer between two point particles due to solely gravitational interaction, it is advisable to study the problem in the reduced co-ordinate system, i.e. one separates the relative motion of the two particles from the center of mass motion and follows the trajectory of the reduced particle as an one-body problem (Landau & Lifschitz 1976, Vol. I). The net velocity change of the reduced particle perpendicular and parallel to the initial direction is:
| (2.a) | |||||
| (2.b) | |||||
Here and are the masses of the two particles and is the scattering angle for the encounter. The variables and indicate impact parameter and initial relative velocity, respectively. always points in the opposite direction of the initial velocity and lies in the scattering plane.
The change of absolute velocity of particle is
| (3.a) | |||||
| (3.b) | |||||
For the second particle one just has to interchange the masses.
For large impact parameters, , the second term of the expression in brackets dominates and equations (3.a,b) reduce to the classical impulsive approximation, which assumes a very short encounter time such that one particle remains fixed in space whereas the other one moves along a straight line with constant velocity:
| (4.a) | |||||
| (4.b) |
Defining , these equations can be written as
| (5.a) | |||||
| (5.b) |
and
| (6) |
3.2 Influence of the Encounter Time


For the (classical) impulsive approximation to be valid, the encounter time has by far to be the shortest relevant time scale in the system under study. The particle can then be considered as fixed in space and momentum is transfered quasi-instantaneously. Thus, if a periodical oscillation of an individual star is superimposed on the linear center of mass trajectory of the whole system, the orbital period has to be much larger than the time scale of the external perturbation (). In the adiabatical limit (), the orbital energy of the star is not affected. The perturber “sees” the star as being smeared out over the whole periodic trajectory and hence can only interact with its center of mass averaged over the whole period; the orbit acts as a rigid body.
A very fast encounter of a massive black hole with a Galactic globular cluster can therefore effectively alter both the center of mass energy as well as the internal energy (i.e. the velocity dispersion: ) of the cluster, whereas a very slow encounter only affects the center of mass velocity of the system.
The orbital periods of stars in globular clusters differ by many orders of magnitude between stars in the core region and stars in the outer envelope. Thus for certain impact parameters and encounter velocities the impulsive approximation will be valid in the outer parts, whereas in the inner regions the adiabatic limit is reached. A realistic application of the impulsive approximation to these objects has to take this into account. Spitzer (1958) defined the relative duration of the interaction as being the fraction of the absolute encounter time relative to the orbital period of an individual cluster star: . Under the assumption of a harmonic cluster potential he was able to derive an analytical expression for a correction factor to parametrize the effectivity of the interaction (),
| (7) |
with
| (8.a) | |||||
| (8.b) | |||||
| (8.c) |
Here the are the modified Bessel functions of second rank and n-th order, the Macdonald functions. These follow for large the asymptotic formula (Bronstein & Semendjajew 1987). So, for small encounter times (and thus ) the (classical) impulsive approximation is recovered and for large durations () the adiabatical limit is reached, which means the effectivity of the interaction exponentially approaches zero.
Within the framework of this paper it is best suited to define the encounter time as the time interval within which (under idealized conditions, i.e. fixed particle location and straight moving perturber) of the total momentum transfer takes place: . The stars of a globular cluster move – under the assumption of circular orbits – with velocities in the potential where is the mass within the radius . The orbital period is then
| (9) |
and the relative duration of the encounter follows as
| (10) |
Figure 3.a shows the values of for the standard globular globular cluster (model #1, see Sect. 2) normalized to one at the half light radius . The correction factor (equation 7 scales as plotted in Fig. 3.b. The slight increase of the interaction efficiency for results from resonances between orbit and perturber potential. For a large interaction duration the adiabatical limit is reached, approached zero exponentially.
3.3 Application to Globular Clusters – Energy Transfer
To calculate the total energy input by an encounter with a massive black hole into a globular cluster as an extended object consisting of many ( ) stars, one best applies the modified impulsive approximation as derived above to every single star and then sums up. The increase of kinetic energy immediately after the encounter is
| (11) |
where is the change of kinetic energy of star and , and are its mass, its velocity within the cluster prior to the encounter and the resulting velocity change, respectively. The total change of kinetic energy is obtained by the statistical average
| (12) |
contains the center of mass acceleration of the whole cluster as well as its increase of internal energy. The later is the parameter of interest in the present context. It is to be compared with the binding energy of the system .
Since in this approach the stars within the cluster are considered as fixed in space during the encounter, the potential energy is not altered. Due to the increase of kinetic energy, the globular cluster has lost its virial equilibrium and begins to relax towards a new equilibrium state. Throughout this process kinetic energy is converted into potential energy and the cluster as a whole expands.and vice versa. Thereby it eventually evaporates stars through its tidal barrier and in strong interactions () dissolves completely (Chernoff & Weinberg 1990).
3.4 Comparision with Numerical N-Body Simulations
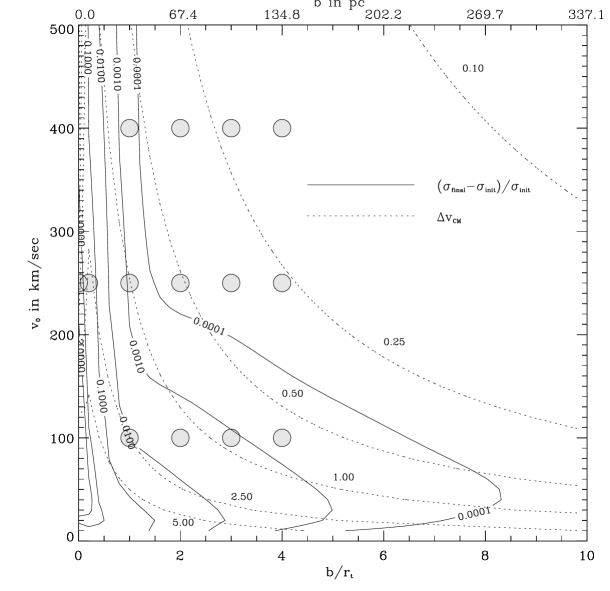
To test the accuracy of the above approximation, we have calculated the encounters of the standard globular cluster (model #1, see Sect. 2) with a black hole of mass for 14 different pairs of impact parameter and relative velocities using a standard Tree Code scheme (e.g. Barnes and Hut 1986, Hernquist 1987, 1990). We compare its result with the parameter study undertaken with the modified impulsive approximation described above. Figure 4 shows the relative increase of the internal velocity dispersion and of the center-of-mass velocity of the cluster in due to the encounter, as predicted by the impulsive approximation. The encounter speed varies from to , the impact parameter – scaled in units of the tidal radius of the globular cluster – from (black holes penetrates through the center of the cluster) via 1 (the black hole just touches the cluster) to 10 (distant encounter). The adiabatical correction factor has a strong influence for velocities smaller than . The amplification of the encounter effectiveness is due to resonances between perturber and the orbits of cluster stars (see equation (7) or Fig. 3) and pushes the lines of equal increase of velocity dispersion to larger impact parameters . In the upper half of the figure. i.e. for large encounter speeds, the adiabatical correction is negligible and the original hyperbolic shape of the lines is recovered. The center of mass motion is not affected by internal adiabatic effects. Therefore the lines of constant show the expected hyperbolic behavior throughout the whole considered parameter range. The shaded circles denote the parameter pairs for which additional N-body simulations were made. The results of these simulations were compared with the analytical predictions in Fig. 5. The numerically derived values for and agree remarkably well with the analytically derived ones. Therefore the modified impulsive approximation is an adequate tool to determine the increase of the internal energy of a globular cluster due to such encounters and thus the probability for the cluster to get disrupted.
4 Disruption Time Scales for the Standard Cluster
We adopt in our calculations a mass model for the Milky Way, which contains a bulge and disk component and a dark isothermal halo to account for the flat rotation curve with . The bulge is analytically represented by a Plummer spheroid with total mass and core radius . The disk component is calculated as double exponential with radial scale length and vertical scale height . Its density distribution is normalized to in the solar neighborhood (Allen 1973, §118). The dark halo results then in
| (13) |
where denotes the core radius. In the solar vicinity, i.e. for , one obtains a dark matter density of . Following the considerations of Lacey & Ostriker (1985) that this dark halo consists entirely of massive black holes with , there are about 10 of these objects in a volume of around the sun. In the center of the Galaxy we would expect approximately black holes per . The - density fall-off resembles that of an isothermal sphere and thus one can derive a velocity dispersion for these objects of
| (14) |
The velocity distribution of the black holes in one direction is then assumed to be Gaussian with zero mean and a standard deviation of .
We assume, that the globular clusters move on circular orbits with through this background medium of black holes. This is a somehow simplistic ansatz, but adequate for the so called thick disk population of globular clusters and a reasonable order of magnitude approximation for the old halo clusters. Then the number of encounters between these black holes and an individual globular cluster at a galactic radius with impact parameters in the interval and impact velocities within a period is
| (15) | |||||
The expression in brackets accounts for the Gaussian distribution of black hole velocities. Thus in the Milky Way the total number of encounters with within the time interval is
| (16) | |||||
The resulting numbers of encounters between black holes with and a standard cluster (model #1, see Tab. 1) at galactocentric distances , and within a period of years are given in Tab. 2.
| = | |||||
|---|---|---|---|---|---|
| = | |||||
| = | |||||
| = | |||||
| = | |||||
During its lifetime a globular cluster would experience very many encounters, even in the outer parts of the Galaxy. Clearly this bombardment would have devastating effects on the population of Galactic globulars, as will be quantified below.
To compute the gain of kinetic energy due to interactions with black holes, one has to convolve the number of encounters with the increase of the internal velocity dispersion per encounter of the globular cluster:
| (17) | |||||
Using the values of the standard cluster (model #1 with according to Fig. 4 and ), this results in
How well does the integral in equation 17 converge and which impact parameter dominate the result? These questions are addressed in Fig. 6. It shows the integrand (dotted line) at fixed and the resulting integral (solid line), as function of , the impact parameter normalized to the cluster radius. Saturation and thus convergence of the integral is reached already within the cluster itself. This indicates that only a relatively small number of central encounters with dominates the total energy gain.

The above calculation shows a large increase of the velocity dispersion of the standard cluster over the lifetime of the Milky Way, e.g. by a factor of 4.7 at a galactocentrical distance . No cluster would survive such a bombardment. But what is the scatter around the mean of this value? Equation (17) was obtained by integrating over a smoothed background distribution of dark halo objects. Under the assumption of black holes being the main constituent of the dark halo, this smoothness is no longer true: the distribution of matter in the halo is expected to be extremely coarse grained. Furthermore, the evolution of the globular cluster is mainly affected by encounters within the innermost region and these are relatively rare (as shown above). Which means the collision history and the resulting dispersion gain is strongly determined by only a handful events and thus one expects huge deviations from the mean for different encounter histories. Therefore, even if the average energy gain would rule out the survival of a certain type of globular clusters within reasonable distances from the galactic center, individual clusters might still be able to resist this destruction mechanism due to the expected large scatter in as a result of different encounter histories. A realistic study of the survival rate within a population of specific globular clusters must take this effect into account and apply statistical methods. This shall be done in the next section, which describes the Monte Carlo simulation of individual cluster histories within the Galaxy.

5 Monte Carlo Simulations of Individual Encounter Histories
The mean free path of particles with velocities in a sea of background particles with number density and cross section is . Thus the average time between two encounters with given impact parameter in the interval and relative velocity is
| (19) |
The number density of halo black holes is , adopting a halo density distribution , according to equation (13). The interaction cross section is for simple geometric arguments. Since the distribution of dark halo objects is assumed to be isothermal with velocity dispersion (see equation 14), the distribution of encounter velocities between the halo objects and a globular cluster is a Gaussian with standard deviation around the center of mass velocity of the globular cluster. Assuming they are moving on circular orbits with , one has to weight the velocity entering equation (19) with . This way we obtained the typical time interval between two encounters for the whole parameter region described in Sect. 3.4.
Transport theory (consult e.g. Landau & Lifschitz 1983, Vol. X) specifies the probability for a particle not to undergo an encounter in the time interval as . Therefore, the probability that a globular cluster actually does encounter a black hole within and with interaction parameters , results as . The time interval corresponding to a given probability is then . Since encounters with different impact parameters and are statistically independent, one can handle each grid point in parameter space separately. For each pair we throw a dice to obtain a random probability and translate this random number into a time interval as described above. If is smaller than the studied total time interval (here initially years), then we accept the encounter event, i.e. add to the velocity dispersion of the cluster and substract from , leading to a remaining time . This procedure is repeated, until the time interval to the next encounter becomes larger than the remaining time .
Figure 7 visualizes the distribution of after years for the standard cluster (model #1) in a galactic dark halo of black holes at three different galactic radii. The average dispersion gain at these radii agrees well with the value obtained in the last section, using a smooth background distribution (equation (4). However, the histogram shows the expected huge scatter due to the discreteness of the encounter events. Adopting the binding energy of the cluster as threshold for its disruption, we determine the fraction of the clusters that get destroyed in the simulation: Whenever the total kinetic energy of the cluster stars exceeds the binding energy of the system, i.e. when , we assume the cluster has dissolved over the studied time interval. This threshold of is a somehow crude approximation. We therefore have performed N-body calculations of encounters with , which indicate that the mass loss during such an event is so severe, that the cluster either dissolves instantaneously or the remaining (bound) stars relax back into an equilibrium state that is much less viable and will get disrupted within a few years. Clusters that suffered a central encounter with were always destroyed. An event with typically causes the cluster to loose of its stars. The energy input in a central encounter is not distributed evenly onto the cluster stars, but affects those most that are located along the trajectory of the black hole through the cluster. of the stars remain bound and form a new globular cluster like configuration within a few relaxation time scales . The binding energy of this “new” cluster however is much smaller than that of the original one by a factor of five. Therefore the next encounter of similar strength (or several more distant encounters with the same cumulative energy input) will easily disrupt the cluster. After all, it is save to take the value as an adequate upper limit to cluster survival.
The simulations also indicate that a series of distant (and therefore weak) encounters integrated over a certain period have a more serious effect on a globular cluster than one single central encounter at the beginning of this time interval leading to the same net energy input. In the first case, the excess energy is more or less evenly distributed onto the cluster stars thus leading to a high evaporation rate throughout the whole studied time interval. Whereas in the case of a central collision, some stars (alongside the trajectory of the black hole through the cluster) gain very high velocities and immediately leave the cluster taking away a large fraction of the energy input. The remaining stars stay kinematically colder and can – when the impact was not completely devastating in the first place – relax back into equilibrium, then again exhibiting the small mass loss rate of unperturbed dynamical evolution.
The exemplary case, standard cluster at with black holes of , reveals a extremely low rate of survivors within the inner of the Milky Way (Fig. 7). This analysis is extended to all models and to different black hole masses in the next section.


6 Encounter Histories for Different Globular Cluster Models in the Milky Way
Determinations of the total mass in the luminous halo of our Galaxy lead to a value around (Carney et. al. 1991; or e.g. in the range – in Suntzeff et. al. 1990). With a total mass of around in (halo) globular clusters out to (Carney et. al. 1991), the cluster to halo mass ratio is 0.015 – 0.02. The maximum allowed cluster disruption rate is obtained, assuming that all halo field stars are the debris of dissolved Galactic globular clusters, implying that the Galactic globular cluster system was about a factor of 100 more massive when it formed more then years ago than it is today. Neglecting the evolutionary differences of globular clusters of different masses and concentrations, the above ratio sets a very conservative lower limit to the survival rate of these clusters, which further can be used to obtain an upper limit on the mass of dark halo black holes: If the assumption of a certain black hole mass leads to a survival rate below , then this mass has to be discarded. With the method described in the last section we calculate for each of the ten globular cluster models the fraction of survivors for black hole masses in the range to at three galactocentric radii, , and . The result of these computations is plotted in Fig.’s 8, 9,10. The dashed line indicates the acceptance threshold at .
These figures exhibit the following trends in our model:
-
1.
Closer to the Galactic center the number density of dark halo objects increases and so does the number of encounters. Thus the range where the number of surviving globular clusters drops to zero shifts to lower black hole masses.
-
2.
Within one sequence of equal concentration, the more massive clusters are more viable. This is understandable, because the bigger the cluster is, the tighter it is bound at fixed concentration (i.e. the deeper is its own potential well) and the better can it resist the steady bombardment of background particles.
-
3.
Since and also (according to equation 1), the stability of the cluster increases with growing central density or dispersion.
-
4.
Quite unexpectedly, we find that the most stringent constraints come from the most centrally concentrated clusters #9 and #0 to #3. The larger , the more extended is the envelope of less strongly bound stars outside the core and thus the geometrical cross section of the cluster. With an extended outer region a cluster can more effectively loose stars than a less centrally concentrated and thus smaller one. Variations of the concentration index have the largest effect on the survival rate of the model clusters. It even outweighs the influence of the cluster mass, as can be seen in sequence #4, #8 and #9: The threshold of 1% survivors is reached for cluster #9 first, even though it has the highest mass in that sequence.
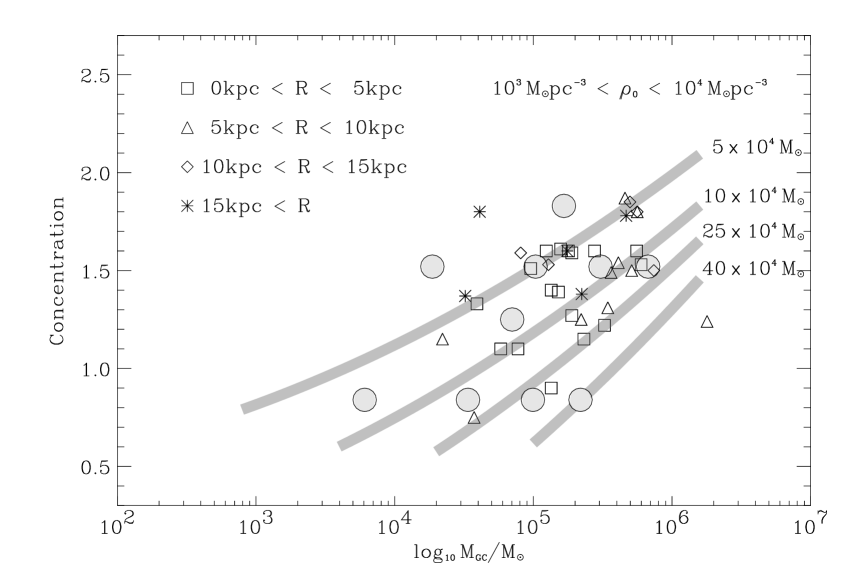
The above results have to be compared with the observation: The upper limits for black hole masses at for the ten model clusters are the strictest constraints. Since our model clusters all have central densities around and the central density is directly proportional to the total mass and thus to the depth of the potential well of the cluster it influences the binding energy of the cluster and its stability. One therefore has to compare the model clusters with Galactic globular clusters in the same density range ( – ), in order to obtain meaningful results. This is depicted in Fig. 11. Analogous to Fig.2, it shows our ten model clusters (shaded circles) and the – distribution of the Galactic globulars in the appropriate density range. The four thick gray lines confine the region of too low cluster survival rate. Globular clusters with masses and concentrations to the left of these lines have a probability of less than 1% () to survive for years in a Galactic dark halo consisting of black holes with masses , , and , respectively. These values are obtained from the calculations at , since these give the strongest constraints for the maximum allowed black hole masses. Hence we have to compare them with the globular clusters at . One sees that all these clusters fall beyond the line . Therefore is an upper limit to the mass of compact dark halo objects. This limit is more than an order of magnitude lower than the value derived by Lacey & Ostriker (1985) in order to explain the disk heating process, that possibly led to the Thick Disk component in our Galaxy. Thick Disk formation by heating due to black holes hence can be ruled out.
In our examination we concentrate on one single effect of Galactic environment on the evolution of globular clusters, the influence of massive compact objects building the dark halo of our Milky Way. It is beyond the scope of this paper to include further aspects of the dynamical evolution of Galactic globular clusters, such as disk shocking, influence of the Galactic bulge or loss of angular momentum of globular cluster orbits due to dynamical friction, driving them closer to the Galactic center. Also the role of binaries and mass segregation in the internal evolution of star clusters are not considered. Whereas the latter two are negligible for our study, the first two can be of importance especially in the inner regions of the Milky Way. Neglecting these corrosive effects when comparing our model with observed properties of the Galactic population, leads to a somewhat too large upper mass limit for the black holes. Thus, a more realistic constraint on compact dark halo objects may lie below the values derived here. Concerning globular cluster trajectories, we assume for simplicity that they are moving on circular orbits. To examine the influence of this ansatz, we determine the number of encounters with compact background objects for globular clusters on orbits with different ellipticities in the Galactic potential, using the dark matter distribution (equation 13) derived in Sect. 4. The number of encounters within a certain time interval is , with being the collision cross section and being the number density of background objects. Calculating for orbits with the same average distance to the Galactic center, i.e. the time average of is kept fixed, but ellipticities ranging from zero to one, from circular to radial orbits, we see only a moderate increase of the encounter rate by a factor of two. This effect gets stronger in a more centrally concentrated dark matter distribution than adopted in equation (13) and vanishes in a homogeneous distribution. We conclude, that using circular orbits only slightly underestimates the collision rate and thus only slightly increases the mass limit for black holes in the Galactic dark halo.
Let us now relax the stringent threshold of , adopting for example a value of , i.e. if we require 50% of the initial clusters to survive. We then get a maximum permitted black hole mass which is by a factor of about 5 smaller than before, thus pushing that value down to . Since it is very unlikely, that the halo field stars stem all from disrupted globular clusters and one can envision many other and more reasonable formation scenarios, like an intrinsic population of halo stars or debris from accreted satellite galaxies, the maximum number of disrupted clusters is more likely in the range of a few tenth of per cent. Then the method applied in this paper leads to an upper limit on of .
This number has to be compared with limits on derived by other authors. Moore (1993) obtained values which are lower by about one magnitude. He quasi-analytically computed the disruption time scale as a function of black hole mass for nine halo globular clusters in our Milky Way. Describing the cluster by a smooth density profile and thus neglecting the initial velocity dispersion of the cluster stars, he calculated the energy input per encounter. He then summed up encounters with randomly distributed impact parameters and velocities until the total energy input is equal to the binding energy. The required time interval defines his disruption time . By adjusting the black hole mass, he fixed for each particular cluster to be roughly half the typical age of a globular cluster in the Galaxy or about half the Hubble time: years. Thus he used only one encounter history to obtain his upper limit on for each cluster. Since each encounter history is dominated by only a few central impacts the scatter between different encounter histories is huge (see Fig. 7) and Moores numbers are plagued by error bars of at least one order of magnitude. We therefore conclude, that his value of is still questionable.
A different approach was taken by Rix & Lake (1993). They followed the original considerations of Lacey & Ostriker (1985) about the effects of massive dark halo objects on galactic disks, applying them to two nearby dwarf galaxies dominated by an extended dark halo: DDO 154 and GR 8. DDO 154 (similar to DDO 170, Lake et al. 1990) results in and GR 8 in .
7 Conclusion
The fact that globular cluster with masses in the range and concentrations as high as have survived for the past years provides strong constraints on the masses of black holes as possible candidates for the dark matter in our Galaxy. As globular clusters represent only a small subpopulation of the Galactic halo, a large fraction of them could indeed have been disrupted by encounters with massive black holes forming the field star population of the halo, with only a few lucky candidates being left behind. We have calculated the survival probabilities for different model clusters in the Milky Way assuming a dark halo consisting entirely of massive black holes and demonstrated that these probabilities strongly vary for individual encounter histories. In contrast to former models, we therefore propose that detailed Monte-Carlo simulations are required in order to determine the maximum allowed black hole masses. Our calculations lead to an upper mass limit of , which is somewhat larger than former estimates but on the other hand small compared to the black hole masses required to explain the formation of the Thick Disk as the result of dynamical heating by these massive objects.
The calculations cannot rule out massive black holes completely. Indeed, black holes with masses of could in principle explain the observed upper concentration limit () of globular clusters as more concentrated objects would be disrupted. This possibility however is still unlikely given the fact that observations in dwarf galaxies indicate even smaller upper mass limits.
References
- []
Allen, C.W.: 1973, Astrophysical Quantities, University of London, The Athlone Press, London
Barnes, J.E., Hut, P.: 1986, Nature, 324, 446
Bronstein, I.N., Semendjajew, K.A.: 1987, Taschenbuch der Mathematik, Verlag Harri Deutsch, Thun und Frankfurt a. Main
Carney, B.W., Latham, D.W., Laird, J.B.: 1991, AJ, 99, 572
Carr, B.J.: 1979, MNRAS, 189, 123
Carr, B.J., Bond, J.R., Arnett, W.D.: 1984, ApJ, 277, 445
Chernoff, D.F., Weinberg, M.D.: 1990, ApJ, 351, 121
Dicke, R., Peebles, P.J.E.: 1968, ApJ, 154, 891
Garret, M.A., Calder, R.J., Porcas, R.W., King, L.J., Walsh, D., Wilkinson, P.N.: 1994, MNRAS (in prep.)
Hernquist, L.: 1987, ApJSS, 64, 715
Hernquist, L.: 1990, J. Comp. Phys., 87, 137
Hut, P., Rees, M.J.: 1992, MNRAS, 259, 27
Illingworth, G., Illingworth, W.: 1976, ApJSS, 30, 277
King, I.R.: 1966, AJ, 71, 64
Lacey, C.G., Ostriker, J.P.: 1985, ApJ, 299, 633
Lake, G., Schommer, R., van Gorkom, J.: 1990, AJ, 99, 547
Landau, L.D., Lifschitz, E.M.: 1976, Lehrbuch der
Theoretischen Physik – Mechanik,
Akademie-Verlag, Berlin
Landau, L.D., Lifschitz, E.M.: 1983, Lehrbuch der Theoretischen Physik X – Physikalische Kinetik,Akademie-Verlag, Berlin
Moore, B.: 1993, ApJ, 413, L93
Peebles, P.J.E., Principles of Physical Cosmology, Princeton University Press, USA
Pfenniger, D., Combes, F., Martinet, L.: 1994a, A&A, 285, 79
Pfenniger, D., Combes, F.: 1994a, A&A, 285, 94
Rix, H.-W., Lake, G.: 1993, ApJ, 417, L1
Rubin, V.C., Burstein, D., Ford, W.K. Jr., Thonnard, N.: 1985, ApJ, 289, 81
Rubin, V.C., Ford, W.K. Jr., Thonnard, N., Burstein, D.: 1982, ApJ, 261, 439
Spitzer, L.: 1958, ApJ, 127, 17
Suntzeff, N.B., Kinman, T.D., Kraft, R.P.: 1990, ApJ, 367, 528
Webbink, R.F.: 1985, in IAU Symposium 113, Dynamics of Star Clusters, Ed. J. Goodman und P. Hut, S.541, Reidel