A Search for Ultra-High Energy Counterparts to Gamma-Ray Bursts
Abstract
A small air shower array operating over many years has been used to search for ultra-high energy (UHE) gamma radiation ( TeV) associated with gamma-ray bursts (GRBs) detected by the BATSE instrument on the Compton Gamma-Ray Observatory (CGRO). Upper limits for a one minute interval after each burst are presented for seven GRBs located with zenith angles . A excess over background was observed between 10 and 20 minutes following the onset of a GRB on 11 May 1991. The confidence level that this is due to a real effect and not a background fluctuation is 99.8%. If this effect is real then cosmological models are excluded for this burst because of absorption of UHE gamma rays by the intergalactic radiation fields.
1 Introduction
Despite the large number of GRBs detected, the sources responsible for this extraordinary phenomenon remain unidentified (Harding, 1994; Hurley, 1994). To date, the majority of GRB counterpart searches have been carried out at low energies (e.g. Schaefer, 1994), with few attempts to search for a UHE component (e.g. Alexandreas et al., 1994; Borione et al., 1993; Connaughton et al., 1993; Vallania et al., 1993). Kazanas and Ellison (1986) have predicted that proton acceleration due to diffuse shock acceleration in the atmosphere of neutron stars could produce UHE emission, while the lightning model of McBreen et al. (1994) and the fireball model of Mészáros and Rees (1993) suggest a similar result. Delayed high energy gamma ray emission, including an 18 GeV photon detected 1.5 hours after the onset of GRB940217, has been detected by the EGRET instrument onboard CGRO (Dingus et al., 1994; Hurley et al., 1994). Models predicting such emission were subsequently proposed by Mészáros and Rees (1994) and Katz (1994).
A positive detection of UHE emission would indicate an upper limit to the distance to GRB sources, since photons of such energy undergo pair production with soft photons of the intergalactic radiation fields. Absorption by the cosmic microwave background (CMB) would impose a distance constraint of Mpc for 100 TeV photons (Gould and Schreder 1966; Jelley 1966), though greater attenuation by the intergalactic infrared radiation field (IIRF) may reduce this to Mpc (Stecker et al., 1994).
A small air shower array (Plunkett et al., 1991a; 1991b) has been in operation near sea level at University College, Dublin, since early 1989. Briefly, the array consists of eight plastic scintillation counters of area 1 m2, which sample air showers over a collection area approximately m2 above a threshold primary particle energy of about 50 TeV for showers close to the zenith and a median primary particle energy of about 100 TeV. The angular resolution of the array is 3.1∘ when all eight detectors are triggered, and about 4.5∘ when three are triggered. The latter resolution was used because showers triggering at least three detectors were accepted for analysis.
The long term stability of the array was checked by the analysis of hours of accumulated data. Over this period, the number of air showers recorded over intervals of one minute were compared to a measure of the mean rate of arrival of showers, determined over a period of hours to account for variations imposed by changes in atmospheric pressure. The mean shower arrival rate was typically 35 min-1, allowing the normal approximation to the Poisson distribution to be applied to this analysis. The statistical significance of any positive excesses was computed by the maximum likelihood method of Li and Ma (1983). Both the observed and expected number of one minute time intervals which registered an excess of air showers with significances in the ranges , , and , were shown to give good agreement, thus confirming the stability of the array.
2 Data Analysis
The BATSE GRB catalogues (Fishman et al., 1994) were searched for bursts with a reported location within the field of view of the array and a Poisson positional uncertainty of , not including systematic errors. This search yielded a sample of seven GRBs with a zenith angle .
The search for UHE emission was conducted for a period of up to three hours before and after each burst, while the reported burst location was at . This period was divided into non-overlapping time intervals of ten minutes duration, to search for weak sustained emission, and an additional single interval of one minute duration after the GRB onset time. The number of showers from the burst direction was computed using a optimally sized circular source bin, which is 1.6 times the angular resolution of the array (Alexandreas et al., 1993), of radius centred on the reported location of the burst. The expected background was computed using up to eight non-overlapping bins, identical in size to the source bin, separated by in right ascension , but having the same declination as the GRB location. These bins followed the same path on the sky as the source bin, but at different times, and ensured a proper account of the variation in shower arrival rate with zenith angle for all bins.
Upper limits to the photon flux were computed by the method of Gatto et al. (1988) over a period of one minute after the GRB onset. In the case of only one burst, GRB910511, a significant delayed excess of was found at the reported location, prompting a more thorough search for the location of an optimum excess. The search process was repeated 28 times with the source and background bins shifted first in increments of in and to determine within which quadrant the excess is optimised, and subsequently in smaller steps down to to further localise the optimum source bin.
3 Results
The analysis of the seven GRBs in the sample showed no evidence for coincident UHE emission. Upper limits at the 95% confidence level, calculated over an interval of one minute after the GRB onset, are listed in Table 1.
| GRB Date | Time | Altitude | Air Showers | Photon Flux |
|---|---|---|---|---|
| (yymmdd) | (UT) | () | (cm-2 s-1) | |
| 910511 | 02:11:47.720 | 81.9 | ||
| 910512 | 15:15:09.449 | 71.6 | ||
| 910718 | 02:24:57.230 | 75.9 | ||
| 911004 | 01:27:09.760 | 70.2 | ||
| 920320 | 12:18:58.879 | 73.6 | ||
| 921101 | 18:03:55.738 | 72.9 | ||
| 931220 | 15:50:01.000 | 75.3 |
The analysis of GRB910511 revealed an excess of events from the reported location, between 10 and 20 minutes after the burst onset. This excess was noted long before the report on delayed emission by Hurley et al. (1994). As determined by BATSE this was a burst of duration 7.2 s with a peak photon flux of 4.7 cm-2 s-1, located at , , and with a Poisson positional uncertainty of . This location remained at for 1.6 hours before the burst and 3.1 hours afterwards. A detailed search, described in section two, revealed an optimum excess in a bin centred on the location , with a positional error of about . The number of counts in ten minute intervals from this source bin is shown in Fig. 1. During a ten minute interval beginning at 02:21:47 UT, a total of 36 air showers were detected compared to an expected background of 14.6 showers. This corresponds to an excess of events (the errors quoted are ), giving a statistical significance of (Li and Ma 1983). Upon examination, the arrival times of these showers appear consistent with a random distribution.
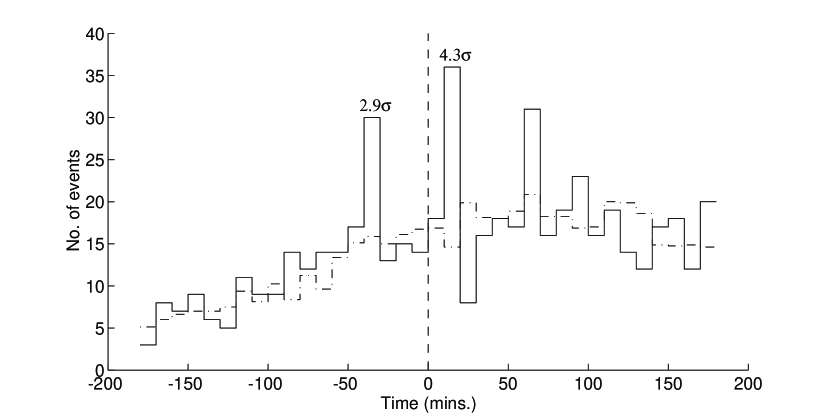
The initial number of trials made in the analysis of all seven GRBs was 150. A further 62 trials were conducted during the overlapping bin search for the optimum location of the delayed excess of air showers in the interval 10 to 20 minutes after the onset of GRB910511, and in examining the behaviour of the source over a six hour period at this location (see Fig. 1). This yields a total of 212 trials and results in a confidence level of 99.8% that this excess was caused by an UHE burst from the direction of the GRB, which occurred more than ten minutes earlier, and not by a background fluctuation. The flux of photons which is required to give the observed excess is cm-2 s-1, assuming an efficiency of 0.5 for detection of air showers. Taking a typical primary particle energy of 100 TeV for the showers detected by the array, this corresponds to a fluence of erg cm-2 s-1 averaged over the ten minute duration of the burst. An earlier excess of showers appears in Fig. 1, though with a low significance of this was rejected as a possible UHE detection.
4 Conclusions
For all seven of the GRBs in the sample, upper limits were obtained for UHE emission in a one minute time interval after the GRB onset. Evidence for delayed UHE emission accompanying GRB910511, in the interval 10–20 minutes after the initial detection, has been presented. If this effect is real an upper limit of 100 Mpc due to absorption by the CMB is imposed on the distance to the source, which might be further reduced to the order of 10 Mpc by the IIRF. It may therefore be concluded that a non-cosmological origin is expected for the source of GRB910511. Given that a large number of number of ingenious mechanisms have been proposed to account for the generation of GRBs (Nemiroff, 1994), it may be considered possible that there are contributions to the observed number of bursts from sources at both cosmological and non-cosmological distances.
Acknowledgements
The authors are indebted to Catherine Handley for her able assistance with the data analysis and to FORBAIRT for their support.
References
-
Alexandreas, D.E. et al., 1993, Nucl. Instrum. Meth. Phys. Res., A328, 570.
-
Alexandreas, D.E. et al., 1994, Astrophys. J., 426, L1.
-
Borione, A. et al.: 1993, Proc. 23rd ICRC, Calgary, 1, 57.
-
Connaughton, V. et al.: 1993, Proc. 23rd ICRC, Calgary, 1, 69.
-
Dingus, B.L. et al.: 1994, AIP Conf. Proc. 307, AIP:New York, 22.
-
Fishman, G.J. et al., 1994, Astrophys. J. Suppl., 92, 229.
-
Gatto, R. et al., 1988, Phys. Lett., B204, 81.
-
Gould, R.J. and Schreder, G. et al., 1966, Phys. Rev. Lett., 16, 252.
-
Harding, A.: 1994, in C. Fichtel et al. (eds.) AIP Conf. Proc. 304, AIP:New York, 30.
-
Hurley, K.C., 1994, Astrophys. J. Suppl., 90, 857.
-
Hurley, K.C. et al., 1994, Nature, 372, 652.
-
Jelley, J.V. et al., 1966, Phys. Rev. Lett., 16, 179.
-
Katz, J., 1994, Astrophys. J., 432, L27.
-
Kazanas, D. and Ellison, D.C., 1986, Adv. Space Res., 6, 81.
-
Li, T.P. and Ma, Y.Q., 1983, Astrophys. J., 272, 317.
-
Mészáros, P. and Rees, M.J., 1993, Astrophys. J., 418, L59.
-
Mészáros, P. and Rees, M.J., 1994, Mon. Not. Roy. Astr. Soc., 269, L41.
-
McBreen, B. et al., 1994, Mon. Not. Roy. Astr. Soc., 271, 662.
-
Nemiroff, R.J.: 1994, AIP Conf. Proc. 307, AIP:New York, 730.
-
Plunkett, S. et al., 1991a, Nucl. Instrum. Meth. Phys. Res., A300, 197.
-
Plunkett, S. et al., 1991b, Proc. 22nd ICRC (Dublin), 1, 89.
-
Schaefer, B.E.: 1994, AIP Conf. Proc. 307, AIP:New York, 382.
-
Stecker, F.W. et al., 1994, Nature, 369, 294.
-
Vallania, P. et al.: 1993, Proc. 23rd ICRC, Calgary, 1, 61.