Lognormal Properties of SGR 1806-20 and Implications for Other SGR Sources
Abstract
The time interval between successive bursts from SGR 1806-20 and the intensity of these bursts are both consistent with lognormal distributions. Monte Carlo simulations of lognormal burst models with a range of distribution parameters have been investigated. The main conclusions are that while most sources like SGR 1806-20 should be detected in a time interval of 25 years, sources with means about 100 times longer have a probability of about 5% of being detected in the same interval. A new breed of experiments that operate for long periods are required to search for sources with mean recurrence intervals much longer than SGR 1806-20.
1 Introduction
The lognormal properties of the soft repeater SGR1806-20 have been previously reported by Hurley, K.J. et al. (1994). In particular, both the time interval between repeater events and the luminosity function of the source were fit with lognormal distributions (see Aitchison and Brown, 1957, for a comprehensive introduction to lognormal statistics). This analysis used the data-base of 111 events detected by the International Cometary Explorer (ICE) mission, as reported by Laros et al. (1987).
While the present number of events observed from the other two sources (Norris et al., 1991, Kouveliotou et al., 1993) does not allow any detailed analysis, the intervals between successive events of SGR 0526-66 (Golenetskiǐ et al., 1987) is also suggestive of lognormal behaviour. Continued observations by BATSE of these sources may reveal lognormal properties for one or both of the remaining two repeaters if either passes into a phase of activity similar to the behaviour of SGR1806-20 during 1983.
The relationship between the number of active (i.e observable) sources and the true number of SGRs in the galaxy is one which is the subject of some debate (see discussions in Kouveliotou et al., 1992, Kouveliotou et al., 1994 and Hurley, K. et al., 1994). If the time interval between SGR events proves to be lognormal then there may be long quiescent periods where the source could be undetectable, leading to an underestimate of the population.
2 Simulations
In order to investigate the behaviour of sources with much longer mean recurrence times we generated Monte Carlo simulations with a variety of distribution parameters. The Monte Carlo simulations were performed using the random normal generator with Matlab 4.0 for Windows, which is based on a random number generator algorithm given by Park and Miller (1988) with the transformation to the standard normal variate given by Forsythe, Malcolm and Moler (1977). The normal variates were then transformed to lognormal variates using the relationship where is lognormally distributed (with parameters and ) and is normally distributed with mean and variance .
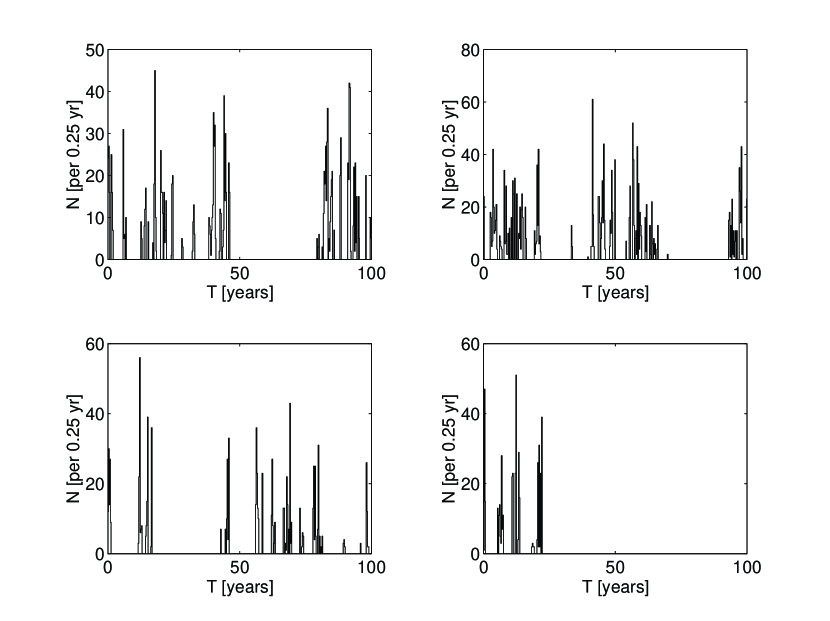
The parameters of the lognormal density function which were fit to the distribution of recurrence intervals for SGR1806-20 were , (Hurley, K.J. et al., 1994). Initially we generated 100 year long simulations of SGR1806-20 (Fig. 1) using these parameters, to check the algorithm. The samples produced were tested for compatibility with a lognormal population using a test (Sachs 1986) and were compatible at the 99% confidence level, indicating that the Monte Carlo simulator was functioning correctly. Two further simulations were then performed to investigate how the source behaviour varied as and varied. The results (illustrated in Fig. 2) are discussed below.
3 Discussion
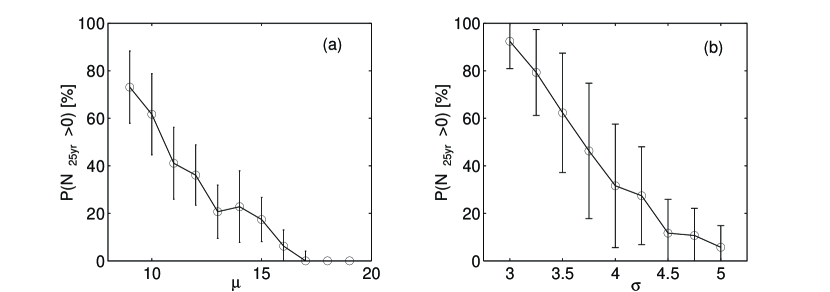
Presented in Figure 2 are the probabilities for source activity in a 25 year period as calculated from the results of the two simulations described above. Figure 2(a) shows that as the parameter increases the chance of one or more event in 25 years falls from at (geometric mean of 0.15 days) to less than 5% at (geometric mean of days).
The chance of one or more events in 25 years for a source like SGR1806-20 (that is with and ) as predicted by Figure 2 indicates that the majority of this type of source should be observed in 25 years. For experiments which operate for a long time must be devised and maintain a continuous search over the whole sky for longer periods than any spaceborne experiments designed so far. Such experiments could reveal a larger population of sources with significant gaps of inactivity.
The lognormal distribution arises in statistical processes whose completion depend on a product of probabilities, arising from a combination of independent events (Montroll and Shlesinger, 1982). Lognormal statistics have previously been used in connection with gamma-ray bursts by McBreen et al. (1994) and Brock et al. (1994). In the context of this investigation the physical significance of this statistical behaviour may lie in the connection between SGRs and neutron stars. In their paper, Hurley, K.J. et al. also presented a similar statistical analysis of the behaviour of microglitches from the Vela pulsar (Cordes, Downes and Krause-Polstroff, 1988). The time separation and the intensity of these small ( ) frequency adjustments were both compatible with lognormal distributions, and there was no correlation between waiting time and intensity: just as observed with SGR1806-20 (Laros et al., 1987). This result, combined with the identification of X-ray point sources (Murakami et al., 1994, Rothschild et al., 1994) embedded in plerion-powered SNR (Kulkarni et al., 1993) as counterparts to the SGR sources, suggests structural adjustments in neutron stars may be the cause of SGRs.
4 Conclusion
Previously it was shown that the time intervals between successive events from SGR1806-20 and the associated luminosity function were both lognormally distributed. Structural adjustments in neutron stars may be responsible for this behaviour. The activity of sources with longer mean recurrence times was investigated using Monte Carlo simulations. The results of the simulations indicate that there could exist a significant population of SGRs with means longer than SGR1806-20 that remain undetected. A new breed of experiments with very long observation times will be required to search for this type of source.
References
-
Aitchison, J. and Brown, J.A.C., 1957, The Lognormal Distribution, Cambridge University Press: Cambridge.
-
Brock, M. et al.: 1994, in Fishman, G.J.M, Brainerd, J.J, Hurley, K., ed(s), A.I.P. Conf. Proc. 307, 672.
-
Cordes, J.M., Downs, G.S. and Krause-Polstorff, J., 1988, Astrophys. J., 330, 847.
-
Forsythe, G.E., Malcolm, M.A. and Moler C.B., 1977, Computer Methods for Mathematical Computations, Prentice-Hall.
-
Golenetskiǐ, S.V. et al., 1987, Sov. Astron. Lett., 13(3), 166.
-
Hurley, K. et al., 1994, Astrophys. J., 423, 709.
-
Hurley, K.J., McBreen, B., Rabbette, M. and Steel, S., 1994, Astron. Astrophys., 288, L49.
-
Kouveliotou, C. et al., 1992, Astrophys. J., 392, 179.
-
Kouveliotou, C. et al., 1993, Nature, 362, 728.
-
Kouveliotou, C. et al., 1994, Nature, 368, 125.
-
Kulkarni, S.R. et al., 1994, Nature, 368, 129.
-
Laros, J.G. et al., 1987, Astrophys. J., 320, L111.
-
McBreen, B., Hurley, K.J., Long, R. and Metcalfe, L., 1994, MNRAS, 271, 662.
-
Montroll, E.W., Shlesinger, M.F., 1982, Proc Nat Acad Sci USA, 79, 3380.
-
Murakami, T. et al., 1994, Nature, 368, 127.
-
Norris, J.P., et al., 1991, Astrophys. J., 366, 240.
-
Park, S.K. and Miller, K.W., 1988, Comm ACM, 32(10), 1192.
-
Rothschild, R.E., Kulkarni, S.R. and Lingenfelter, R.E., 1994, Nature , 368, 432.
-
Sachs, L., 1986, Applied Statistics, Springer-Verlag: New York.,