08 (08.02.3; 08.02.6; 08.06.2; 08.16.5; 10.15.2 Sco OB2; 10.15.2 Chamaeleon)
11institutetext:
Astronomisches Institut der Universität Würzburg, Am Hubland,
97074 Würzburg, Germany
brandner@astro.uni-wuerzburg.de, kunkel@astro.uni-wuerzburg.de, hans@astro.uni-wuerzburg.de
22institutetext: Max Planck Institut für extraterrestrische Physik, 85740 Garching, Germany
jmae@mpe-garching.mpg.de
33institutetext: ESTEC – SAI, PO Box 299, 2200 AG Noordwijk, The Netherlands
amoneti@iso.estec.esa.nl
\offprintsWolfgang Brandner
Multiplicity among T Tauri stars in OB and T associations††thanks: Based on observations obtained at the European Southern Observatory, La Silla
Abstract
We present first results of a survey for companions among X-ray selected pre-main sequence stars, most of them being weak-line T Tauri stars (WTTS). These T Tauri stars have been identified in the course of optical follow-up observations of sources from the ROSAT All Sky Survey associated with star forming regions. The areas surveyed include the T associations of Chamaeleon and Lupus as well as Upper Scorpius, the latter being part of the Scorpius Centaurus OB association (Sco OB 2).
Using SUSI at the NTT under subarcsec seeing conditions we observed 195 T Tauri stars through a 1m (“Z”) filter and identified companions to 31 of them (among these 12 subarcsec binaries). Based on statistical arguments we conclude that almost all of them are indeed physical (i.e. gravitationally bound) binary or multiple systems. For 10 systems located in Upper Scorpius and Lupus, we additionally obtained spatially resolved near-infrared photometry in the J, H, and K bands with the MPIA 2.2m telescope at ESO, La Silla. The near-infrared colours of the secondaries are consistent with those of dwarfs and are clearly distinct from those of late type giant stars. Based on astrometric measurements of some binaries we show that the components of these binaries are common proper motion pairs, very likely in a gravitationally bound orbit around each other.
We find that the overall binary frequency among T Tauri stars in a range of separations between 120 and 1800 AU is in agreement with the binary frequency observed among main sequence stars in the solar neighbourhood. However, we note that within individual regions the spatial distribution of binaries – within a distinct range of separation – is non-uniform. In particular, in Upper Scorpius, WTTS in the vicinity of early type stars seem to be almost devoid of multiple systems, whereas in another area in Upper Scorpius half of all WTTS have a companion in a range of separation between 0\farcs7 and 3\farcs0. Furthermore, we find no preponderance of systems with large brightness differences between primary and companion stars (median Z = 1\fm0 …1\fm5).
We conclude that binarity is established very early in stellar evolution, that the orbital parameters of wide binaries (a 120AU) remain virtually unchanged during their pre-main sequence evolution, and that these wide binaries were formed either through collisional fragmentation or fragmentation of rotating filaments.
keywords:
ROSAT – Stars: Binaries, Pre-Main Sequence – OB association: Sco OB2, Upper Scorpius – T association: Chamaeleon, Lupus1 Introduction
Prior studies of X-ray sources associated with star forming regions based on data obtained by the EINSTEIN satellite led to the discovery of a new class of low-mass pre-main sequence stars, the so called weak-line T Tauri stars (WTTS, Feigelson & Kriss 1981, Walter & Kuhi 1981, Montmerle et al. 1983). However, the sky coverage of the EINSTEIN pointings is rather inhomogeneous and thus statistically sound studies of large samples of T Tauri stars are severely hampered by selection effects. The ROSAT All Sky Survey (“RASS”) with its uniform sky coverage provides a much more homogeneous sample and constitutes a unique database of X-ray sources in all nearby star forming regions. The number of known T Tauri stars (TTS) has grown considerably in the course of optical follow-up observations of RASS sources associated with nearby star forming regions. Alcalá et al. (1995), Wichmann (1994), and Kunkel (1995) identified the optical counterparts to about 500 RASS sources as T Tauri stars, most of them WTTS.
We now have a large and relatively unbiased sample of low-mass pre-main-sequence stars which is open for statistical studies. In our present study we aim at detecting companions to these T Tauri stars.
Most solar-type main sequence stars are members of binary or multiple systems (e.g. Duquennoy & Mayor 1991) and therefore studying star formation means to a large extent studying the formation of binary systems. Understanding binary formation holds the key for a more general understanding of star formation.
Yet, it is still unknown to what an extent the binary frequency is the same in different kinds of star forming regions like T associations, OB associations, or dense stellar aggregates like the Trapezium Cluster in Orion. There may also be systematic differences between WTTS and classical T Tauri stars (CTTS).
Recent studies among CTTS and WTTS in the Taurus-Auriga T association (Simon et al. 1992, Simon 1992, Ghez et al. 1993, Leinert et al. 1993, Richichi et al. 1994) reveal that as a lower limit 51% of all T Tauri stars in that particular region have at least one companion in a range of separations between 1.8 AU to 1800 AU (for a comprehensive compilation of all known binary and multiple systems in Taurus, see Mathieu, 1994). Thus the binary frequency in Taurus-Auriga is enhanced in comparison to main sequence stars in the solar neighbourhood, where only 40% of all G type stars show companions in the same range of separations (Duquennoy & Mayor, 1991, see also Fig.1 in Mathieu, 1994). The implications of this result are still unclear, and it is important to see if the excess holds true for other regions.
Ghez et al. (1993) find “(…) that the WTTS binary star distribution is enhanced at the closer separations ( 50AU) relative to the CTTS binary star distribution”, a result which is disputed by Leinert et al. (1993). Leinert et al. find no significant difference in the binary frequency and the distribution of separations among CTTS and WTTS. This shows that even in Taurus–Auriga, the best studied region, the results are still unclear. Results for other regions (Ghez et al. 1993, Reipurth & Zinnecker 1993) are not statistically sound because of (i) smaller sample sizes, and (ii) more limited range of separations. Clearly, one needs a larger sample size in order to establish unambiguous results.
Reipurth & Zinnecker (1993) surveyed about 230 CTTS in the southern T associations of Chamaeleon, Lupus, and Ophiuchus and identified CTTS to be binary or triple systems in a range of separations between 150AU and 1800AU. Mathieu (1994) has pointed out that this value is in agreement with the binary frequency among main sequence stars in the same range of separations within the statistical uncertainties ().
Our present study is a continuation of the work by Reipurth & Zinnecker. We define two goals: first, we want to increase the sample size by extending our survey to all the newly detected T Tauri stars in the above mentioned T associations in order to improve our statistics. In doing so, we want to look for systematic differences in binary frequency among CTTS and WTTS, since WTTS might outnumber CTTS by a factor of 2 to 10 (Walter et al. 1994, Sterzik et al. 1995), and hence dominate the statistics. Second, by including also T Tauri stars in the Scorpius–Centaurus OB association, we can for the first time compare the low-mass binary content of T and OB associations.
2 The regions under study and selection of programme stars
Throughout the whole paper we are using the two terms “WTTS” and “X-ray selected TTS” as synonyms. The same holds true for “CTTS” and “H selected TTS”. There are of course CTTS which are visible in X-rays and vice versa, but only 5% of all TTS fall into this category. We note also that the distinction between CTTS and WTTS is by no means sharp. H equivalent widths are varying and sometimes EHα = 0.5nm or EHα = 1.0nm is used to distinguish between both classes.
In addition to the ROSAT All Sky Survey also pointed observations of star forming regions were carried out by ROSAT. In contrast to the relatively short exposure times in the RASS (300–1500s), the pointed observations go much deeper (up to 35000s), and thus are more complete with respect to the low-mass PMS population of the star forming regions. However, they lack the spatial homogeneity of the RASS. Therefore, in the first part of our survey, we concentrated on the RASS sources, but – especially in Chamaeleon – also TTS detected in pointed observations were observed.
The Scorpius–Centaurus OB association (Sco OB 2) at a distance of 150 pc is the most nearby OB association (Blaauw 1964). It consists of the four subgroups Lower Centaurus - Crux, Upper Centaurus - Lupus, Upper Scorpius, and Ophiuchus. Their ages are 11 Myrs, 13 Myrs, 7 Myrs, and 2-6 Myrs, respectively (Blaauw 1991). The only O-type star still left in the entire region is the runaway star Oph (O9.5).
Blaauw (1991) derived a kinematical age of 106yrs for Oph. He concluded that the last SN explosion in Upper Scorpius, which gave “birth” to Oph as a runaway star, happened about 106yrs ago. Supernova explosions are thought to have initiated a sequential star formation process, spreading out from Upper Centaurus over Upper Scorpius to Ophiuchus, where deeply embedded young stars can still be found in the center of molecular cloud cores (e.g., Wilking et al. 1989).
In Upper Scorpius, the last SNe very likely initiated the star formation process in the dark clouds around Ophiuchi. Kunkel (1995) identified about 100 T Tauri stars in the course of optical follow-up studies of sources from the RASS in the Upper Scorpius region itself. In a parallel programme we carried out an H objective prism survey using the ESO Schmidt-telescope in order to detect and identify CTTS. In this paper, however, we will only report on the X-ray selected T Tauri stars since the identification of the H selected TTS has not yet been finished. We will report on these stars in a subsequent paper.
Situated in the immediate neighbourhood of Sco OB2 is the Lupus T association. CTTS are known in association with the four dark clouds Lupus 1 to 4 (Schwartz 1977). Wichmann (1994) has identified about 115 new TTS as counterparts to ROSAT sources. In the Scorpius and Lupus region we surveyed 74 of the 112 TTS identified by Kunkel (1995) on the basis of the RASS. Six of these stars have also been identified by Wichmann (1994) as new TTS. None of the remaining 107 new TTS from the list of Wichmann has been surveyed so far.
We additionally observed all the CTTS candidates in Lupus 4 and in the Norma region from the list of Schwartz (1977). Because of uncertainties in the association membership, their status as TTS at all (see the comments by Schwartz 1977, Table 8 & 9), and distance estimates to the Norma cloud ranging from 200pc to 940pc (see the discussion by Reipurth & Graham 1991) we did not include these stars into our final statistics (Table 5). The only binary found among these objects is Sz 128 (cf. Table 2).
The Chamaeleon T association consists of the three dark clouds Cha I, II, and III (following the designations of Schwartz 1977) at a distance between 140pc and 170pc. CTTS are only known close to Cha I and Cha II (Schwartz 1977, Whittet et al. 1987, Hartigan 1993). Follow-up studies of ROSAT observations led to the identification of about 100 new WTTS (Alcalá et al. 1995, Huenemoerder et al. 1994) spread over an area much wider than that covered by the molecular clouds themselves. All of the 95 ROSAT sources in Chamaeleon, to which TTS have been identified as optical counterparts by Alcalá et al. (1995) and/or Huenemoerder et al. (1994), have been searched for companions. In the cases where two TTS fell within the ROSAT error circle, only the one closest to the X-ray position was observed (RXJ1108.8-7519, RXJ1109.9-7629, RXJ1301.0-7654). In addition, we observed the 26 H selected TTS from the list of Hartigan (1994). Together with our previous observations (Brandner 1992, Reipurth & Zinnecker 1993) we have surveyed all 195 up to now identified TTS in Chamaeleon.
All the above mentioned optical follow-up studies of ROSAT sources have in common that they are magnitude limited with the faintest stars having m 15m – 16m. Deeper optical surveys suffer from the growing contamination by extragalactic objects. But also the ROSAT All Sky Survey itself is magnitude limited. There are WTTS too faint in X-rays to be discovered by ROSAT. Both indicates an incompleteness of our current survey towards the low-mass end of the IMF in these regions.
Finding charts and additional information (e.g., Lbol and spectral types) for the TTS in Chamaeleon can be found in Alcalá (1994), Alcalá et al. (1995), Feigelson et al. (1993), Hartigan (1993), and Huenemoerder et al. (1994), for the TTS in Upper Scorpius in Kunkel (1995), and for the TTS in Lupus in Wichmann (1994).
3 Observations and data reduction
3.1 1m imaging (NTT)
| telescope/instr. | date | filter | seeing |
|---|---|---|---|
| NTT/SUSI | 20.3.1994 | Z (1m) | 0\farcs45–0\farcs80 |
| NTT/SUSI | 17.5.1994 | Z (1m) | 0\farcs60–1\farcs10 |
| MPIA 2.2m/IRAC2B | 17.6.1994 | JHK | 0\farcs8–1\farcs3 |
| NTT/SUSI | 6./7.2.1995 | Z (1m) | 0\farcs60–1\farcs00 |

The search for close companions was carried out in four nights at the NTT under sub-arcsec seeing conditions. In 1994 March 20 we observed X-ray selected TTS in the Upper Scorpius region and in Lupus from the list of Kunkel (1995), and in 1994 May 17 we observed X-ray selected TTS in the Chamaeleon region from the list of Alcalá et al. (1995). Finally, in February 1995 we observed again the Chamaeleon region, but this time X-ray selected TTS from the list of Huenemoerder et al. (1994), and H selected TTS from the list of Hartigan (1993) as well as CTTS in Lupus 4 and Norma (Schwartz 1977). The observations were obtained with SUSI, the SUperb Seeing Imager, which is equipped with a 1K TEK CCD (ESO #25) and has an image scale of 0\farcs13/pixel. An intermediate band 1m (“Z”) filter (ESO #759 or #760, FWHM 50nm) was used. Observations in the far-red benefit from the better seeing compared to the visual and facilitate the detection of companions either embedded or of very late spectral type. The NTT is equipped with an active optics system which allows us to check (“image analysis”) and, if necessary, correct the image quality online (by adjusting the shape of the primary mirror and the position and orientation of the secondary mirror).
| ROSAT design. | (2000) | (2000) | alias | separation | PA | Z | SpT | mV | EHα |
| RXJ1039.5-7538111This star has already been observed in 1992 with SUSI/NTT. The values reported here are from Brandner (1992). | 10 39 31.8 | -75 37 56 | HD 92727 | 5\farcs040\farcs05 | 351\fdg21\fdg0 | 1.5 | G0 | 9.3+10.1 | W |
| RXJ1101.3-7627222Huenemoerder et al. (1994) already noted the binary nature of this star | 11 01 18.2 | -76 26 59 | CHXR 9C | 0\farcs960\farcs01 | 268\fdg91\fdg0 | 0.04 | 12.2(R) | W | |
| 11 02 34.1 | -77 29 12 | Hn 1 | 0\farcs680\farcs05 | 77\fdg22\fdg0 | 1.52 | 14.6(R) | |||
| RXJ1108.1-7742333Brandner (1992) identified the companion based on direct imaging (SUSI/NTT). The parameters reported there are: sep. 0\farcs69, PA , and Z=0.38. | 11 08 02.7 | -77 42 28 | VW Cha, Sz 24 | 0\farcs720\farcs03 | 178\fdg61\fdg0 | 0.25 | K5 | 12.6 | C |
| RXJ1108.2-7728 | 11 07 55.7 | -77 27 24 | CHX 10 | 1\farcs870\farcs05 | 119\fdg81\fdg0 | 1.06 | K6 | 13.60 | W |
| 11 09 19.3 | -76 30 27 | Hn 9444Hartigan (1993) reports Hn 8 to be a binary with sep. and a PA 210∘. This we could not confirm, but we found Hn 9 to be a binary with similar properties. | 0\farcs920\farcs05 | 216\fdg11\fdg0 | 1.64 | 17.0(R) | |||
| 11 14 25.9 | -77 33 06 | Hn 21 | 5\farcs540\farcs05 | 71\fdg81\fdg0 | 0.66 | 16.5+17.1(R) | |||
| 11 18 20.2 | -76 21 59 | CHXR 68b | 4\farcs460\farcs05 | 215\fdg31\fdg0 | 1.50 | 12.2(R) | W | ||
| RXJ1150.9-7411 | 11 50 44.9 | -74 11 13 | 0\farcs910\farcs03 | 106\fdg71\fdg0 | 1.38 | M4 | 14.43 | W | |
| RXJ1207.9-7555555We reobserved this close binary in Feb. 1995 and found the companion this time to be marginally brighter than the primary (Z = -0.07). | 12 07 53.5 | -75 55 14 | CPD-75 783 | 0\farcs640\farcs03 | 8\fdg22\fdg0 | 0.01 | K2 | 9.9 | W |
| RXJ1243.1-7458 | 12 42 52.0 | -74 58 46 | 2\farcs580\farcs03 | 261\fdg61\fdg0 | 1.78 | M3 | 15.10 | W | |
| RXJ1301.0-7654666This star was found to be a spectroscopic binary by Covino et al. (1995, in preparation). Thus, if this visual binary is a physical system, this star forms a hierarchical triple. | 13 00 56.3 | -76 54 02 | 1\farcs430\farcs03 | 5\fdg91\fdg0 | 1.98 | K1 | 12.5 | W | |
| 13 04 22.3 | -76 50 08 | Hn 22/23 | 6\farcs110\farcs05 | 227\fdg81\fdg0 | 1.15 | M1/M2 | 13.5+12.2(R) | ||
| 13 04 55.7 | -77 39 49 | Hn 24 | 1\farcs640\farcs03 | 183\fdg61\fdg0 | 2.44 | 13.3(R) | |||
| RXJ1517.1-3434 | 15 17 10.7 | -34 34 15 | CD-34 10292B | 0\farcs720\farcs04 | 223\fdg14\fdg0 | 2.19 | K1 | 11.1 | W |
| RXJ1525.2-3845 | 15 25 17.0 | -38 45 26 | HD 137059 | 1\farcs050\farcs02 | 217\fdg70\fdg4 | 0.16 | G5V | 9.3+9.6 | W |
| RXJ1528.7-3117 | 15 28 44.0 | -31 17 39 | HD 137727 | 2\farcs200\farcs02 | 183\fdg70\fdg1 | 0.65 | K0 | 9.4+9.9 | W |
| RXJ1530.4-3218 | 15 30 26.3 | -32 18 12 | HD 138009 | 1\farcs550\farcs02 | 25\fdg80\fdg1 | 0.14 | G6V | 9.3+9.5 | W |
| RXJ1535.8-2959 | 15 35 48.3 | -29 58 54 | 0\farcs900\farcs01 | 71\fdg80\fdg4 | 0.04 | M4 | 15.3 | C | |
| RXJ1536.5-3246 | 15 36 33.7 | -32 46 10 | 2\farcs380\farcs02 | 134\fdg60\fdg1 | 0.36 | M3 | 14.7 | W+ | |
| RXJ1537.0-3136AB | 15 37 01.9 | -31 36 37 | CD-31 12102 | 5\farcs910\farcs01 | 287\fdg40\fdg1 | 1.37 | G5 | 9.4 | W |
| RXJ1537.0-3136BC | 15 37 01.5 | -31 36 35 | CD-31 12102B | 1\farcs410\farcs01 | 132\fdg00\fdg1 | 0.18 | K7 | 12.8+12.9 | W |
| RXJ1540.2-3223 | 15 40 16.3 | -32 23 18 | 1\farcs010\farcs01 | 61\fdg61\fdg0 | 1.54 | M3 | 14.4 | W | |
| RXJ1544.0-3311 | 15 43 39.6 | -33 11 24 | 1\farcs250\farcs03 | 198\fdg20\fdg6 | 3.28 | G8 | 11.2 | W | |
| RXJ1545.2-3417777The binary nature of this star was first discussed by Brandner (1992) and Reipurth & Zinnecker (1993). | 15 45 12.7 | -34 17 30 | HT Lup, Sz 68 | 2\farcs800\farcs02 | 297\fdg30\fdg1 | 3.41 | K0 | 10.2 | W+ |
| RXJ1545.7-3020888primary saturated on the 1m image, therefore Z is only a lower limit. | 15 45 47.6 | -30 20 56 | HD 140637 | 0\farcs670\farcs03 | 348\fdg90\fdg1 | 2.0 | K3 | 9.3 | W |
| RXJ1551.4-3131 | 15 51 26.8 | -31 30 59 | 0\farcs820\farcs03 | 270\fdg51\fdg0 | 1.91 | M1 | 13.5 | W | |
| RXJ1552.5-3224 | 15 52 30.0 | -32 24 12 | 2\farcs590\farcs01 | 261\fdg40\fdg1 | 0.08 | M2 | 14.9 | W+ | |
| RXJ1554.0-2920 | 15 54 03.6 | -29 20 15 | 1\farcs390\farcs01 | 75\fdg30\fdg3 | 1.34 | M0 | 12.4 | W | |
| RXJ1554.9-2347999Ghez et al. (1993) identified the companion using 2.2m speckle imaging. The values reported there are: sep. , PA , and K=2.1. | 15 54 59.9 | -23 47 18 | HD 142361 | 0\farcs730\farcs03 | 235\fdg73\fdg0 | 2.13 | G3V | 9.1 | W |
| RXJ1555.6-3200 | 15 55 37.0 | -31 59 58 | 2\farcs950\farcs02 | 301\fdg31\fdg0 | 5.09 | M2 | 13.8 | W | |
| 15 58 07.3 | -41 51 48 | Sz 128 | 0\farcs600\farcs01 | 288\fdg84\fdg9 | 0.87 | M1 | 13.5 | C | |
| RXJ1559.2-2606 | 15 58 53.8 | -26 07 21 | HD 143018 B | 3\farcs030\farcs02 | 329\fdg61\fdg0 | 1.72 | K2 | 12.3 | W |
| RXJ1605.6-2004 | 16 05 42.7 | -20 04 15 | ScoPMS 029 | 0\farcs690\farcs03 | 355\fdg01\fdg0 | 0.55 | M1 | 14.3 | W+ |
notes:
Z: brightness difference between companion and primary at 1m.
Spectral types and mV are from Alcalá et al. (1995) and Kunkel (1995). If two values for mV are given, they correspond to the brightness of the primary and secondary, respectively (Worley & Douglass 1984). An ‘R’ indicates that we give the R rather than the V magnitude.
EHα: H equivalent width: W (E 0.5nm), W+ (0.5nm E 1.0nm), C (E 1.0nm). ”W“ includes stars with H in absorption (i.e. negative EHα)
In order to achieve a high duty cycle we applied a kind of “snap shot” mode. Only part of the whole CCD, corresponding to an field, was read out. The telescope was already pre-set to the next programme star during the read-out procedure. No guide stars were acquired. In each of the two observing nights in 1994 we obtained about 80 scientific exposures within 3 hours each, including the time spent on image analysis and refocusing the telescope. The overall efficiency, i.e. the time the CCD shutter was open in comparison to the total telescope time used, was 20%. This value may seem quite low. However, using speckle techniques or adaptive optics measurements would require a lot more overhead time without allowing us to survey the fainter stars. Thus this mode of observation does indeed make relatively efficient use of telescope time.
In all nights we found the point spread function (PSF) – even after doing image analysis – to be slightly elongated. The mean absolute elongation, i.e. the difference between the FWHM of the PSF in the direction of elongation and perpendicular to that direction, was about 0\farcs13 – independent of the seeing. See Table 1 and Fig. 1 for more information on the seeing values.
The data reduction was done following the procedures described by Brandner (1992, 1993). PSFs and close binaries were analyzed by least-squares methods using GaussFit101010GaussFit is available via anonymous ftp from clyde.as.utexas.edu in the directory /pub/gaussfit., a ‘package for least-squares-fits and robust estimation’ (Jefferys 1991). For all detected binary and multiple systems we measured separation, position angle (PA), and brightness difference (Z) between companion and primary (cf. Table 2). Simulations showed that the typical relative errors in the separation are less than 2% and in the brightness ratio are less than 5%. This accuracy is sufficient for our study.
As is evident from Fig. 1 for 85% of the exposures in Scorpius and Lupus, the seeing was 0\farcs65 or less. Because of the image elongations we could however have missed some binaries with a separation larger than 0\farcs65, if – by accident – the PA between primary and secondary should coincide with the direction of elongation. Given a mean absolute elongation of 0\farcs13 we should have resolved all binaries with separations larger than 0\farcs80, i.e., 120AU at a distance of 150pc. This value defines our completeness limit.
For the observations of TTS in Chamaeleon in 1994 May 17, the data set can be split up in two parts: during the first part (one third of the whole sample) the median value for the seeing (FWHM) was 0\farcs93. After doing image analysis, we obtained a median seeing value of 0\farcs73 for the rest of our sample. Thus for the first part of these observations we cannot claim completeness in binary detection down to 0\farcs8 and very likely have missed some of the closer binaries. However, in the second part, we should have detected almost all binaries with separations down to 0\farcs8.
In 1995 February 6 and 7 the seeing was between 0\farcs60 and 1\farcs00. If the seeing on individual exposures was worse than 0\farcs80, the stars were reobserved. Again the survey should be complete for binary separations down to 0\farcs80.
3.2 Near-infrared Imaging (MPIA 2.2m)
In 1994 June 17 we observed 13 of the multiple systems in the Scorpius region with IRAC2B in the J, H, and K band at the MPIA 2.2m telescope on La Silla. IRAC2B is equipped with a Rockwell NICMOS-3 array. With lens A, the image scale of IRAC2B is 0\farcs153 and the field size is . Each star was observed twice on different positions on the array. Thus the second frame could be used for the subtraction of sky from the first frame and vice versa.
| ROSAT design. | J | J-H | H-K |
|---|---|---|---|
| RXJ1517.1-3434 | 10\fm600\fm01 | 0\fm700\fm04 | 0\fm220\fm04 |
| RXJ1525.2-3845 A | 8\fm150\fm02 | 0\fm330\fm03 | 0\fm070\fm02 |
| B | 8\fm310\fm03 | 0\fm400\fm04 | 0\fm110\fm02 |
| RXJ1528.7-3117 A | 7\fm840\fm03 | 0\fm440\fm06 | 0\fm120\fm06 |
| B | 8\fm590\fm03 | 0\fm340\fm06 | 0\fm070\fm06 |
| RXJ1530.4-3218 A | 8\fm140\fm01 | 0\fm410\fm06 | 0\fm100\fm06 |
| B | 8\fm240\fm02 | 0\fm400\fm06 | 0\fm090\fm06 |
| RXJ1535.8-2959 A | 11\fm060\fm08 | 0\fm580\fm11 | 0\fm280\fm09 |
| B | 11\fm100\fm12 | 0\fm620\fm15 | 0\fm290\fm09 |
| RXJ1536.5-3246 A | 11\fm140\fm03 | 0\fm640\fm09 | 0\fm240\fm09 |
| B | 11\fm470\fm04 | 0\fm620\fm10 | 0\fm250\fm09 |
| RXJ1537.0-3136 A | 8\fm420\fm02 | 0\fm420\fm06 | 0\fm100\fm06 |
| B | 9\fm170\fm02 | 0\fm670\fm06 | 0\fm230\fm06 |
| C | 9\fm520\fm03 | 0\fm690\fm06 | 0\fm180\fm06 |
| RXJ1544.0-3311 A | 9\fm120\fm05 | 0\fm510\fm07 | 0\fm140\fm07 |
| B | 11\fm620\fm25 | 0\fm530\fm26 | 0\fm180\fm10 |
| RXJ1545.2-3417 A | 7\fm670\fm03 | 0\fm710\fm08 | 0\fm340\fm09 |
| B | 10\fm580\fm07 | 0\fm800\fm10 | 0\fm490\fm09 |
| RXJ1552.5-3224 A | 11\fm910\fm04 | 0\fm710\fm09 | 0\fm260\fm09 |
| B | 11\fm970\fm04 | 0\fm690\fm09 | 0\fm280\fm09 |
| RXJ1554.0-2920 A | 9\fm860\fm03 | 0\fm700\fm07 | 0\fm190\fm08 |
| B | 11\fm190\fm03 | 0\fm710\fm08 | 0\fm210\fm08 |
| RXJ1554.9-2347 | 7\fm560\fm04 | 0\fm390\fm11 | 0\fm110\fm11 |
| RXJ1605.6-2004 | 10\fm220\fm04 | 0\fm760\fm08 | 0\fm280\fm09 |
RXJ1517.1-3434, RXJ1554.9-2347, and RXJ1605.6-2004 were marginally resolved on the infrared images, but we could not derive reliable photometry for the components.
Separation, PA, and relative photometry for the components of each multiple system were determined in the same way as described above for the 1m data. Stars out of the ESO list of infrared standard stars (Bouchet 1994, priv. communication) were observed to allow for an absolute flux calibration. The photometric reduction was done within the IRAF/DIGIPHOT package. J magnitudes and J-H and H-K colours are listed in Table 3.
A comparison of our photometric results with measurements obtained with the infrared photometer at the ESO 1m (Kunkel 1995) yields a difference of 0\fm04 in J and H, and 0\fm03 in K, in the sense that the stars appear to be brighter in our measurements. No sign for variability in any of the 13 sources – apart from the systematic differences – could be found.
The seeing varied between 0\farcs8 and 1\farcs3 with a median value around 1\farcs0.
4 Selection of an unbiased sample of PMS binaries
4.1 Bias induced through X-ray selection
Despite the homogeneous sky coverage of the RASS, the effective exposure times (and hence limiting X-ray luminosities) of the X-ray selected T Tauri stars are varying. In Scorpius the RASS exposure times were about 500 sec, whereas in Chamaeleon exposure times were 2.5 times longer. Finally, the pointed ROSAT PSPC observations of the dark cloud Chamaeleon I had exposure times of 2 6 ksec (cf. Feigelson et al. 1993) and 34 ksec (cf. Alcalá 1994, Zinnecker et al. 1996, in preparation), respectively.
The high sensitivity limit of the RASS and the fact that ROSAT-unresolved binaries are statistically brighter X-ray sources than single stars induces a detection bias. While all single and binary stars with either one component exceeding the limiting X-ray luminosity L have been detected, additional binaries with component X-ray luminosity Lx just below, but combined Lx above the cut-off would cause an overestimate of the actual binary frequency.
Out of 92 H detected TTS associated with the dark cloud Chamaeleon I (Schwartz 1989, Hartigan 1993), 47 were detected in the pointed ROSAT observations. In Fig. 2 we show the integrated X-ray luminosity function of these TTS. X-ray luminosities are from Feigelson et al. (1993) and Alcalá (1994).

As has been shown already by Bouvier (1990) for TTS in Taurus and has been confirmed by Alcalá (1994) for TTS in Chamaeleon, there is no apparent correlation or anticorrelation between X-ray and H luminosity. Hence, the H selection criterion should not induce any additional bias and the integrated X-ray luminosity function should be a good representation for the overall TTS population.
A linear fit yields
i.e. in equal bins of Lx the number of stars varies with . The distribution function diverges for , but we are anyway only interested in binaries with at least one binary component exceeding .
By assuming that the stars detected in the RASS follow a X-ray luminosity function similar to the one obtained for the dark cloud Chamaeleon I, we can estimate the number of additional binaries in our survey and correct for this detection bias.
If we have a sample of N RASS sources, only form an unbiased subsample, the remaining N are binaries with the combined luminosity exceeding the limiting X-ray sensitivity. Without the use of a priori knowledge on the pairing preferences of TTS, we can estimate the maximal , assuming that all binaries with one component’s X-ray luminosity exceeding have a combined X-ray luminosity exceeding L. The completeness limit of the RASS in Chamaeleon is lg L [W] = 22.75 (Alcalá et al. 1995).

If we assume a binary frequency of 50%, we get /N = 1/6 for the RASS sources in Chamaeleon. The extra number of binaries N is 95/6 = 16 and the total number of binaries in our biased sample is 16+79/2 = 55.5.
This can be compared to the actual number of detected binaries (6 systems), yielding a “success rate” of 6/55, i.e. 11%. Applying the same success rate to the extra number of binaries due to detection bias, we find 16 0.11 1.7 systems in excess of what we would have found in an unbiased survey. Therefore the corrected binary frequency is (to be compared with 6.3% in the biased survey).
In Scorpius the X-ray luminosity completeness limit is somewhat higher because of the shorter RASS exposure times (lg Lx [W] 23.15, Kunkel 1995). From Fig. 3 we get /N = 0.3, i.e. 22.2 additional binaries among the 74 TTS. Following the same reasoning as above, we derive a “true” binary frequency of 7.0/51.8 = 13.5% (instead of 13/74 = 17.6% without correction).
Overall binary frequencies of 10% or 90% would induce smaller errors as i) for a large sample and a small binary frequency a few additional binaries would not make that much of a difference and ii) for a high binary frequency the relative number of binaries in the biased and unbiased sample would not change that much.
The “debiased” binary frequencies derived in this section present lower limits (since we assumed that all binaries with one component’s X-ray luminosity exceeding 0.5 L would be detectable) and have of course still to be corrected for chance projections and incompleteness (cf. section 7.2).
4.2 Notes on individual programme stars
In the following we briefly discuss some of the surveyed objects (see also the footnotes to Table 2):
- RXJ1301.0-7654
-
This star is also a spectroscopic binary (Covino et al. 1995) and thus very likely forms a hierarchical triple system.
- RXJ1537.0-3136
-
The only visual triple system in the whole survey. While magnitudes and separations measured by us agree well with the values listed in the Washington Double star catalogue (Worley & Douglass 1984), the PAs do not match at all. From spectral types and V magnitudes we get a ZAMS distance of 70–80pc for these stars, hence they are too distant in order to explain the discrepancy in PA by orbital motion.
- RXJ1540.2-3223
-
The identification as a TTS is uncertain. Li I is only marginally resolved, H is in absorption (Kunkel 1995).
- RXJ1554.9-2347
-
This star has already been identified by Walter et al. (1994) on the basis of EINSTEIN data as a TTS (ScoPMS 005). Ghez et al. (1993) reported a companion (see footnotes to Table 2).
- RXJ1602.1-2241
-
Mathieu et al. (1988) found this star to be an SB1 (P=2.4d, e=0.02). Ghez et al. (1993) identified a tertiary (sep. 0\farcs288, PA 347∘, K = 0\fm83). This triple system (ScoPMS 023 in Walter et al. 1994) is unresolved in our survey.
- RXJ1605.6-2004
-
This star has been identified by Walter et al. (1994) on the basis of EINSTEIN data as a TTS (ScoPMS 029).
4.3 Selection criteria for physical pairs: separation
Before trying to interpret the observations we have to be sure that we indeed observed physical binaries and not mere chance projections. Contrary to most CTTS which can be found in or close to molecular clouds, WTTS are spread out over a much wider area of the sky where no dark cloud provides an effective “screen” against contamination by background stars, especially giants. Both major regions – Scorpius/Lupus as well as Chamaeleon – lie well above or below the galactic plane, respectively (). At a galactic latitude of 15∘ the stellar density is 500 stars/square degree if we go to a limiting photographic magnitude of 16, 5000 stars/square degree for 18m, and 8000 stars/square degree for 19m (Scheffler & Elsässer, 1965). Unlike Chamaeleon, Scorpius lies in the direction to the galactic bulge (l = – ). In this direction the stellar density is even higher and reaches 9000 stars/square degree for 18m. Thus, the fainter the companion the more likely it is just a chance projection. The faintest secondary in our list is about 18m in V. The probability to find a star down to 18m within an aperture of 3′′ radius is 1% to 2%. Hence we would expect 3 false detections among the about 200 stars surveyed. RXJ1555.6-3200 (mVprim=13\fm8, Z = 5\fm1, sep = 3\farcs0) is a good candidate for such a chance projection.
If we allowed an aperture radius of 12′′ and included all stars down to a limiting magnitude of 18 in V, the probability to find a star within this aperture would already be 20% to 40%! Spectroscopic follow-up observations of faint secondaries to CTTS in Chamaeleon from the list of Brandner (1992) showed that almost all of them are indeed background giants (Brandner 1995). In order to minimize false “detections” we only consider binaries with a projected separation of 3′′ or less as sure detections. In the range of separations from 3′′ to 12′′ we have a number of binary candidates. For these objects photometric, spectroscopic, and astrometric follow-up studies are necessary to tell physical binaries from mere chance projections.
4.4 Near-infrared checks of physical companions

The near-infrared colour-colour diagram vs. is shown in Fig. 4. For comparison, the location of main sequence and giant stars is also indicated. With the exception of RXJ1545.2-3417 (Sz 68), a classical T Tauri star (Enm) associated with a reflection nebulosity (e.g., Reipurth & Zinnecker 1993) and its companion, none of the sources, primaries or secondaries, show any intrinsic IR-excess or any significant foreground extinction. Within the uncertainties, all stars have colours of dwarf stars. The lack of extinction indicates that all of the identified companions are not background stars but members of the association. The fact that both Sz 68 and its companion show an IR-excess makes it very likely that they both belong to the nebulosity and hence form a physical binary.
Systems with rather strong H emission (E 0.5nm) are marked by filled symbols. With the exception of Sz 68, they are of spectral type M2 or later. Thus, similar to the main sequence where we can find chromospherically active dMe stars, very-late type stars among X-ray selected T Tauri stars show strong activity.
Within the photometric uncertainties the NIR-colours for most primaries in general agree quite well with their spectral type and are consistent with luminosity class V. The two exceptions are RXJ1528.7-3117 (SpT K0), whose NIR-colours would suggest a slightly later spectral type for the primary (K1) and an earlier spectral type for the secondary (G8), and RXJ1544.0-3311 (SpT G8), whose NIR-colours suggest a spectral type of K2/K3 for the primary.
4.5 Common proper motion pairs
| ROSAT design. | IDS design. | epoch | separation | PA | reference | in s | in ′′ |
| RXJ1039.5-7538 | IDS 10374-7507 A | 1931 | 4\farcs9 | 347 | WDS | ||
| 1992.1 | 5\farcs040\farcs05 | 351\fdg21\fdg0 | B | ||||
| RXJ1108.1-7742 | 1992.1 | 0\farcs690\farcs01 | 178\fdg73\fdg2 | B | |||
| 1994.5 | 0\farcs720\farcs03 | 178\fdg61\fdg0 | BAKMZ | ||||
| RXJ1525.2-3845 | IDS 15189-3823 BC | 1897 | 1\farcs3 | 247∘ | WDS | -0.0032 | -0.033 |
| 1980 | 1\farcs1 | 224∘ | WDS | ||||
| 1994.3 | 1\farcs050\farcs02 | 217\fdg70\fdg4 | BAKMZ | ||||
| RXJ1528.7-3117 | IDS 15226-3057 AB | 1913 | 2\farcs2 | 179∘ | WDS | 0.0012 | 0.047 |
| 1994.3 | 2\farcs200\farcs02 | 183\fdg70\fdg1 | BAKMZ | ||||
| RXJ1530.4-3218 | IDS 15242-3158 B | 1928 | 1\farcs3 | 40∘ | WDS | -0.0022 | -0.030 |
| 1938 | 1\farcs3 | 37∘ | HIC | ||||
| 1961 | 31∘ | WDS | |||||
| 1994.3 | 1\farcs550\farcs02 | 25\fdg80\fdg1 | BAKMZ | ||||
| RXJ1537.0-3136 A–BC | IDS 15308-3117 A | 1913 | 4\farcs5 | 32∘ | WDS | -0.0021 | -0.033 |
| 1961 | 81∘ | WDS | |||||
| 1994.3 | 5\farcs2 | 283∘111111sep. and PA are between A and the “center of light” of BC. | BAKMZ | ||||
| RXJ1537.0-3136 BC | IDS 15308-3117 BC | 1934 | 1\farcs4 | 23∘ | WDS | ||
| 1945 | 7∘ | WDS | |||||
| 1994.3 | 1\farcs410\farcs02 | 132\fdg00\fdg2121212a PA of 312∘ is also possible, since C is brighter than B in the visual (Kunkel 1995). This, however, still cannot explain the large discrepancies between the PA mesasured by us and the PAs given in WDS. PAs and separation observed by Kunkel in 1993.5 are in agreement with the values determined by us. Hence there is no indication for a fast change in the relative positions of the stars. | BAKMZ | ||||
| RXJ1545.2-3417 | 1991.3 | 2\farcs6 | 298\fdg03\fdg0 | B, RZ | |||
| 1994.3 | 2\farcs800\farcs02 | 297\fdg30\fdg1 | BAKMZ | ||||
| RXJ1554.9-2347 | 1990.5 | 0\farcs800\farcs01 | 229∘1∘ | GNM | -0.0020 | -0.034 | |
| 1994.3 | 0\farcs730\farcs03 | 235\fdg73\fdg0 | BAKMZ |
References: B stands for Brandner (1992), BAKMZ for this work, GNM for Ghez et al. (1993), HIC for Hipparcos Input Catalogue (Turon et al. 1993), RZ for Reipurth & Zinnecker (1993), and WDS for the Washington Double Star Catalogue (Worley & Douglass 1984). Proper motions are from Bastian & Röser (1993). The IDS designations are out of the WDS.
Note that position angles are unprecessed (i.e., they are for the mean date of observation).
Positions and proper motions for many stars brighter than 10m in V can be found in the “Positions and Proper Motions star catalogue” (PPM, Bastian & Röser 1993). Some of the brighter binaries are already listed in the Washington Double Star catalogue (WDS, Worley & Douglass 1984). In Table 4 we have listed all binaries for which proper motions are available and/or for which at least two relative astrometric measurements from different epochs exist. In the following we discuss some of these objects in greater detail:
- RXJ1525.2-3845
-
This star is the binary with the longest time base. However, only 1/12th of a whole orbit has been observed yet. The star has moved about 3\farcs2 south and 3\farcs6 west in 97 yrs. The similarity between the separations and position angles measured in 1897, 1980, and 1994 implies that both components share the same proper motion. Hence, we attribute the changes in separation and PA solely to orbital motion: The PA has changed by 23∘ in 83yrs from 1897 to 1980 and by 6∘ in the following 14yrs. At the same time the projected separation has shrunk from 1\farcs3 to 1\farcs05. This would imply a system with an eccentricity larger than 0.2 approaching its periastron.
- RXJ1528.7-3117
-
This star has moved about 3\farcs8 north and 1\farcs2 east in 81 yrs. The constancy of the separation (2\farcs2) measured in 1913 and 1994 implies that both components share the same proper motion. The change in PA can be attributed to orbital motion.
- RXJ1530.4-3218
-
This star has moved about 2\farcs0 south and 1\farcs8 west in 66 yrs. The similarity between the separations and positions angles measured in 1928, 1938, 1961, and 1994 implies that both components share the same proper motion. The change in separation and PA can be attributed to orbital motion: The system’s PA has changed by 9∘ in 33yrs from 1928 to 1961 and by 5∘ in the following 33 yrs. At the same time the separation has grown from 1\farcs3 to 1\farcs55. This would imply a system with an eccentricity larger than 0.2 approaching its apastron.
- RXJ1537.0-3136
-
The only visual triple system observed in our survey. The primary has moved about 2\farcs7 south and 2\farcs2 west in 81 yrs. We note that the discrepancy in PA between our measurement and the values given in the WDS catalog cannot be explained by proper motion or orbital motion. On the other hand, separations and V magnitudes are in good agreement with our measurements. Observations obtained by Kunkel (1995) in 1993.5 with the CCD camera at the Dutch telescope on La Silla confirm our measurements.
- RXJ1554.9-2347
-
This star has moved about 0\farcs14 south and 0\farcs11 west in 4 yrs from 1990 to 1994. If the companion were a background object – and therefore had no significant proper motion within 4 yrs – , we would expect a separation of 0\farcs63 and a PA of 232∘ in 1994. The observed changes in separation are smaller and in PA are larger, hence we suggest that both components are association members with similar proper motions, and are very likely gravitationally bound (the relatively large change in PA could be explained by a high eccentricity orbit, i.e. e 0.5 – but note the uncertainty of in our measurements of the PA).
For the remaining objects in Table 4 no proper motion measurements could be found. Hence for all systems where we know both proper motion and relative astrometry of the components over a time base from 4 to 97 yrs we can show that they are very likely physical binary systems.
If we make some simplified assumptions, i.e., circular orbits perpendicular to the line of sight, we can – with the knowledge of the spectral type and luminosity of the primary – get a rough estimate of the physical dimensions of the orbits and hence the distance to the binaries. As most primaries described above are of spectral type G and have a luminosity of 6L⊙, we derive a system mass of 2M⊙.
For RXJ1525.2-3845, RXJ1528.7-3117, RXJ1530.4-3218, and RXJ1554.9-2347 this leads to a distance of 130 pc, 164pc, 129 pc, and 57 pc, respectively.
We note that if the real orbits deviate from the assumption of circular orbits perpendicular to the line of sight this would cause errors in our distance estimate: an (in reality) inclined orbit would result in an overestimate of the distance whereas a high eccentricity orbit with the secondary near periastron could result in an underestimate of the system’s distance. Furthermore, the short time base of only 4yrs and the relatively large uncertainty in the PA makes the distance estimate for RXJ1554.9-2347 very uncertain.
5 Spatial distribution of binaries
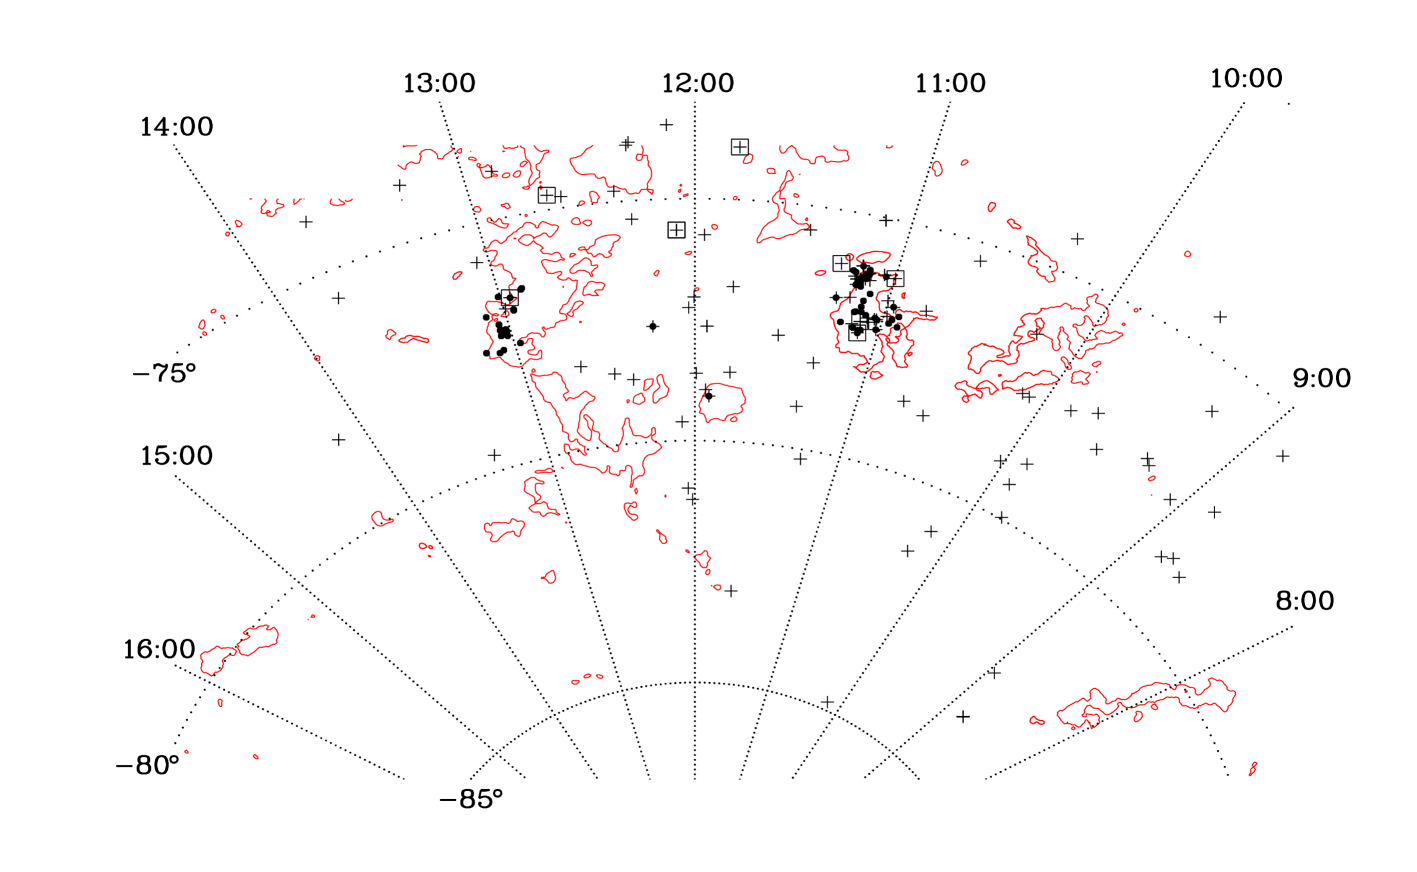 Figure 5: Adapted from Krautter et al. (1996, in preparation):
Spatial distribution of CTTS surveyed by
Reipurth & Zinnecker (1993, filled dots)
and X-ray sources, identified as T Tauri stars by Alcalá et al. (1995) or
Huenemoerder et al. (1994) and
surveyed by us (plus signs) in the Chamaeleon region.
The IRAS 100 micron contour map is overplotted.
The boxes mark TTS binaries
resolved with SUSI in our current study. Two stars are plotted as CTTS and
WTTS as the strong variability in their H emission line makes
a classification either as CTTS or WTTS uncertain.
Figure 5: Adapted from Krautter et al. (1996, in preparation):
Spatial distribution of CTTS surveyed by
Reipurth & Zinnecker (1993, filled dots)
and X-ray sources, identified as T Tauri stars by Alcalá et al. (1995) or
Huenemoerder et al. (1994) and
surveyed by us (plus signs) in the Chamaeleon region.
The IRAS 100 micron contour map is overplotted.
The boxes mark TTS binaries
resolved with SUSI in our current study. Two stars are plotted as CTTS and
WTTS as the strong variability in their H emission line makes
a classification either as CTTS or WTTS uncertain.
Figure 5 shows the spatial distribution of CTTS and WTTS in Chamaeleon, adapted from Krautter et al. (1996, in prep.). CTTS are associated with the dark clouds Chamaeleon I (west) and Chamaeleon II (east). Obviously, WTTS do spread out over a much wider area than CTTS do (Alcalá 1994, Krautter et al. 1996 in prep.). The binaries among the WTTS, however, can only be found in a relatively small area defined by the CTTS and the dark clouds. This lack of companions among WTTS could be understood, if almost all WTTS started as members of (non-hierarchical and thus unstable) triple systems, where they have been thrown out at a very early stage of PMS evolution (Harrington 1975). However, the WTTS under study are on average more massive than the CTTS (Alcalá 1994), making this scenario very unlikely. On the other hand, this lack of binaries can at least partly be explained by the inferior seeing conditions at the time of our survey in Chamaeleon.

The spatial distribution of B stars that are members of Upper Scorpius and Upper Centaurus–Lupus (de Geus et al. 1989) and TTS in the Ophiuchus–Scorpius–Lupus region is plotted in Fig. 6. TTS identified as optical counterparts to RASS sources show a rather uniform spatial distribution whereas CTTS have a clear tendency for clustering. To the south, the four distinct groups of CTTS correspond to the Lupus T association with the dark clouds Lupus 1 to 4 (from the north to the south, Schwartz 1977). To the north lies the Ophiuchi T association (Wilking et al. 1987).
The region originally surveyed by Kunkel (1995) for WTTS is marked by dashed lines. We further subdivided Upper Scorpius (US) into two distinct areas:
US–A ( to , to ) and
( to , to ),
US–B ( to , to ).
While US–A lies completely within the Upper Scorpius association, US–B is located near its periphery at the intersection between Upper Scorpius and Upper Centaurus–Lupus. The T Tauri star counterparts to RASS sources identified by Wichmann (1994) in the Lupus region have not yet been surveyed for companions.
Reipurth & Zinnecker (1993) investigated the incidence of binaries in various southern clouds and found a relation between binary frequency and the size of the individual clouds. We now discuss the distribution of binaries in Scorpius in greater detail. Among the wide–spread distribution of WTTS there is at least one “local surface density enhancement” in the northern part of US–A, where we find 21 TTS and 5 B stars within an area of 7.5 square degree, i.e. 2.8 TTS/square degree (similar to the Orion region, cf. Sterzik et al. 1995). In this particular region almost every RASS source has a T Tauri star as an optical counterpart. Interestingly, among the 17 TTS observed with SUSI/NTT, only one binary could be detected (RXJ1605.6-2004). Another small clustering can be found at = 15h25m and . Here we have 10 TTS within 2 square degree, i.e. 5 TTS/square degree. These stars have not been surveyed for multiplicity yet. A much looser association of TTS is located in US–B, where Wichmann (1994) and Kunkel (1995) identified 36 TTS within 52 square degree, i.e. 0.7 TTS/square degree. Here 13 of the 24 observed TTS show a companion.
In US–A with its higher spatial density of X-ray selected TTS ( 1.5 TTS/square degree) and B stars (0.5 B stars/square degree), only a very low binary frequency (BF, 3/25 = 12%7%) was found, whereas in US–B with a moderate spatial density of X-ray selected TTS ( 0.7 TTS/square degree) and B stars ( 0.1 B stars/square degree) the BF is higher (13/24 = 54%15%). If we accept this difference in BF (12%7% vs. 54%15%) to be significant – despite the “threats” of small number statistics, we have to ask the question why such a distinction could exist.
One possibility would be that US–A is more distant than US–B, so that the difference in BF could be explained by the difference in spatial resolution. Clearly, the more nearby an association is, the more easily we can resolve binaries within the region. The B star population of Upper Scorpius (including the runaway O type star Oph) has a mean distance modulus of 6\fm00\fm8 (163pc, see de Geus et al. 1989). The B star population of Upper Centaurus–Lupus, to which the B stars in the south western corner of Fig. 6 belong, has a mean distance modulus of 5\fm80\fm7 (145pc). The three B stars within US–B have photometric distances of 100pc, 100pc, and 130pc, respectively (de Geus et al. 1989). Hence, if the TTS stars are physically associated with the B star population, TTS in US–B are more nearby than those in US–A. This is in agreement with the finding that the WTTS in US–B show a larger Li depletion and hence are presumably older and less luminous than WTTS in US–A (Kunkel 1995). However, the difference in distance is too small to fully explain the difference in BF. The distance estimates derived from the relative astrometric measurements of some of the binaries (cf. previous section) are in good agreement with a distance between 130pc and 170pc.
Given the fact that we have a difference in binary frequency in the observed range of separations, this could either mean that the overall binary frequency is the same in both regions, but the distribution of separations among the binaries in the two regions is vastly different. Or we indeed have fewer binaries in the denser association and more in the less dense association of TTS. Durisen & Sterzik (1994) suggested such a distinction between high-temperature clouds (“clustered star formation” with lower BF) and low-temperature clouds (loose associations with higher BF). Observational evidence for this model comes from HST observations of the Trapezium cluster (Prosser et al. 1994) and the various surveys for binaries in Taurus (see Mathieu 1994 for a compilation of recent studies): the Taurus T association has a BF significantly higher than the main sequence BF, while the BF in the Trapezium cluster seems to be in agreement with the main sequence BF. The spatial density of 0.5 B stars/square degree in US–A is far from what could be called a cluster, but it is 8 times higher than in US–B (see Fig. 6).
Reipurth & Zinnecker (1993) found a weak trend that clouds with large populations of young stars may contain fewer binaries. Given the wide spread distribution of WTTS in our study, and the current lack of additional information on the kinematics of the individual stars, we cannot further subdivide the WTTS into smaller groups in order to investigate such a trend.
6 Distribution of separations and brightness differences


Figure 7 shows the distribution of binary separations among WTTS in Upper Scorpius and Chamaeleon. The number of binaries grows with smaller separation. Because of the uncertainties in the distance estimates of the binaries, however, we did not try to plot the binary frequency versus the physical separation.
The distribution of brightness difference between primary and secondary at 1m for TTS binaries with separations 0\farcs8 in shown in Fig. 8. Included are TTS located in Chamaeleon, Lupus, Ophiuchi, and Taurus from the lists of Brandner (1992, 1995), Reipurth & Zinnecker (1993), and this paper. Stars with separations smaller than 0\farcs8 have not been included since they show a clear detection bias towards equal brightness pairs.
As the maximum contribution of the stellar photosphere to the total spectral energy distribution is at about 1m (Bertout et at. 1988, Hartigan et al. 1992), the 1m observations give a good measure for the brightness differences of the “naked” stars (i.e. without additional accretion luminosity from the disk). As is evident from Fig. 8, there are fewer and fewer binaries per unit Z with increasing Z.
At first sight, this finding seems to be in contradiction to what Reipurth & Zinnecker (1993) found for the CTTS alone; however, this is not so: the only difference is that we have plotted brightness differences (in magnitudes) instead of flux ratios. Of course, in the end we are interested in the distribution of mass ratios rather than brightness differences or flux ratios.
We also show in Fig. 8 a rough estimate on the corresponding mass ratios (upper abscissa) assuming a mass–luminosity relation L M1.6 for solar-type PMS stars on purely vertical Hayashi tracks (Teff = const.), neglecting accretion luminosity and deuterium core and shell burning (Brandner 1992, Zinnecker et al. 1992).
Preferentially large brightness differences between the individual components of these wide binaries would imply large differences between primary and secondary mass. This puts an interesting constraint on theories of binary formation, as it is still unknown which process plays the dominant role. Although capture can be ruled out as a major source for binary star formation (Clarke & Pringle 1991), there remain at least three viable formation processes: fragmentation of rotating disks (Shu et al. 1990), fragmentation of a rotating filament (Zinnecker 1991, Bonnell et al. 1991) and collisional fragmentation (Pringle 1989). While the fragmentation of rotating disks should yield preferably small mass ratios between the secondary and the primary, the fragmentation of a rotating filament probably can lead to rather equal mass ratios and thus to close to unity for wide binaries. The collisional fragmentation is a more erratic process and so one expects more or less uncorrelated masses.
Mainly because of the uncertainties in our transformation from brightness differences to mass ratios and because IMFs based on observations of the luminosity function (Miller & Scalo 1979, Kroupa et al. 1990) are not corrected for “contaminations” by unresolved binaries (see Kroupa et al. 1991), at the moment we cannot favour one formation scenario over the others. Both collisional fragmentation and fragmentation of a rotating filament would produce a mass-ratio distribution in agreement with our observation. Only fragmentation of rotating disks can be ruled out with some certainty as being the major formation mechanism for wide pairs (but it still might be valid for close pairs, cf. Bonnell & Bate 1994).
7 Multiplicity
7.1 Binary frequency among G to M dwarfs

Systematic surveys for companions to late-type main-sequence stars in the solar neighbourhood have been carried out by Duquennoy & Mayor (1991) and Fischer & Marcy (1992). While the latter found 42%9% of all M type dwarfs to have one or more companions, the former found that 57%9% of all G type dwarfs possess at least one companion. Furthermore, Fischer & Marcy could show that the binary period (and semimajor axis) distribution of the M dwarfs is not greatly different form that of the G dwarfs within the error bars.
Therefore, when comparing our late-type pre-main sequence binaries with main-sequence binaries we mainly have to adjust for the binary frequency varying with spectral type (mass). Alcalá (1994) and Kunkel (1995) placed many of the TTS in Chamaeleon and Scorpius on the HR diagram and derived masses from theoretical pre-main sequence evolutionary tracks from D’Antona & Mazzitelli (1994). Figure 9 shows the mass distribution of those 84 TTS for which such mass determinations are available (Alcalá 1994, Kunkel 1995). The assumption here is that all TTS are single stars.
Almost half of the TTS are less massive than 0.8 M⊙. Hence, it seems appropriate to assume a binary frequency intermediate between M and G type stars: 50%9%. From period distribution á la Duquennoy & Mayor we then get a binary frequency of 13.5%3.0% in a range of separations between 120AU and 1800AU (see error discussion in section 7.3.).
7.2 Binary frequency among X-ray and H selected TTS
| WTTS | CTTS | WTTS+CTTS | |||||
|---|---|---|---|---|---|---|---|
| region | number | binaries (BF in %) | number | binaries (BF in %) | number | binaries (BF in %) | reference |
| Chamaeleon | 95 | 6+1.5131313Corrected for X-ray bias, incompleteness, and chance projections (see text) and normalized to the total number of TTS observed (7.92.9) | 100 | 18 (18.04.2) | 195 | 25.5 (13.12.6) | BAKMZ, B, RZ |
| Upper Scorpius | 74 | 13-1.5a (15.54.6) | — | — | 74 | 11.5 (15.54.6) | BAKMZ |
| Lupus | — | — | 60 | 9 (15.05.0) | 60 | 9 (15.05.0) | B, RZ |
| Ophiuchi | — | — | 92 | 13 (14.13.9) | 92 | 13 (14.13.9) | B, RZ |
| Taurus-Auriga | 44 | 11 (25.07.5) | 60 | 16 (26.76.7) | 104 | 27 (26.05.0) | LZWCRJHL |
| total | 213 | 30 (14.12.6) | 312 | 56 (17.92.4) | 525 | 86 (16.41.8) | |
References: B stands for Brandner (1992, 1995), BAKMZ for this work, LZWCRJH for Leinert et al. (1993), and RZ for Reipurth & Zinnecker (1993).
7.2.1 Chamaeleon
In total we have surveyed 95 X-ray selected TTS and 26 H selected TTS in Chamaeleon and 74 X-ray selected TTS in Scorpius and Lupus. In the former region 14 binaries could be identified, eleven of them having separations larger than 0\farcs8 (cf. Table 2). We get a binary frequency of 5.4%2.6% in a range of separations between 0\farcs8 and 12\farcs0 among X-ray selected T Tauri stars in Chamaeleon. From a compilation of the lists of Brandner (1992, 1995), Reipurth & Zinnecker (1993), and this paper we get in total 100 CTTS (four of them in common with our X-ray selected TTS) surveyed for multiplicity. 18 of these stars have a companion that could be confirmed as a T Tauri star in a range of separations between 0\farcs8 and 12′′ (Brandner 1995). Thus the overall BF is (11-1.7+14)/(95-15.8+100) or 13.0%2.7%, which is in good agreement with the values for main sequence stars (13.5%3.0%). Because of the less favourable seeing conditions during the first third of our survey in Chamaeleon, we could have missed 2 to 3 binaries with separations between 0\farcs8 and 1\farcs2. Also in the interval between 3′′ to 12′′ we have a couple of binary candidates which still need confirmation. Hence, one or two of the wider binaries might still be missing. On the other hand, among the 95 studied X-ray selected T Tauri stars we would expect one chance projection and 2 additional binaries because of the X-ray bias for the binaries with separations 3′′. Two additional binaries would give us a overall BF of 14.1%2.8%, a value still in good agreement with the main sequence value.
7.2.2 Scorpius and Lupus
In Scorpius and Lupus we found 13 binaries with separations between 0\farcs8 and 3′′. As pointed out above, for the identification of wider binaries we cannot rely on statistical arguments but need additional information. We again have a number of wider binary candidates which need confirmation by spectroscopy and proper motion studies. Thus, for the time being, we can only give some estimate on the number of binaries with separations between 3′′ and 12′′.
Similar to the Chamaeleon observations, we would expect 1 or 2 binaries more in the interval 3′′…12′′ – given that we have the same distribution of separations among pre-main sequence binaries as among main sequence binaries. We also expect one mere chance projection among the binaries with separations 3′′. Including the correction for the X-ray bias, we get a BF of (13-5)/(74-22.2) or 15.4%5.5%, which is – within the statistical uncertainties – in agreement with the main sequence value.
7.2.3 Summary
Table 5 summarizes the binary frequency among WTTS and CTTS in Chameleon, Upper Scorpius, Lupus, Ophiuchi, and Taurus with binary separations in the range between 120 and 1800 AU. Looking at the total number of TTS we find no significant difference in the BF of WTTS and CTTS. There is a difference in the BF of the WTTS and CTTS in Cha. However, the sample is small and the difference may not be statistically significant. In a recent model for TTS with accretion disks, Clarke et al. (1995) suggested that a magnetic gate regulates the accretion flow from the disk onto the star. Thus some stars might interchange between being classified as CTTS or WTTS, simply because the “magnetic gate” is either open or closed. Such a mechanism would help to smear out any existing difference between binary properties of CTTS and WTTS, if such a difference does indeed exist.
Without the Taurus-Auriga region, we get a BF of 14.0% 1.8% among TTS (compared to the main sequence BF of 13.5% 3.0%). If we include the Taurus-Auriga region, the BF of 16.4% 1.8% among TTS is still not greatly different to the main sequence BF. It seems that only the Taurus-Auriga T association shows an enhanced BF with respect to the main sequence and with respect to other T and OB associations or clusters (Trapezium cluster). Why this is the case, we do not know. 80 new TTS in Taurus identified by Wichmann (1994, see also Wichmann et al. 1995) have not yet been surveyed for multiplicity. Therefore, it remains to be seen if the overall BF in Taurus-Auriga stays that high.
Similar to Reipurth & Zinnecker (1993) in their study of CTTS, we find a low triple frequency among the X-ray selected TTS: only one out of the 150 TTS studied is a (candidate) visual triple. Given the limited range of separations in our study, this is further evidence that hierarchical orbits are established early in PMS multiple systems.
We come to the conclusion that binarity itself is established very early in stellar evolution, probably even before the stars are crossing the stellar “birthline” (Stahler 1983). Furthermore, there is no need for any break-up of binaries due to close encounters or any evolution of orbits, for wide binaries with separations larger than 120AU.
7.3 Error discussion
All the results on the BF of pre-main-sequence stars can only be referred to main-sequence values under some assumptions. This naturally leads to some uncertainties propagating into our analysis of the BF.
In all five star forming regions surveyed by Alcalá (Chamaeleon & Orion), Wichmann (Lupus & Taurus-Auriga), and Kunkel (Upper Scorpius & the northern part of Upper Centaurus–Lupus) WTTS could be found spread out over the whole area under study. No sharp boundaries of the star forming regions could be found. This raises the interesting question whether the WTTS are at all physically related to the dark clouds and their CTTS. At least we must assume that the spread in distance for the WTTS is comparable to their spatial extent perpendicular to the line of sight. In Chamaeleon with the dark clouds Cha I and II at a distance of 140pc and 170pc, respectively, and TTS covering a field of 40pc 30pc, this would mean that each WTTS could be located anywhere at a distance between, say, 120pc and 190pc. The same holds true for the WTTS in Upper Scorpius and Lupus, and very likely also for those in Taurus-Auriga and Orion. Thus derived luminosities for these stars and hence the position in an HRD are uncertain by at least the uncertainty in their distance estimate. The BF is not so much affected by the uncertainty in the distance.
All transformation from orbital periods to separations are based on the distribution of orbital elements for G type stars in the solar neighbourhood (Duquennoy & Mayor 1991).
-
i
uncertainty in distance estimates: The distance to the binaries is uncertain. As discussed in the text we get a distance estimate of 150pc30pc. This introduces an additional scatter in our transformation of the main sequence BF of 0.5%.
-
ii
transformation: observed separations – semi–major axes
Orbits show a random orientation in space. Because of the long orbital periods of the wide binaries we have no a priori information on the orbital parameters. From van Albada (1968) we get:
where is the observed separation, the semi–major axis, the eccentricity, and indicates the average over all possible orientations. For an eccentricity of e = 0.5, . Thus on average the error by setting the observed separation equal to the semi–major axes is about 5%.
-
iii
transformation: orbital periods – semi–major axes
The transformation from orbital periods to semi-major axes and vice versa seems to be the main uncertainty. Up to now we do not have good mass estimates for primaries and secondaries, which would be necessary for an accurate transformation for each individual system. For the transformation from orbital periods to semi-major axes we assumed a system mass of 1.5M⊙ and circular orbits. The system mass of 1.5M⊙ would, e.g., correspond to a K0V (0.8M⊙) – K5V (0.7M⊙) pair, which we assume to be the “typical” pair (cf. Table 2 for spectral types and Fig. 8 for the distribution of mass ratios)
Summing up, the overall uncertainties in the binary frequency are small enough not to affect our conclusions.
8 Summary
We have surveyed 26 H selected T Tauri stars in Chamaeleon and 169 X-ray selected T Tauri stars in Chamaeleon and Upper Scorpius for companions. Our study is complete for separations down to 0\farcs8. In total we identified 31 binaries, twelve of them having separations less than 1\farcs0.
In both major regions we find the binary frequency (WTTS & CTTS in Chamaeleon, in Scorpius WTTS only) in good agreement with the binary frequency among main sequence stars in the same range of separations. Previous studies of the Lupus and Ophiuchi T associations led to the same result. From a total of 525 T Tauri stars in the various associations (including Taurus-Auriga), 86 possess companions in a range of separations between 120AU and 1800AU. Hence, the overall binary frequency is 16.4%1.8% among TTS, and does not greatly differ from the binary frequency among low-mass main sequence stars (13.5%3.0%). Only the Taurus-Auriga T association shows an enhanced binary frequency with respect to other T and OB associations and to main sequence stars in the solar neighbourhood. If we omit the Taurus-Auriga region in our analysis we end up wih a binary frequency of 14.0%1.8% which is in very good agreement with the main sequence value.
We conclude that wide PMS binaries do not differ from main sequence binaries with respect to orbital parameters and binary frequency. Thus binary properties are established very early on in stellar evolution and orbital parameters remain unchanged afterwards.
There is no preponderance for large brightness differences between primary and secondary of individual systems. Hence, fragmentation of rotating disks plays only a subordinate role in the formation of wide binaries. Fragmentation of rotating filaments and collisional fragmentation are viable formation mechanisms for wide binaries.
Acknowledgements.
We are grateful to Bo Reipurth for obtaining part of the NTT/SUSI data and for comments and suggestions. We thank Jerome Bouvier for his constructive referee’s comments. WB was supported by a student fellowship of the European Southern Observatory and by the Deutsche Forschungsgemeinschaft (DFG) under grant Yo 5/16-1. MK & HZ acknowledge support by the DARA under grant 05 OR 9103 0. The ROSAT project was supported by the Bundesministerium für Forschung und Technologie (BMFT/DARA) and the Max-Planck-Society. This research has made use of the Simbad database, operated at CDS, Strasbourg, France, and NASA’s Astrophysics Data System (ADS), version 4.0.References
- [] van Albada T.S. 1968, Bull. Astr. Inst. Netherlands 20, 47
- [] Alcalá J.M. 1994, PhD thesis, Ruprecht-Karls-Universität Heidelberg
- [] Alcalá J.M., Krautter J., Schmitt J.H.M.M., Covino E., Wichmann R., Mundt R. 1995 A&A, submitted
- [] Bastian U., Röser S. 1993, PPM star catalogue, Spektrum, Akad. Verl. Heidelberg, Berlin
- [] Bertout C., Basri G., Bouvier J. 1988, ApJ 330, 350
- [] Blaauw A., in The Physics of Star Formation and Early Stellar Evolution, eds. C.J. Lada & N.D. Kylafis, ASI C 342, 125
- [] Bonnell I.A., Bate M.R. 1994, MNRAS 271, 999
- [] Bonnell I., Martel H., Bastien P., Arcoragi J.-P., Benz W. 1991, ApJ 377, 553
- [] Bouvier J. 1990 AJ 99, 946
- [] Brandner W. 1992, Diploma thesis, Julius-Maximilians-Universität Würzburg
- [] Brandner W. 1993, 5th ESO/ST-ECF Data Analysis Workshop, eds. Grosbøl & de Ruijscher, p. 137
- [] Brandner W. 1995, PhD thesis, Julius-Maximilians-Universität Würzburg, in preparation
- [] Clarke C.J., Pringle J.E. 1991, MNRAS 249, 588
- [] Clarke C.J., Armitage P.J., Smith K.W., Pringle J.E. 1995, MNRAS 273, 639
- [] Covino E., et al. 1995, A&A in preparation
- [] Duquennoy A., Mayor M. 1991 A&A 248, 485
- [] Durisen R.H., Sterzik M.F. 1994, A&A 286, 84
- [] Feigelson E.D., Casanova S., Montmerle T., Guibert J. 1993, ApJ 416, 623
- [] Feigelson E.D., Kriss G.A. 1981, ApJ 248, L35
- [] Fischer D.A., Marcy G.W. 1992 ApJ 396, 178
- [] de Geus E.J., de Zeeuw P.T., Lub J. 1989, A&A 216, 44
- [] Ghez A.M., Neugebauer G., Matthews K. 1993, AJ 106, 2005
- [] Harrington R.S. 1975, AJ 80, 1081
- [] Hartigan P., Kenyon S.J., Hartmann L.W., Strom S.E., Edwards S., Welty A.D., Stauffer J. 1992, ApJ 382, 617
- [] Hartigan P. 1993, AJ 105, 1511
- [] Huenemoerder D.P., Lawson W.A., Feigelson E.D. 1994, MNRAS 271, 967
- [] Jefferys W.H., McArthur B., McCartney J.E. 1991, BAAS 23(2), 997
- [] Krautter J. et al. 1996, A&A in preparation
- [] Kroupa P., Tout C.A., Gilmore G. 1990, MNRAS 244, 76
- [] Kroupa P., Tout C.A., Gilmore G. 1991, MNRAS 251, 293
- [] Kunkel M. 1995, PhD thesis, Julius-Maximilians-Universität Würzburg
- [] Leinert Ch., Zinnecker H., Weitzel N., Christou J., Ridgeway S.T., Jameson, R., Haas, M., Lenzen, R 1993, A&A, 278, 129
- [] Mathieu R.D., Walter F.M., Myers P.C. 1989, AJ 98, 987
- [] Mathieu R.D. 1994, ARA&A 32, 465
- [] Miller G.E., Scalo J.M. 1979, ApJS 41, 513
- [] Montmerle T., Koch-Miramond L., Falgarone E., Grindlay J.E. 1983, ApJ 269, 182
- [] Mundt R., Walter F.M., Feigelson E.D., Finkenzeller U., Herbig G.H., Odell A.P. 1983, ApJ 269, 229
- [] Pringle J.E. 1989, MNRAS 239, 361
- [] Reipurth B., Graham J.A. 1991, in Low Mass Star Formation in Southern Molecular Clouds, ed. Reipurth, ESO Scientific Report 11, p. 149
- [] Reipurth B., Zinnecker H. 1993, A&A, 278, 81
- [] Prosser C.F., Stauffer J.R., Hartmann L., Soderblom D.R., Jones B.F., Werner M.W., McCaughrean M.J. 1994 ApJ 421, 517
- [] Richichi A., Leinert Ch., Jameson R., Zinnecker H. 1994, A&A 287, 145
- [] Scheffler H., Elsässer H. 1965, Landolt-Börnstein, ed. K.H. Hellwege, p. 604
- [] Schwartz R.D. 1977, ApJS 35, 161
- [] Schwartz R.D. 1989, in Low Mass Star Formation in Southern Molecular Clouds, ed. Reipurth, ESO Scientific Report 11, p. 93
- [] Shu F.H., Tremaine S., Adams F.C., Ruden S.P. 1990, ApJ 370, L31
- [] Simon M. 1992, in Complementary Approaches to Double and Multiple Star Research, eds. H.A. McAlister & W.I. Hartkopf, IAU Coll. 135, 41
- [] Simon M., Chen W.P., Howell R.R., Slovik D. 1992, ApJ 384, 212
- [] Stahler S.W. 1983, ApJ 274, 822
- [] Sterzik M.F., Alcalá J.M., Neuhäuser R., Schmitt J.H.M.M. 1995, A&A 297, 418
- [] Turon C., Crézé M., Egret D., et al. 1992, The Hipparcos Input Catalogue, ESA, published in electronic form
- [] Walter F.M., Kuhi L.V. 1981, ApJ 250, 254
- [] Walter F.M., Vrba F.J., Mathieu R.D., Brown A., Myers P.C. 1994, AJ 107, 692
- [] Whittet D.C.B., Assendorp R., Prusti T., Roth M., Wesselius P.R. 1991, A&A 251, 524
- [] Wichmann R. 1994, PhD thesis, Ruprecht-Karls-Universität Heidelberg
- [] Wichmann R., Krautter J., Schmitt J.H.M.M., et al. 1995, A&A in preparation
- [] Wilking B.A., Schwartz R.D., Blackwell J.H. 1987, AJ 94, 106
- [] Worley C.E., Douglass G.G. 1984, The Washington Double star catalog, US Naval Obs., published in electronic form
- [] Zinnecker H. 1991, IAU Symp. 147, 526
- [] Zinnecker H., Brandner W., Reipurth B. 1992, in Complementary Approaches to Double and Multiple Star Research, eds. H.A. McAlister & W.I. Hartkopf, IAU Coll. 135, p. 50
- [] Zinnecker et al. 1996, A&A in preparation